. 2024 Apr 3;21(1):82.
doi: 10.1186/s12974-024-03073-z.

Cranial irradiation disrupts homeostatic microglial dynamic behavior

Affiliations

Cranial irradiation disrupts homeostatic microglial dynamic behavior

Alexandra O Strohm et al. J Neuroinflammation. .

Abstract

Cranial irradiation causes cognitive deficits that are in part mediated by microglia, the resident immune cells of the brain. Microglia are highly reactive, exhibiting changes in shape and morphology depending on the function they are performing. Additionally, microglia processes make dynamic, physical contacts with different components of their environment to monitor the functional state of the brain and promote plasticity. Though evidence suggests radiation perturbs homeostatic microglia functions, it is unknown how cranial irradiation impacts the dynamic behavior of microglia over time. Here, we paired in vivo two-photon microscopy with a transgenic mouse model that labels cortical microglia to follow these cells and determine how they change over time in cranial irradiated mice and their control littermates. We show that a single dose of 10 Gy cranial irradiation disrupts homeostatic cortical microglia dynamics during a 1-month time course. We found a lasting loss of microglial cells following cranial irradiation, coupled with a modest dysregulation of microglial soma displacement at earlier timepoints. The homogeneous distribution of microglia was maintained, suggesting microglia rearrange themselves to account for cell loss and maintain territorial organization following cranial irradiation. Furthermore, we found cranial irradiation reduced microglia coverage of the parenchyma and their surveillance capacity, without overtly changing morphology. Our results demonstrate that a single dose of radiation can induce changes in microglial behavior and function that could influence neurological health. These results set the foundation for future work examining how cranial irradiation impacts complex cellular dynamics in the brain which could contribute to the manifestation of cognitive deficits.

Keywords: Microglia; Radiation; Two-photon microscopy.


Conflict of interest statement

The authors declare no conflicts of interest.

Figures
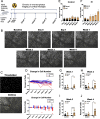
Fig. 1
Fig. 1
Microglia numbers decrease following cranial irradiation. A Experimental timeline (created with BioRender.com) B Representative images of microglia in the same area of the S1 over time at Baseline, Day 0 (5–9 h post-irradiation), Day 1, Week 1, Week 2, Week 3, and Week 4. Scale bar: 100 microns. C Example images of microglia after binarization (top) and outlines of microglia identified in binarized images superimposed on original images (bottom). D Percent change in microglial cell number for control and irradiated mice over time. Top panel shows individual animals over time while the bottom panel compares the percent change in cell number between control and IR groups. Percent of microglial cells lost or gained over time in E control and F Irradiated mice. Percent of microglial cells lost and gained at G Week 1, H Week 2, I Week 3, and J Week 4 in control and Irradiated mice. Mixed-effect analysis with Bonferroni’s post-hoc comparisons (D) or Wilcoxon matched-pairs signed rank test with Bonferroni-Dunn’s correction for multiple comparisons (GJ). * = p < 0.05. Data are presented as mean ± SEM. Each data point represents an individual animal. n = 7–10 mice per timepoint per group
Fig. 2
Fig. 2
Microglia Reorganize to Compensate for Cell Loss Following Cranial Irradiation. A Percent change in the average nearest neighbor distance for microglia in control and Irradiated mice over time. Histograms showing the distribution of microglia nearest neighbor distances at B Week 1, C Week 2, D Week 3, and E Week 4 for control and irradiated mice. F Percent change in spacing index (squared average NND multiplied by the density for each image) for control and Irradiated mice over time. Mixed-effects analysis with Bonferroni’s post-hoc comparisons (A, F) or two-way ANOVA with Bonferroni’s post-hoc comparisons (B–E). * = p < 0.05, ** = p < 0.01. Data are presented as mean ± SEM. Each data point represents an individual animal. n = 7–10 mice per timepoint per group
Fig. 3
Fig. 3
Cranial irradiation has subtle effects on microglial displacement in the cortex. A Displacement of microglial cells when comparing the baseline imaging session to subsequent timepoints in IR and control mice. The mean nearest neighbor distance did not change between IR and control mice. Histogram of displacement values for microglia comparing the baseline imaging sessions and subsequent timepoints in B control and C Irradiated mice. Comparisons of IR and control mice showed fewer stable microglia (with nearest neighbor distance of < 10 microns at D Day0, E Week 1, but not F Week 4 in IR mice. G Displacement of microglial cells when comparing consecutive imaging sessions in IR and control mice. The mean nearest neighbor distance did not change between IR and control mice. Histogram of displacement values for microglia comparing the baseline imaging session and subsequent timepoints in H control and I Irradiated mice. Notice that in this case, the consecutive comparison of the baseline imaging session to Day 0 is the same as in A–D. J Comparisons of IR and control mice showed fewer microglia with displacement of 10–20 microns between Week 2 and Week 3 only in IR mice. Mixed-effects analysis with Bonferroni’s post-hoc comparisons (A , G) or two-way ANOVA with Bonferroni’s post-hoc comparisons (D–F, J). * = p < 0.05, ** = p < 0.01. Data are presented as mean ± SEM. For panels B, C, H, and I SEMs were < 12%. Each data point represents an individual animal. n = 7–10 mice per timepoint per group for all panels
Fig. 4
Fig. 4
Microglia ramification is unaffected by cranial irradiation. A Example image of an individual microglia. Scale bar = 20 microns B Image of the same microglia after thresholding C Representation of Sholl analysis demonstrating concentric circles drawn at increasing radii from the center of the soma D Sholl curves for control and irradiated mice at baseline and Week 4. Sholl curves for E control and F irradiated mice at different time points. G Percent change in maximum number of intersections for control and irradiated mice over time. H Percent change in mean number of intersections for control and irradiated mice over time. I Percent change in area under the curve for control and irradiated mice over time. Mixed-effects analysis with Bonferroni’s post-hoc comparisons (G–I). Total cells analyzed per group: Control = 158, IR = 126. Data are presented as mean ± SEM. Each data point represents an individual animal. Sholl curves in D–F are presented as the mean for each group and timepoint specified. n = 8–11 mice per timepoint per group
Fig. 5
Fig. 5
Microglia morphology is unaffected by cranial irradiation. A Example image of an individual microglia. Scale bar = 20 microns B Image of the same microglia after thresholding representing the whole microglial cell. C The microglial soma and processes were identified manually. D Percent change in microglia size for control and Irradiated mice over time. E Percent change in process size for control and irradiated mice over time F Percent change in soma size for control and irradiated mice over time G Percent change in soma to process ratio for control and irradiated mice over time Mixed-effects analysis with Bonferroni’s post-hoc comparisons (DG). Total cells analyzed per group: Control = 158, IR = 126. Data are presented as mean ± SEM. Each data point represents an individual animal. n = 8–11 mice per timepoint per group.
Fig. 6
Fig. 6
Microglia dynamics are altered following cranial irradiation. A Representative images used for dynamic measurements of microglia in the same area of cortex at different time points. Scale bar = 25 microns. B Representative image of binarized microglia at time = 0 min (T0) in magenta, time = 5 min (T5) in green, and merged timepoints. White represents pixels that are stable for both timepoints, while magenta represents retracted processes and green represents extended processes. C Percent change in microglial coverage for control and Irradiated mice over time. D Percent change in microglial surveillance index for control and irradiated mice over time. E Percent change in microglial motility Index for control and irradiated mice over time. F Percent change in microglial motility to coverage ratio for control and irradiated mice over time. G) Percent change in microglial motility to surveillance ratio for control and irradiated mice over time. Mixed-effects analysis with Bonferroni’s post-hoc comparisons (C–G). * = p < 0.05, ** = p < 0.01. Data are presented as mean ± SEM. Each data point represents an individual animal. n = 9–11 mice per timepoint per group
Fig. 7
Fig. 7
Summary schematic showing loss of homeostatic cortical dynamics at different timepoints following cranial irradiation. Created with BioRender.com

Similar articles

Cited by

References

    1. Pazzaglia S, et al. Neurocognitive decline following radiotherapy: mechanisms and therapeutic implications. Cancers (Basel) 2020;12(1):146. doi: 10.3390/cancers12010146. - DOI - PMC - PubMed
    1. Delaney G, et al. The role of radiotherapy in cancer treatment: estimating optimal utilization from a review of evidence-based clinical guidelines. Cancer. 2005;104(6):1129–1137. doi: 10.1002/cncr.21324. - DOI - PubMed
    1. Turnquist C, Harris BT, Harris CC. Radiation-induced brain injury: current concepts and therapeutic strategies targeting neuroinflammation. Neurooncol Adv. 2020;2(1):vdaa057. - PMC - PubMed
    1. Moding EJ, Kastan MB, Kirsch DG. Strategies for optimizing the response of cancer and normal tissues to radiation. Nat Rev Drug Discov. 2013;12(7):526–542. doi: 10.1038/nrd4003. - DOI - PMC - PubMed
    1. De Ruysscher D, et al. Radiotherapy toxicity. Nat Rev Dis Prim. 2019;5(1):13. doi: 10.1038/s41572-019-0064-5. - DOI - PubMed

LinkOut - more resources