

Repetitive transcranial magnetic stimulation ameliorates cognitive deficits in mice with radiation-induced brain injury by attenuating microglial pyroptosis and promoting neurogenesis via BDNF pathway
- PMID: 38570868
- PMCID: PMC10988892
- DOI: 10.1186/s12964-024-01591-0
Repetitive transcranial magnetic stimulation ameliorates cognitive deficits in mice with radiation-induced brain injury by attenuating microglial pyroptosis and promoting neurogenesis via BDNF pathway
Abstract
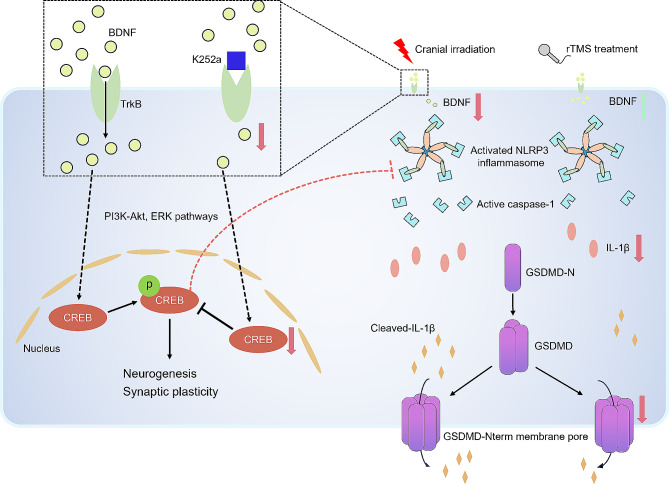
Background: Radiation-induced brain injury (RIBI) is a common and severe complication during radiotherapy for head and neck tumor. Repetitive transcranial magnetic stimulation (rTMS) is a novel and non-invasive method of brain stimulation, which has been applied in various neurological diseases. rTMS has been proved to be effective for treatment of RIBI, while its mechanisms have not been well understood.
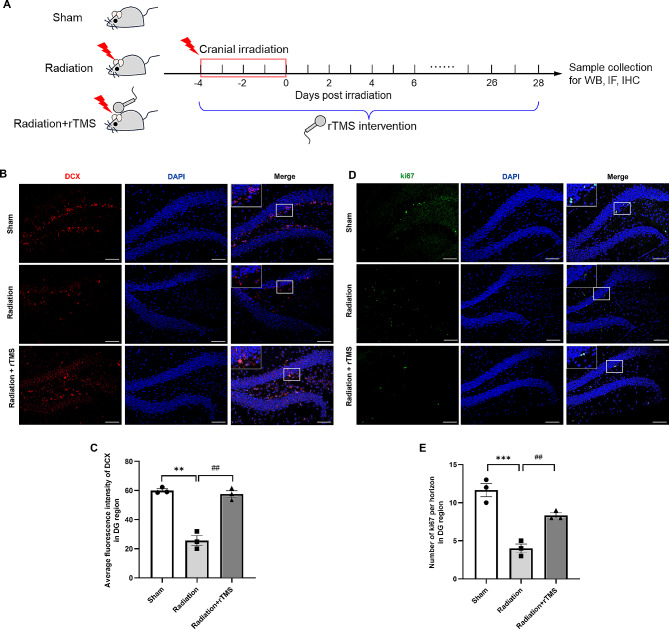
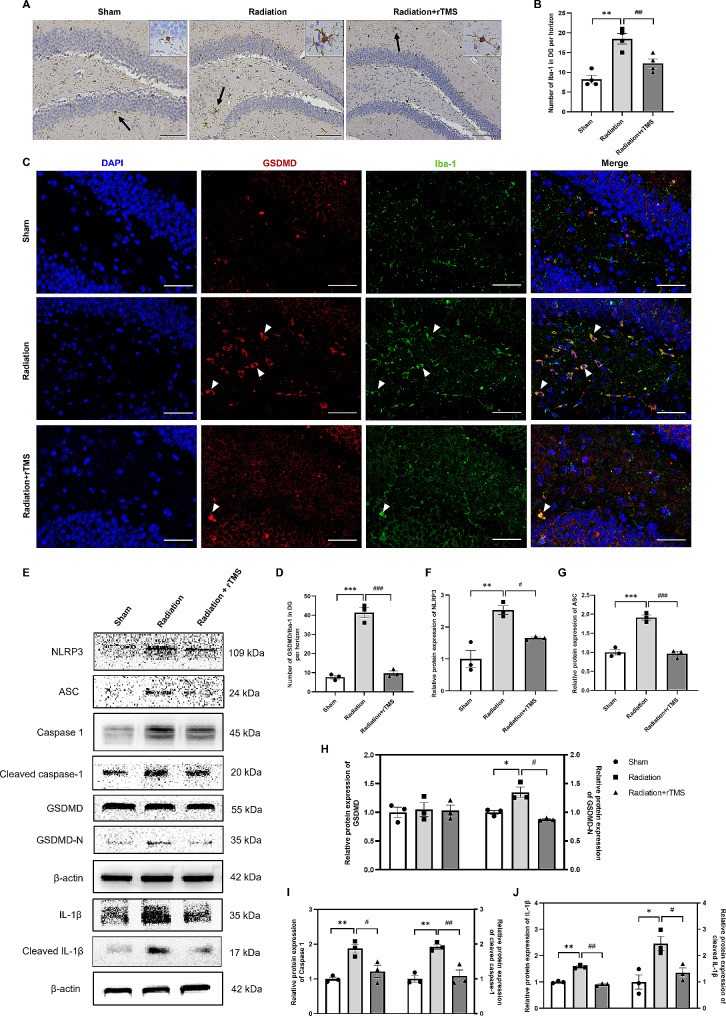
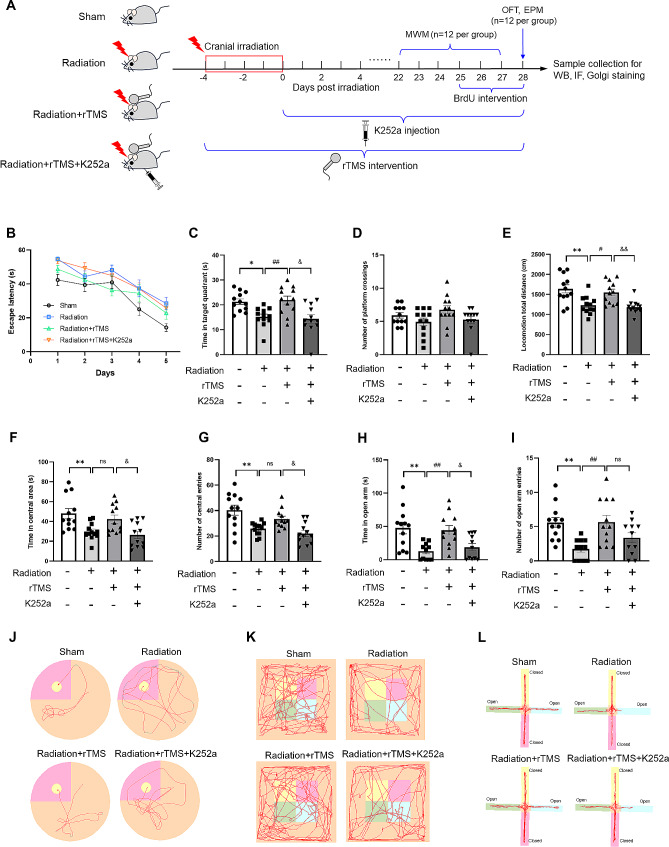
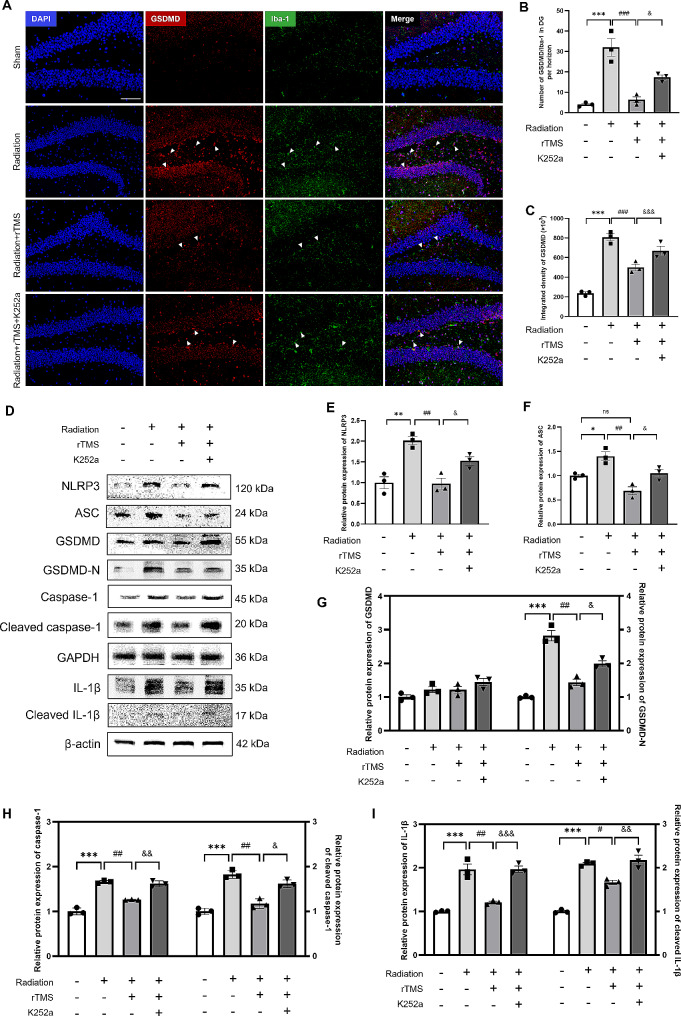
Methods: RIBI mouse model was established by cranial irradiation, K252a was daily injected intraperitoneally to block BDNF pathway. Immunofluorescence staining, immunohistochemistry and western blotting were performed to examine the microglial pyroptosis and hippocampal neurogenesis. Behavioral tests were used to assess the cognitive function and emotionality of mice. Golgi staining was applied to observe the structure of dendritic spine in hippocampus.
Results: rTMS significantly promoted hippocampal neurogenesis and mitigated neuroinflammation, with ameliorating pyroptosis in microglia, as well as downregulation of the protein expression level of NLRP3 inflammasome and key pyroptosis factor Gasdermin D (GSDMD). BDNF signaling pathway might be involved in it. After blocking BDNF pathway by K252a, a specific BDNF pathway inhibitor, the neuroprotective effect of rTMS was markedly reversed. Evaluated by behavioral tests, the cognitive dysfunction and anxiety-like behavior were found aggravated with the comparison of mice in rTMS intervention group. Moreover, the level of hippocampal neurogenesis was found to be attenuated, the pyroptosis of microglia as well as the levels of GSDMD, NLRP3 inflammasome and IL-1β were upregulated.
Conclusion: Our study indicated that rTMS notably ameliorated RIBI-induced cognitive disorders, by mitigating pyroptosis in microglia and promoting hippocampal neurogenesis via mediating BDNF pathway.
Keywords: BDNF; Neurogenesis; Neuroinflammation; RIBI; rTMS.
© 2024. The Author(s).
Conflict of interest statement
The authors declare no competing interests.
Figures


Similar articles
-
The brain-derived neurotrophic factor mimetic 7,8-dihydroxyflavone mitigates NLRP3 inflammasome activation and GSDMD-mediated pyroptosis and enhances the negative regulatory pathways of pyroptosis in microglia.J Neuroimmunol. 2025 Sep 15;406:578684. doi: 10.1016/j.jneuroim.2025.578684. Epub 2025 Jul 5. J Neuroimmunol. 2025. PMID: 40638969
-
Orexin A alleviates chronic cerebral hypoperfusion-induced neuroinflammation and cognitive dysfunction by inhibiting the NEK7/NLRP3 pathway.Exp Neurol. 2025 Nov;393:115378. doi: 10.1016/j.expneurol.2025.115378. Epub 2025 Jul 19. Exp Neurol. 2025. PMID: 40691984
-
CPCGI Alleviates Neural Damage by Modulating Microglial Pyroptosis After Traumatic Brain Injury.CNS Neurosci Ther. 2025 Mar;31(3):e70322. doi: 10.1111/cns.70322. CNS Neurosci Ther. 2025. PMID: 40059065 Free PMC article.
-
Non-pharmacological interventions for improving language and communication in people with primary progressive aphasia.Cochrane Database Syst Rev. 2024 May 29;5(5):CD015067. doi: 10.1002/14651858.CD015067.pub2. Cochrane Database Syst Rev. 2024. PMID: 38808659 Free PMC article.
-
Non-invasive brain stimulation techniques for chronic pain.Cochrane Database Syst Rev. 2018 Mar 16;3(3):CD008208. doi: 10.1002/14651858.CD008208.pub4. Cochrane Database Syst Rev. 2018. Update in: Cochrane Database Syst Rev. 2018 Apr 13;4:CD008208. doi: 10.1002/14651858.CD008208.pub5. PMID: 29547226 Free PMC article. Updated.
Cited by
-
Elucidating the complexity of radiation-induced brain injury: comprehensive assessment of hippocampal and cortical impacts.J Neurooncol. 2025 Jul;173(3):571-582. doi: 10.1007/s11060-025-05018-9. Epub 2025 Apr 17. J Neurooncol. 2025. PMID: 40244522
-
BDNF augmentation reverses cranial radiation therapy-induced cognitive decline and neurodegenerative consequences.Acta Neuropathol Commun. 2024 Dec 18;12(1):190. doi: 10.1186/s40478-024-01906-9. Acta Neuropathol Commun. 2024. PMID: 39696694 Free PMC article.
-
Adult Hippocampal Neurogenesis as a Therapeutic Target in Fetal Alcohol Spectrum Disorder.Adv Exp Med Biol. 2025;1473:93-109. doi: 10.1007/978-3-031-81908-7_5. Adv Exp Med Biol. 2025. PMID: 40128476 Review.
-
ROS-regulated SUR1-TRPM4 drives persistent activation of NLRP3 inflammasome in microglia after whole-brain radiation.Acta Neuropathol Commun. 2025 Jan 27;13(1):16. doi: 10.1186/s40478-025-01932-1. Acta Neuropathol Commun. 2025. PMID: 39871308 Free PMC article.
-
Promising therapeutic effects of high-frequency repetitive transcranial magnetic stimulation (HF-rTMS) in addressing autism spectrum disorder induced by valproic acid.Front Neurosci. 2024 Aug 22;18:1385488. doi: 10.3389/fnins.2024.1385488. eCollection 2024. Front Neurosci. 2024. PMID: 39238929 Free PMC article.
References
MeSH terms
Substances
LinkOut - more resources
Full Text Sources
