. 2024 Apr 3;15(1):13.
doi: 10.1186/s13229-024-00594-5.

Neuroligin-2 shapes individual slow waves during slow-wave sleep and the response to sleep deprivation in mice

Affiliations

Neuroligin-2 shapes individual slow waves during slow-wave sleep and the response to sleep deprivation in mice

Tanya Leduc et al. Mol Autism. .

Abstract

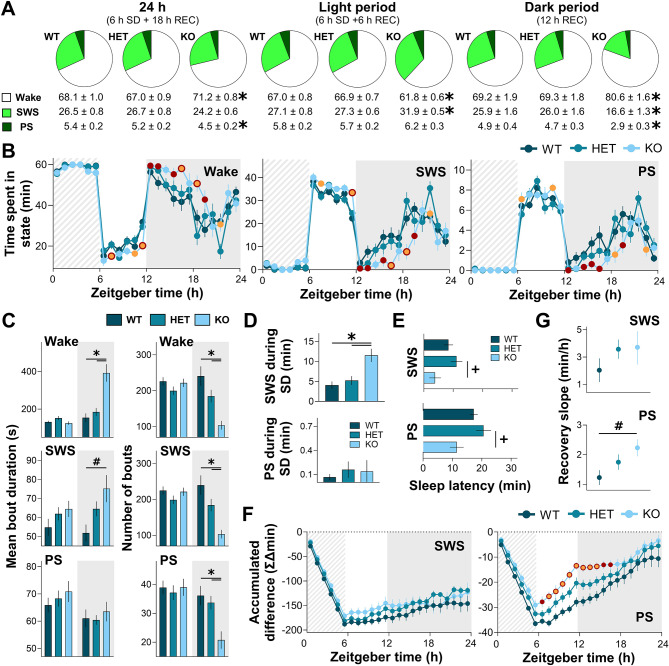
Background: Sleep disturbances are a common comorbidity to most neurodevelopmental disorders and tend to worsen disease symptomatology. It is thus crucial to understand mechanisms underlying sleep disturbances to improve patients' quality of life. Neuroligin-2 (NLGN2) is a synaptic adhesion protein regulating GABAergic transmission. It has been linked to autism spectrum disorders and schizophrenia in humans, and deregulations of its expression were shown to cause epileptic-like hypersynchronized cerebral activity in rodents. Importantly, the absence of Nlgn2 (knockout: KO) was previously shown to alter sleep-wake duration and quality in mice, notably increasing slow-wave sleep (SWS) delta activity (1-4 Hz) and altering its 24-h dynamics. This type of brain oscillation is involved in memory consolidation, and is also a marker of homeostatic sleep pressure. Sleep deprivation (SD) is notably known to impair cognition and the physiological response to sleep loss involves GABAergic transmission.

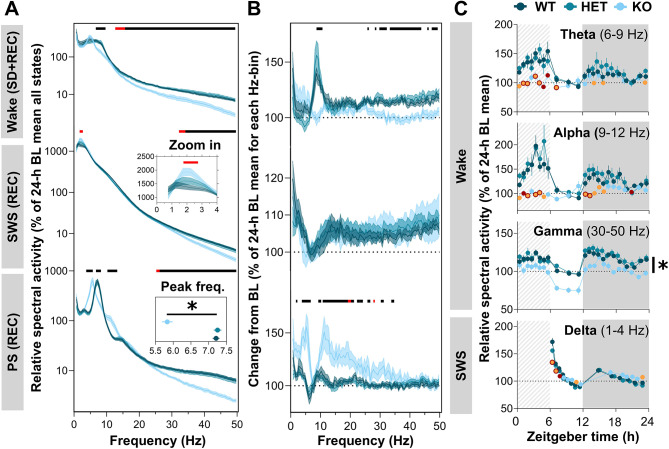
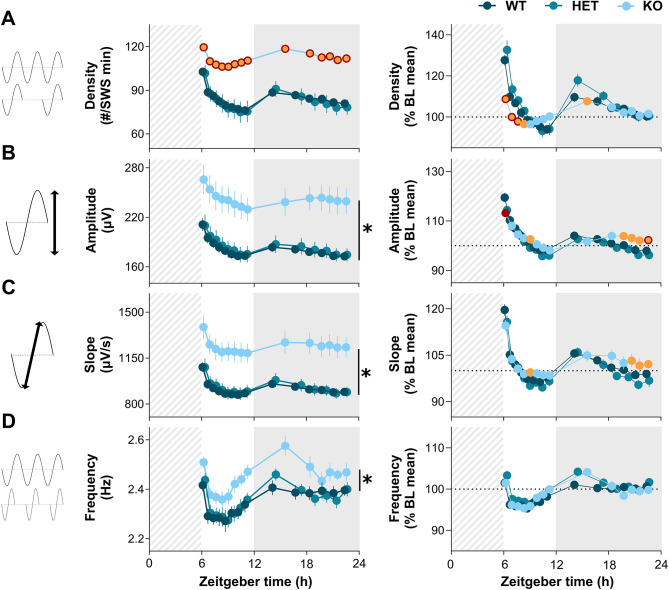
Methods: Using electrocorticographic (ECoG) recordings, we here first aimed to verify how individual slow wave (SW; 0.5-4 Hz) density and properties (e.g., amplitude, slope, frequency) contribute to the higher SWS delta activity and altered 24-h dynamics observed in Nlgn2 KO mice. We further investigated the response of these animals to SD. Finally, we tested whether sleep loss affects the gene expression of Nlgn2 and related GABAergic transcripts in the cerebral cortex of wild-type mice using RNA sequencing.

Results: Our results show that Nlgn2 KO mice have both greater SW amplitude and density, and that SW density is the main property contributing to the altered 24-h dynamics. We also found the absence of Nlgn2 to accelerate paradoxical sleep recovery following SD, together with profound alterations in ECoG activity across vigilance states. Sleep loss, however, did not modify the 24-h distribution of the hypersynchronized ECoG events observed in these mice. Finally, RNA sequencing confirmed an overall decrease in cortical expression of Nlgn2 and related GABAergic transcripts following SD in wild-type mice.

Conclusions: This work brings further insight into potential mechanisms of sleep duration and quality deregulation in neurodevelopmental disorders, notably involving NLGN2 and GABAergic neurotransmission.

Keywords: Cerebral cortex; GABAergic neurotransmission; Gene expression; Mice; Sleep deprivation; Sleep-wake regulation; Slow waves; Synaptic adhesion molecules.


Conflict of interest statement

The authors declare no competing interests.

Figures

Fig. 1
Fig. 1
SW density and properties during SWS under BL conditions in Nlgn2 KO mice and littermates. Twenty-four-hour dynamics of SW (A) density, (B) amplitude, (C) slope, (D) negative phase duration, (E) positive phase duration, and (F) frequency. Significant interactions between Genotype and Intervals were decomposed by planned comparisons and represented with different color datapoints. Significant main Genotype effects were decomposed by planned comparisons and illustrated with vertical lines accompanied by symbols. Nlgn2 KO mice datapoints identified in orange with a red contour, as well as stars (*), indicate significant differences in comparison to HET and WT mice (p < 0.05). Gray backgrounds represent the dark period
Fig. 2
Fig. 2
Sleep architecture of Nlgn2 KO mice and littermates during a 6-h SD and 18-h recovery. (A) Percentage of time spent in wake, SWS, and PS for the total 24 h (left), the 12-h light period (middle), and the 12-h dark period (right). (B) Twenty-four-hour distribution of time spent in wake, SWS, and PS. (C) Mean duration of individual bouts (left) and number of individual bouts (right) of wake, SWS, and PS for the light and dark periods. (D) Time spent in SWS (top) and PS (bottom) during the 6-h SD. (E) Latency to initiate SWS (top) and PS (bottom) from the end of SD. (F) Accumulated difference in SWS (left) and PS (right) during SD/recovery from BL values. (G) SWS (top) and PS (bottom) recovery slopes evaluated from the 6th to the 12th intervals of corresponding data in panel F. Significant Genotype by Interval interactions were decomposed by planned comparisons and represented with different color datapoints. Significant Genotype by Light/dark period interactions and main Genotype effects were decomposed by planned comparisons and illustrated with lines accompanied by symbols. Nlgn2 KO mice red datapoints and # symbols indicate significant differences (p < 0.05) in comparison to WT mice. Nlgn2 KO mice orange datapoints and + signs indicate significant differences (p < 0.05) in comparison to HET mice. Nlgn2 KO mice datapoints in orange with a red contour and stars (*) indicate significant differences (p < 0.05) in comparison to both HET and WT mice. Dashed backgrounds represent the 6-h SD. Gray backgrounds represent the dark period. REC: 18-h recovery after SD
Fig. 3
Fig. 3
ECoG spectral activity of Nlgn2 KO mice and littermates during SD and/or recovery. (A) Relative spectral activity between 0.5 and 50 Hz during wake (top), SWS (middle), and PS (bottom) for the total 24-h. An enlargement of the SWS activity between 0.5 and 4 Hz is presented in the inset of the middle panel. The peak frequency of PS activity is also presented in the inset of the lower panel. (B) Relative spectral activity between 0.5 and 50 Hz during wake (top), SWS (middle), and PS (bottom) for the total 24-h and expressed as percentage of BL (C) Twenty-four-hour dynamics of relative activity presented for wake theta, alpha, and gamma frequency bands, and for SWS delta frequencies. Significant Genotype by Interval interactions were decomposed by planned comparisons and represented with different color datapoints. Significant main Genotype effects were decomposed by Tuckey’s post hoc tests in panels A and B, and illustrated with lines at the top of each graphs, or decomposed by planned comparisons in panel C and illustrated with a vertical line accompanied with a star. Red lines at the top of graphs and Nlgn2 KO red datapoints indicate significant differences (p < 0.05) between KO and WT mice. Nlgn2 KO mice orange datapoints indicate significant differences (p < 0.05) in comparison to HET mice. Black lines at the top of graphs, Nlgn2 KO datapoints in orange with a red contour, and stars (*) indicate significant differences (p < 0.05) between KO mice and all littermates. Dashed backgrounds represent the 6-h SD. Gray backgrounds represent the dark period. REC: 18-h recovery after SD
Fig. 4
Fig. 4
SW density and properties during SWS under recovery conditions in Nlgn2 KO mice and littermates. Twenty-four-hour dynamics of SW (A) density, (B) amplitude, (C) slope, and (D) frequency for the 18-h recovery following a 6-h SD. Left panels show absolute data, and right panels data as a percentage of the 24-h BL mean. A discontinuous line was placed at 100% on the Y axis of right panels to help data visualization. Significant Genotype by Interval interactions were decomposed by planned comparisons and represented with different color datapoints. Significant main Genotype effects were decomposed by planned comparisons and illustrated with vertical lines accompanied by symbols. Nlgn2 KO red datapoints indicate significant differences (p < 0.05) in comparison to WT mice. Nlgn2 KO orange datapoints indicate significant differences (p < 0.05) in comparison to HET mice. Nlgn2 KO mice datapoints identified in orange with a red contour, as well as stars (*), indicate significant differences in comparison to HET and WT mice (p < 0.05). Dashed backgrounds represent the 6-h SD. Gray backgrounds represent the dark period
Fig. 5
Fig. 5
Hypersynchronized ECoG events in Nlgn2 KO mice and littermates for BL and SD/recovery recordings. (A) Examples of wake and PS hypersynchronized events with identification criteria. (B) Number of wake (top) and PS (bottom) hypersynchronized events in all genotypes for the light and dark periods (left) of the SD/recovery 24-h recordings. The time courses of event numbers are also shown (right) for KO mice, with time spent in each vigilance state plotted on the right y axes. (C) Density of wake (top) and PS (bottom) hypersynchronized events in all genotypes for the light and dark periods (left) of the SD/recovery 24-h recordings. The time courses of event densities are also shown (right) for KO mice, with time spent in each vigilance state plotted on the right y axes. (D) Time course of wake (top) and PS (bottom) hypersynchronized events in KO mice for the 24 h of BL with time spent in each state plotted on the right y axes. Significant Genotype by Light/dark period interactions were decomposed by planned comparisons and illustrated with lines accompanied by symbols. Significant Genotype effects are represented by symbols alone. Stars (*) indicate significant differences in comparison to HET and WT mice (p < 0.05), and triangles of dots indicate significant light-dark differences (p < 0.05). Dashed backgrounds represent the 6-h SD. Gray backgrounds represent the dark period
Fig. 6
Fig. 6
Genome-wide gene expression response to SD quantified for the cerebral cortex of WT mice. (A) Hierarchical cluster analysis of DEGs between control and sleep deprived WT mice using Ward’s method. (B) Summary of gene expression outputs, number of DEGs, as well as associated GO enrichment. GO term fold enrichment, percentage of genes from the analyzed cluster related to the specific GO terms, and selected GO term FDR for (C) decreased and (D) increased DEGs. Normalized read counts of DEGs targeted for their association to (E) GABAergic and (F) cholinergic synapses. DEGs include genes with FDR < 0.05

Similar articles

Cited by

References

    1. Chouinard S, Poulin J, Stip E, Godbout R. Sleep in untreated patients with schizophrenia: a meta-analysis. Schizophr Bull. 2004;30(4):957–67. doi: 10.1093/oxfordjournals.schbul.a007145. - DOI - PubMed
    1. Limoges E, Mottron L, Bolduc C, Berthiaume C, Godbout R. Atypical sleep architecture and the autism phenotype. Brain. 2005;128(Pt 5):1049–61. doi: 10.1093/brain/awh425. - DOI - PubMed
    1. Ferrarelli F, Peterson MJ, Sarasso S, Riedner BA, Murphy MJ, Benca RM, et al. Thalamic dysfunction in schizophrenia suggested by whole-night deficits in slow and fast spindles. Am J Psychiatry. 2010;167(11):1339–48. doi: 10.1176/appi.ajp.2010.09121731. - DOI - PMC - PubMed
    1. Rochette AC, Soulières I, Berthiaume C, Godbout R. NREM sleep EEG activity and procedural memory: a comparison between young neurotypical and autistic adults without sleep complaints. Autism Res. 2018;11(4):613–23. doi: 10.1002/aur.1933. - DOI - PubMed
    1. Markovic A, Buckley A, Driver DI, Dillard-Broadnax D, Gochman PA, Hoedlmoser K, et al. Sleep spindle activity in childhood onset schizophrenia: diminished and associated with clinical symptoms. Schizophr Res. 2020;223:327–36. doi: 10.1016/j.schres.2020.08.022. - DOI - PMC - PubMed

Publication types

Grants and funding