. 2024 Jul 18;5(3):100289.
doi: 10.1016/j.xhgg.2024.100289. Epub 2024 Apr 2.

DNA methylation episignature and comparative epigenomic profiling for Pitt-Hopkins syndrome caused by TCF4 variants

Affiliations

DNA methylation episignature and comparative epigenomic profiling for Pitt-Hopkins syndrome caused by TCF4 variants

Liselot van der Laan et al. HGG Adv. .

Abstract

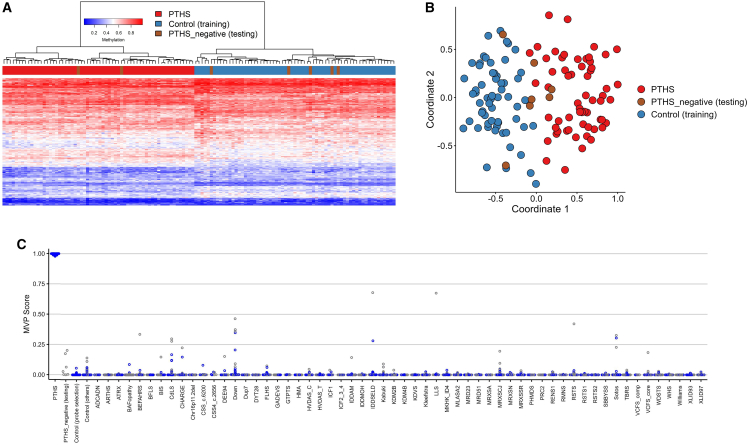
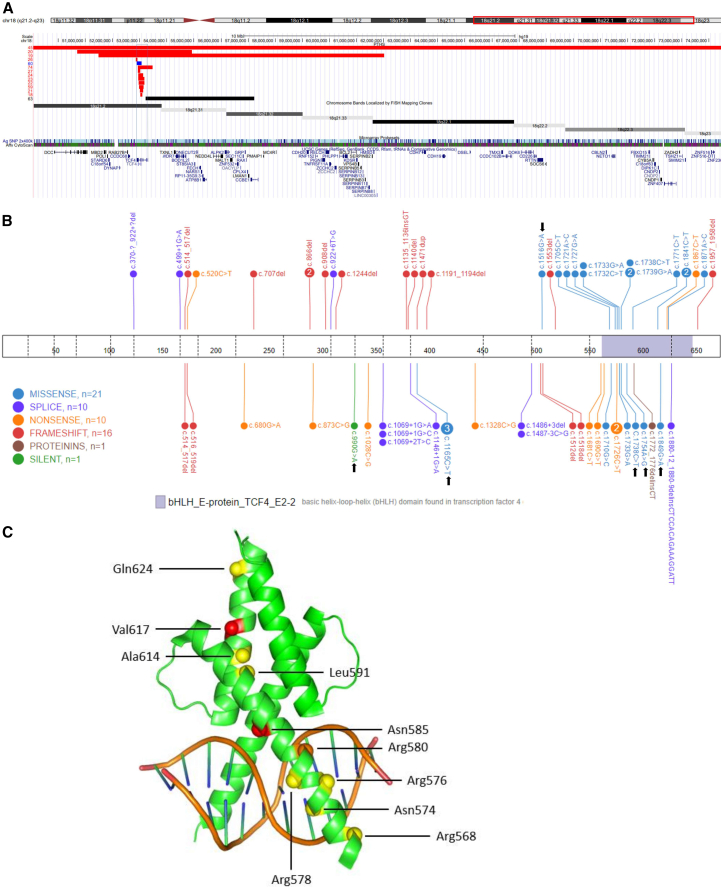
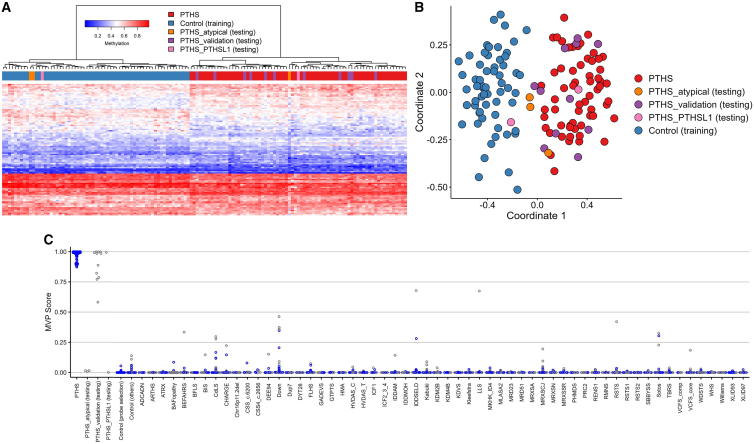
Pitt-Hopkins syndrome (PTHS) is a neurodevelopmental disorder caused by pathogenic variants in TCF4, leading to intellectual disability, specific morphological features, and autonomic nervous system dysfunction. Epigenetic dysregulation has been implicated in PTHS, prompting the investigation of a DNA methylation (DNAm) "episignature" specific to PTHS for diagnostic purposes and variant reclassification and functional insights into the molecular pathophysiology of this disorder. A cohort of 67 individuals with genetically confirmed PTHS and three individuals with intellectual disability and a variant of uncertain significance (VUS) in TCF4 were studied. The DNAm episignature was developed with an Infinium Methylation EPIC BeadChip array analysis using peripheral blood cells. Support vector machine (SVM) modeling and clustering methods were employed to generate a DNAm classifier for PTHS. Validation was extended to an additional cohort of 11 individuals with PTHS. The episignature was assessed in relation to other neurodevelopmental disorders and its specificity was examined. A specific DNAm episignature for PTHS was established. The classifier exhibited high sensitivity for TCF4 haploinsufficiency and missense variants in the basic-helix-loop-helix domain. Notably, seven individuals with TCF4 variants exhibited negative episignatures, suggesting complexities related to mosaicism, genetic factors, and environmental influences. The episignature displayed degrees of overlap with other related disorders and biological pathways. This study defines a DNAm episignature for TCF4-related PTHS, enabling improved diagnostic accuracy and VUS reclassification. The finding that some cases scored negatively underscores the potential for multiple or nested episignatures and emphasizes the need for continued investigation to enhance specificity and coverage across PTHS-related variants.

Keywords: CNV; DNA methylation; PTHS; Pitt-Hopkins syndrome; TCF4; VUS; episignature; neurodevelopmental disorder.


Conflict of interest statement

Declaration of interests B.S. is an employee and shareholder of EpiSign, Inc., a biotech firm involved in commercial application of EpiSign technology.

Figures

Figure 1
Figure 1
PTHS episignature discovery cohort and negative cases (A) Hierarchical clustering heatmap. Each column in the heatmap represents an individual from the TCF4 discovery case group (n = 60), the negative case group (n = 7), or the discovery control group. Meanwhile, each row corresponds to a probe that has been specifically selected for the PTHS episignature. The heatmap depicts Euclidean clustering, revealing a distinct separation between the TCF4 discovery cases in red and the control cases in blue. Negative cases, shown in brown, cluster with controls, with two exceptions. (B) Multidimensional scaling (MDS) plot. This plot visually presents the segregation of individuals with TCF4 and controls through MDS analysis. (C) Support vector machine (SVM) classifier model scores. The SVM classifier model scores are depicted. The model was trained using the selected PTHS episignature probes, with 75% of controls and 75% of individuals with other neurodevelopmental disorders (depicted in blue). The remaining 25% of controls and 25% of samples from other disorders were used for testing and are displayed in gray. The plot demonstrates that all individuals with PTHS exhibited MVP scores >0.75. Conversely, all negative individuals displayed an MVP score <0.25, indicative of the absence of the PTHS episignature.
Figure 2
Figure 2
Overview of CNVs and TCF4 variants in the study cohort (A) Chromosomal structural variations. Chromosome 18q alterations are visualized through horizontal bars: red bars depict large deletions, blue bars indicate duplications, and the black bar signifies the CNV linked to an absent PTHS episignature. Genes encompassed within this region are listed below. Cytogenetics banding and recognized genes were sourced from the UCSC Genome Browser 2009 (GRCh37/hg19) genome build. (B) TCF4 variants. A comprehensive summary of TCF4 variants within the cohort is presented. Variants identified by black arrows demonstrated negative PTHS episignature outcomes. Notably, for the recurrent c.1738C>T (p.Arg580Trp) variant, one participant displayed an absent PTHS episignature, while two individuals exhibited a positive PTHS episignature. The visualization was created using the St. Jude Cloud Protein Paint Image tool at https://pecan.stjude.cloud/proteinpaint. (C) TCF4 basic-helix-loop-helix (bHLH) domain. The (homodimerized) TCF4 bHLH domain, in complex with the Ephrussi box (E-box) DNA element, is depicted through PyMOL visualization (PDB: 6OD5, https://doi.org/10.2210/pdb6OD5/pdb). Amino acid residues impacted by missense variants within this domain are denoted with spheres. A color code is used: yellow signifies residues associated with a positive PTHS episignature, red indicates a negative PTHS episignature, and orange indicates equivocal results (variant c.1738C>T [p.Arg580Trp]).
Figure 3
Figure 3
dAssessment of the PTHS episignature (A) Hierarchical clustering heatmap. Each column represents an individual with PTHS or control, while each row corresponds to a probe selected for the episignature. The heatmap visually depicts a distinct separation between individuals with PTHS (highlighted in red and pink) used for training and validation and controls (depicted in blue). Notably, all but one PTHS_atypical individual (in orange) are closely aligned with control cases. Similarly, one of the PTHS_PTHSL1 individuals (in purple) maps with the patient cluster, while the other aligns with controls. (B) MDS plot. The plot demonstrates the pronounced distinction between PTHS discovery and validation individuals (in red and pink, respectively), which were utilized for training, and the control group (in blue). This separation confirms the efficacy of the episignature in distinguishing individuals with PTHS from controls. Similar to the hierarchical clustering, all PTHS_atypical cases but one (in orange) share proximity with control cases. Furthermore, one of the PTHS_PTHSL1 individuals (in purple) displays an association with the patient cluster, while the other corresponds to controls. (C) SVM classifier model. The SVM model was trained employing the selected PTHS episignature probes and a cohort comprising 75% of controls and 75% of other neurodevelopmental disorder samples (in blue). The remaining 25% of controls and neurodevelopmental disorder samples were reserved for testing (in gray). All validation samples clustered with PTHS and had high MVP scores. One PTHS_atypical individual and one PTHS_PTHSL1 individual clustered with training and validation individuals. Conversely, the remaining two PTHS_atypical individuals and one PTHS_PTHSL1 individual displayed an MVP score <0.25 and clustered with controls.
Figure 4
Figure 4
Relationships between the PTHS cohort and 56 other EpiSign disorders (A) Methylation Profiles - Methylation profiles of all differentially methylated positions (DMPs) with a false discovery rate (FDR) <0.05 are presented for each cohort. The probes are sorted by their mean methylation values, with each circle representing an individual probe and red lines indicating the mean methylation levels. (B) Shared probes heatmap. A heatmap displays the percentage of probes shared between each paired cohort. The colors within the heatmap indicate the proportion of probes from the y axis cohort also present in the x axis cohort’s probes, offering insights into the overlap of methylation patterns between different cohorts.
Figure 5
Figure 5
Tree and leaf visualization of episignatures by mean methylation status of each DMP per syndrome This figure illustrates a tree and leaf visualization of episignatures, portraying the interrelationships among all 57 cohorts. To generate this visualization, Euclidean clustering was employed using the top 500 DMPs for each cohort. Cohort samples were aggregated based on the median methylation values of each DMP within the group. In this representation, each leaf node represents to a specific cohort, with node sizes indicating the relative number of selected DMPs for that cohort. The colors of the nodes reflect the mean methylation difference. This visualization offers valuable insights into the clustering and similarities of methylation patterns across different cohorts, providing valuable information about the epigenetic profiles and their relationships.

References

    1. Zollino M., Zweier C., Van Balkom I.D., Sweetser D.A., Alaimo J., Bijlsma E.K., Cody J., Elsea S.H., Giurgea I., Macchiaiolo M., et al. Diagnosis and management in Pitt-Hopkins syndrome: First international consensus statement. Clin. Genet. 2019;95:462–478. - PubMed
    1. Koppen I.J.N., Menke L.A., Westra W.M., Struik F., Mesman S., van Wijk M.P., Huisman S.A. Fatal gastrointestinal complications in Pitt-Hopkins syndrome. Am. J. Med. Genet. 2023;191:855–858. - PubMed
    1. Amiel J., Rio M., de Pontual L., Redon R., Malan V., Boddaert N., Plouin P., Carter N.P., Lyonnet S., Munnich A., Colleaux L. Mutations in TCF4, encoding a class I basic helix-loop-helix transcription factor, are responsible for Pitt-Hopkins syndrome, a severe epileptic encephalopathy associated with autonomic dysfunction. Am. J. Hum. Genet. 2007;80:988–993. - PMC - PubMed
    1. Sepp M., Pruunsild P., Timmusk T. Pitt-Hopkins syndrome-associated mutations in TCF4 lead to variable impairment of the transcription factor function ranging from hypomorphic to dominant-negative effects. Hum. Mol. Genet. 2012;21:2873–2888. - PubMed
    1. Yang J., Horton J.R., Li J., Huang Y., Zhang X., Blumenthal R.M., Cheng X. Structural basis for preferential binding of human TCF4 to DNA containing 5-carboxylcytosine. Nucleic Acids Res. 2019;47:8375–8387. - PMC - PubMed

Supplementary concepts