

The reduced growth due to elevated CO2 concentration hinders the sexual reproduction of mature Northern pipevine (Aristolochia contorta Bunge )
- PMID: 38571710
- PMCID: PMC10987783
- DOI: 10.3389/fpls.2024.1359783
The reduced growth due to elevated CO2 concentration hinders the sexual reproduction of mature Northern pipevine (Aristolochia contorta Bunge )
Abstract
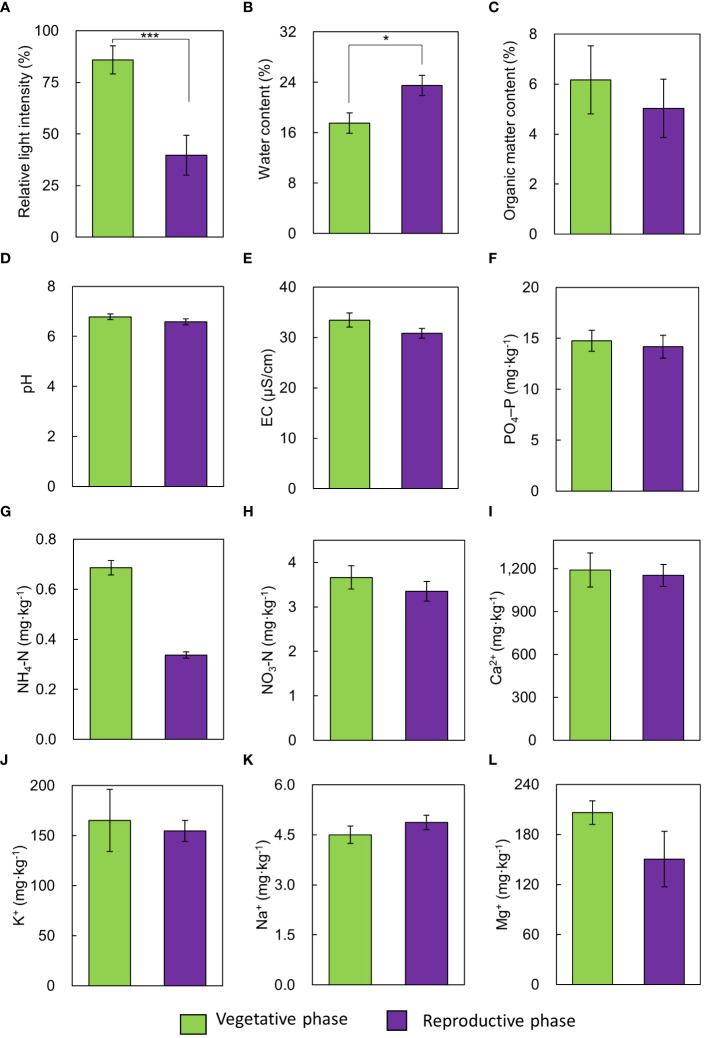
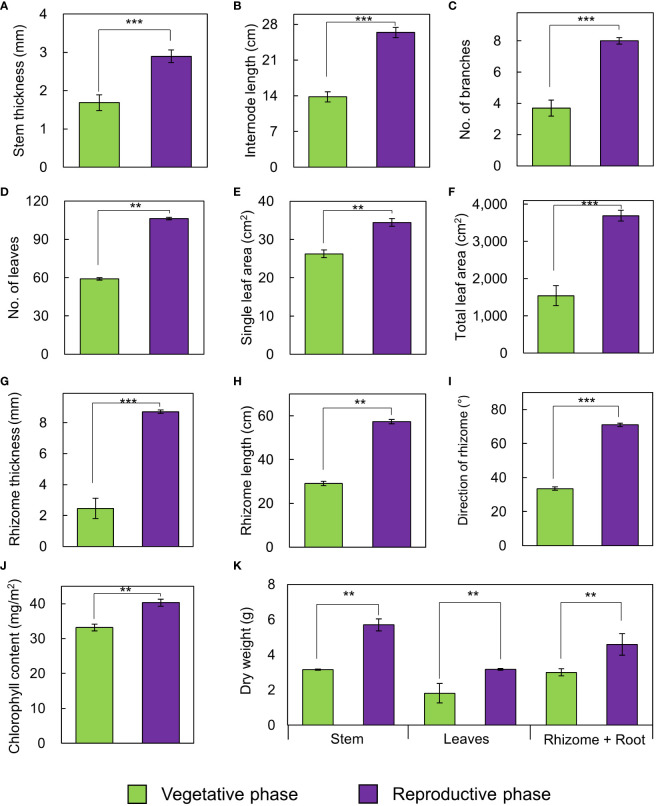
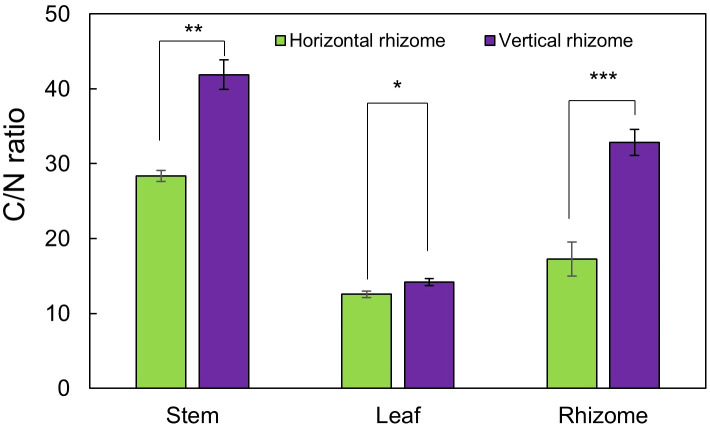
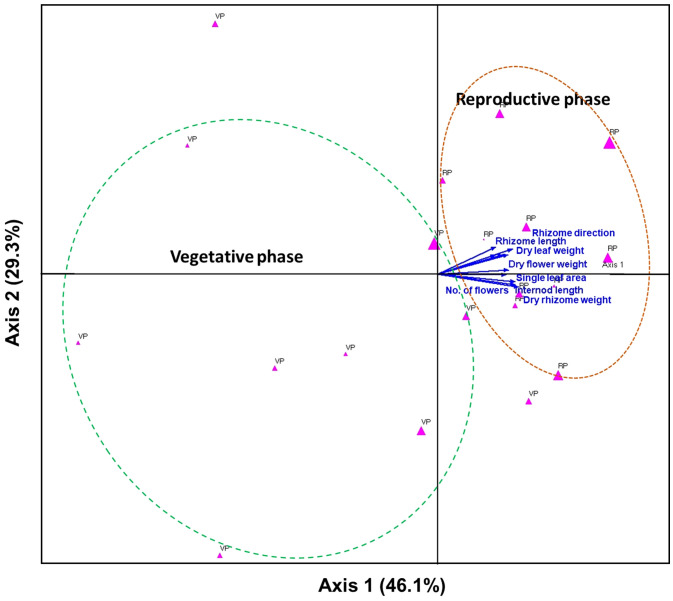
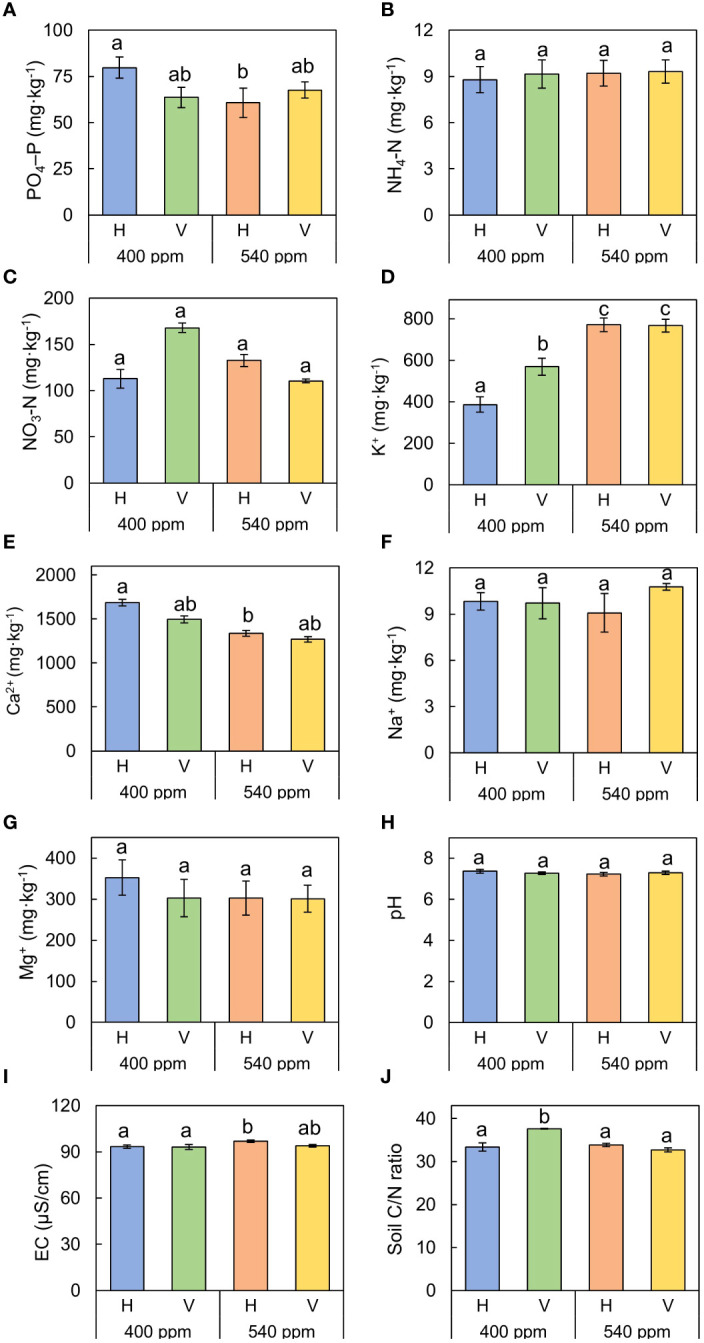
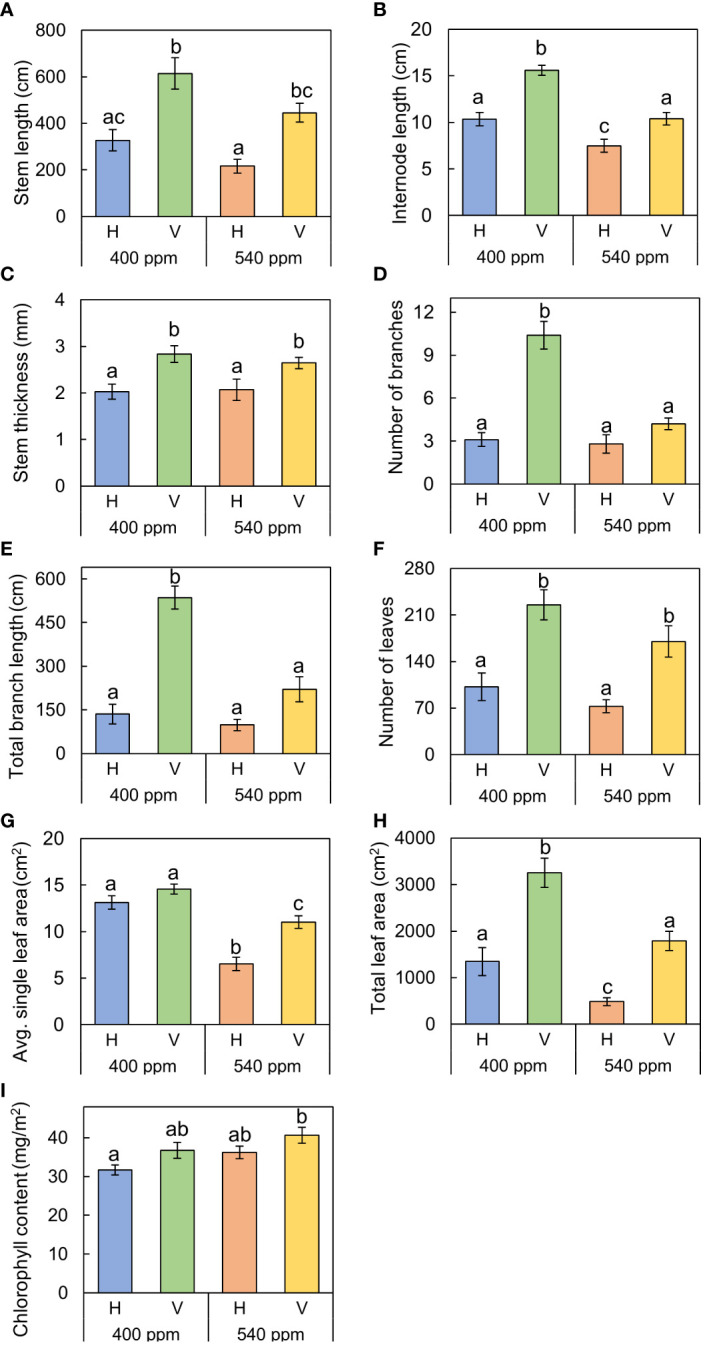
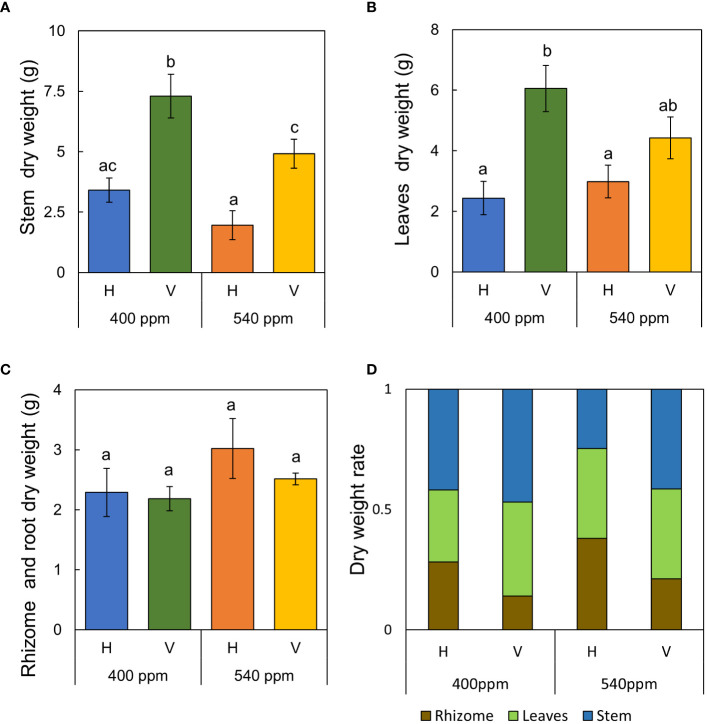
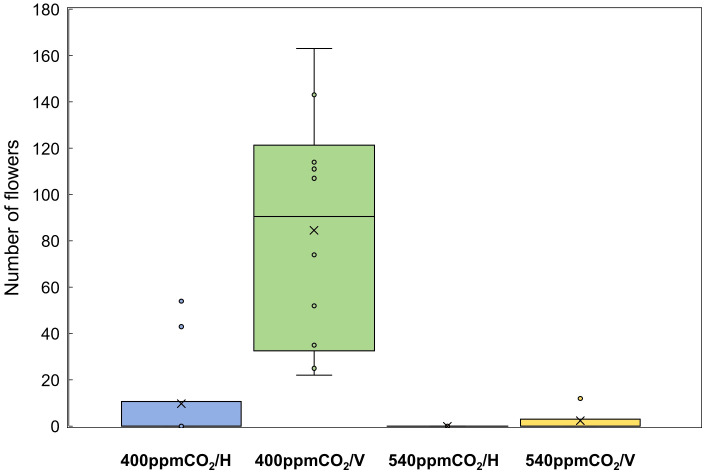
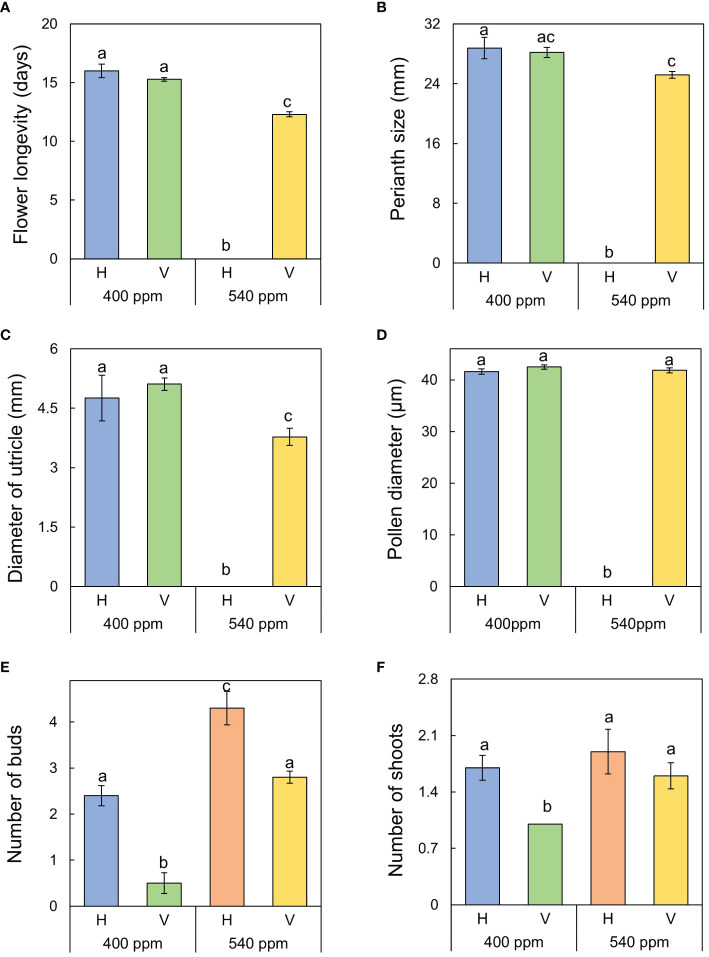
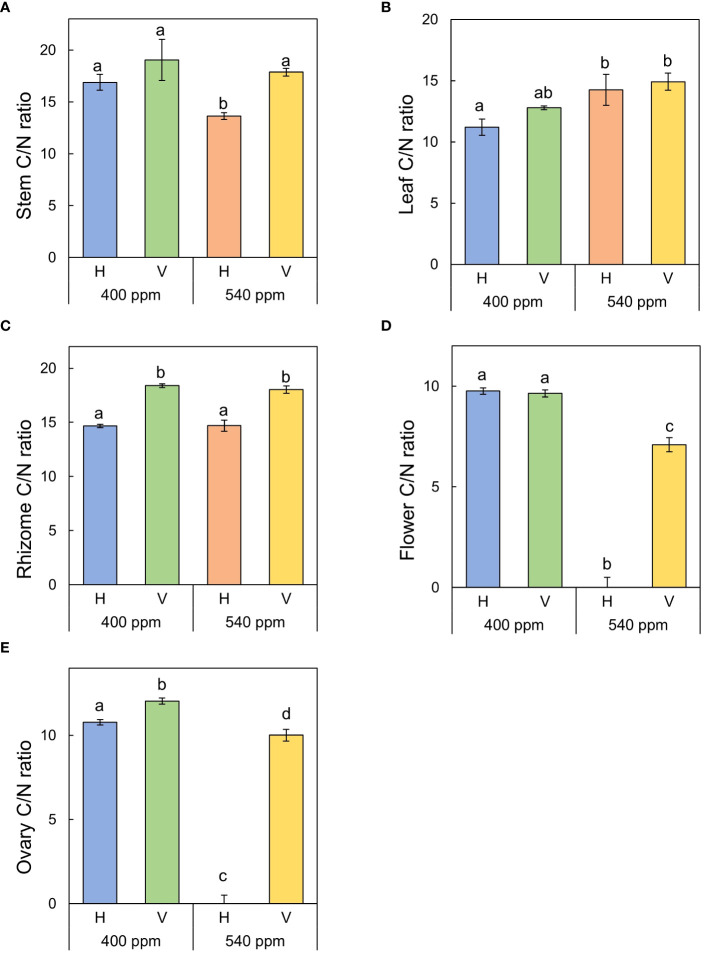
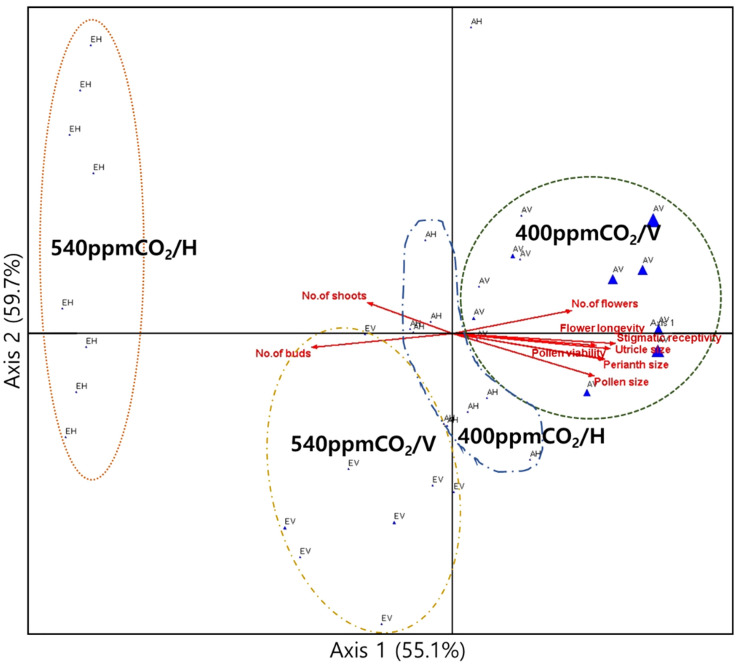
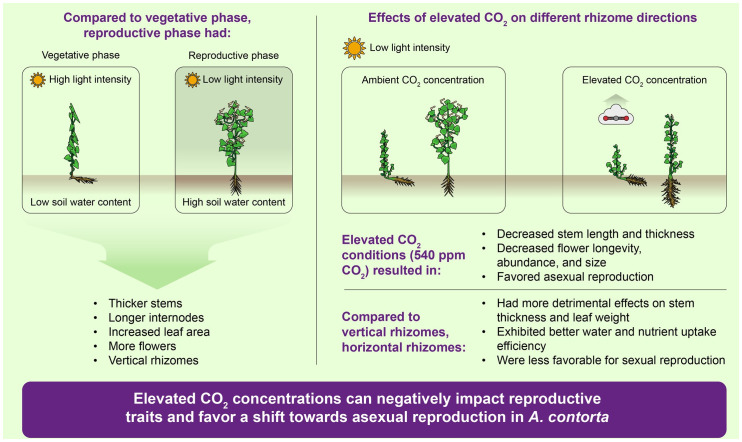
The phenology has gained considerably more attention in recent times of climate change. The transition from vegetative to reproductive phases is a critical process in the life history of plants, closely tied to phenology. In an era of climate change, understanding how environmental factors affect this transition is of paramount importance. This study consisted of field surveys and a greenhouse experiment on the reproductive biology of Northern pipevine (Aristolochia contorta Bunge). During field surveys, we investigated the environmental factors and growth characteristics of mature A. contorta, with a focus on both its vegetative and reproductive phases. In its successful flowering during the reproductive phase, A. contorta grew under the conditions of 40% relative light intensity and 24% soil moisture content, and had a vertical rhizome. In the greenhouse experiments, we examined the impact of increased CO2 concentration on the growth and development of 10-year-old A. contorta, considering the effect of rhizome direction. Planted with a vertical rhizome direction, A. contorta exhibited sufficient growth for flowering under ambient CO2 concentrations. In contrast, when planted with a horizontal rhizome direction, it was noted to significantly impede successful growth and flowering under elevated CO2 concentrations. This hindered the process of flowering, highlighting the pivotal role of substantial vegetative growth in achieving successful flowering. Furthermore, we observed a higher number of underground buds and shoots under the conditions of elevated CO2 concentration and a horizontal rhizome direction instead of flowering. Elevated CO2 concentrations also exhibited diverse effects on mature A. contorta's flower traits, resulting in smaller flower size, shorter longevity, and reduced stigma receptivity, and pollen viability. The study shed light on elevated CO2 concentrations can hinder growth, potentially obstructing sexual reproduction and diminishing genetic diversity.
Keywords: CO2 concentration; climate change; growth inhibition; phenology; reproduction; rhizome direction.
Copyright © 2024 Park and Kim.
Conflict of interest statement
The authors declare that the research was conducted in the absence of any commercial or financial relationships that could be construed as a potential conflict of interest. The author(s) declared that they were an editorial board member of Frontiers, at the time of submission. This had no impact on the peer review process and the final decision.
Figures
Similar articles
-
Primary Metabolic Response of Aristolochia contorta to Simulated Specialist Herbivory under Elevated CO2 Conditions.Plants (Basel). 2024 May 24;13(11):1456. doi: 10.3390/plants13111456. Plants (Basel). 2024. PMID: 38891265 Free PMC article.
-
Mechanistic understanding of perianth traits hindering pollination in Aristolochia contorta Bunge.Front Plant Sci. 2023 Sep 21;14:1226331. doi: 10.3389/fpls.2023.1226331. eCollection 2023. Front Plant Sci. 2023. PMID: 37810400 Free PMC article.
-
Ontogeny-dependent effects of elevated CO2 and watering frequency on interaction between Aristolochia contorta and its herbivores.Sci Total Environ. 2022 Sep 10;838(Pt 2):156065. doi: 10.1016/j.scitotenv.2022.156065. Epub 2022 May 19. Sci Total Environ. 2022. PMID: 35597357
-
Implications of High Temperature and Elevated CO2 on Flowering Time in Plants.Front Plant Sci. 2016 Jun 27;7:913. doi: 10.3389/fpls.2016.00913. eCollection 2016. Front Plant Sci. 2016. PMID: 27446143 Free PMC article. Review.
-
Plant developmental responses to climate change.Dev Biol. 2016 Nov 1;419(1):64-77. doi: 10.1016/j.ydbio.2016.07.023. Epub 2016 Aug 9. Dev Biol. 2016. PMID: 27521050 Review.
Cited by
-
Ecological Dynamics of Volatile Organic Compound-Mediated Interactions in Aristolochia Contorta With Parasitoids and Herbivores.Ecol Evol. 2025 Apr 2;15(4):e71175. doi: 10.1002/ece3.71175. eCollection 2025 Apr. Ecol Evol. 2025. PMID: 40177685 Free PMC article.
References
-
- Arrizabalaga-Arriazu M., Gomès E., Morales F., Irigoyen J. J., Pascual I., Hilbert G. (2020). High temperature and elevated carbon dioxide modify berry composition of different clones of grapevine (Vitis vinifera L.) cv. Tempranillo. Front. Plant Sci. 11, 603687. doi: 10.3389/fpls.2020.603687 - DOI - PMC - PubMed
-
- Berntson G. M., Woodward F. I. (1992). The root system architecture and development of Senecio vulgaris in elevated CO2 and drought. Funct. Ecol. 6, 324–333. doi: 10.2307/2389524 - DOI
LinkOut - more resources
Full Text Sources