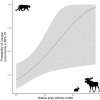
Native prey, not landscape change or novel prey, drive cougar (Puma concolor) distribution at a boreal forest range edge
- PMID: 38571804
- PMCID: PMC10985369
- DOI: 10.1002/ece3.11146
Native prey, not landscape change or novel prey, drive cougar (Puma concolor) distribution at a boreal forest range edge
Abstract
Many large carnivores, despite widespread habitat alteration, are rebounding in parts of their former ranges after decades of persecution and exploitation. Cougars (Puma concolor) are apex predator with their remaining northern core range constricted to mountain landscapes and areas of western North America; however, cougar populations have recently started rebounding in several locations across North America, including northward in boreal forest landscapes. A camera-trap survey of multiple landscapes across Alberta, Canada, delineated a range edge; within this region, we deployed an array of 47 camera traps in a random stratified design across a landscape spanning a gradient of anthropogenic development relative to the predicted expansion front. We completed multiple hypotheses in an information-theoretic framework to determine if cougar occurrence is best explained by natural land cover features, anthropogenic development features, or competitor and prey activity. We predicted that anthropogenic development features from resource extraction and invading white-tailed deer (Odocoileus virgianius) explain cougar distribution at this boreal range edge. Counter to our predictions, the relative activity of native prey, predominantly snowshoe hare (Lepus americanus), was the best predictor of cougar occurrence at this range edge. Small-bodied prey items are particularly important for female and sub-adult cougars and may support breeding individuals in the northeast boreal forest. Also, counter to our predictions, there was not a strong relationship detected between cougar occurrence and gray wolf (Canis lupus) activity at this range edge. However, further investigation is recommended as the possibility of cougar expansion into areas of the multi-prey boreal system, where wolves have recently been controlled, could have negative consequences for conservation goals in this region (e.g. the recovery of woodland caribou [Rangifer tarandus caribou]). Our study highlights the need to monitor contemporary distributions to inform conservation management objectives as large carnivores recover across North America.
Keywords: anthropogenic development; boreal; camera traps; carnivore recovery; predator–prey interactions; range expansion.
© 2024 The Authors. Ecology and Evolution published by John Wiley & Sons Ltd.
Conflict of interest statement
The authors have no competing statement of interest to declare.
Figures


Similar articles
-
Community-level modelling of boreal forest mammal distribution in an oil sands landscape.Sci Total Environ. 2021 Feb 10;755(Pt 2):142500. doi: 10.1016/j.scitotenv.2020.142500. Epub 2020 Sep 26. Sci Total Environ. 2021. PMID: 33049527
-
Logging, linear features, and human infrastructure shape the spatial dynamics of wolf predation on an ungulate neonate.Ecol Appl. 2023 Oct;33(7):e2911. doi: 10.1002/eap.2911. Epub 2023 Sep 13. Ecol Appl. 2023. PMID: 37602927
-
Behavioral "bycatch" from camera trap surveys yields insights on prey responses to human-mediated predation risk.Ecol Evol. 2022 Jul 17;12(7):e9108. doi: 10.1002/ece3.9108. eCollection 2022 Jul. Ecol Evol. 2022. PMID: 35866017 Free PMC article.
-
Cougars, wolves, and humans drive a dynamic landscape of fear for elk.Ecology. 2024 Apr;105(4):e4255. doi: 10.1002/ecy.4255. Epub 2024 Feb 15. Ecology. 2024. PMID: 38361248
-
Recolonizing carnivores: Is cougar predation behaviorally mediated by bears?Ecol Evol. 2021 Mar 21;11(10):5331-5343. doi: 10.1002/ece3.7424. eCollection 2021 May. Ecol Evol. 2021. PMID: 34026010 Free PMC article.
Cited by
-
A global assessment of large terrestrial carnivore kill rates.Biol Rev Camb Philos Soc. 2025 Feb;100(1):327-350. doi: 10.1111/brv.13143. Epub 2024 Sep 11. Biol Rev Camb Philos Soc. 2025. PMID: 39262094 Free PMC article.
-
Ecological Insights From Camera Trapping Span Biological Taxa, and the Globe.Ecol Evol. 2025 Feb 2;15(2):e70947. doi: 10.1002/ece3.70947. eCollection 2025 Feb. Ecol Evol. 2025. PMID: 39901889 Free PMC article.
References
-
- Alberta Biodiversity Monitoring Institute . (2010a). ABMI wall‐to‐wall land cover inventory. https://abmi.ca/home/data‐analytics/da‐top/da‐product‐overview/Data‐Arch.... Accessed 15 Jan 2023
-
- Alberta Biodiversity Monitoring Institute . (2010b). ABMI wall‐to‐wall human footprint inventory. https://abmi.ca/home/data‐analytics/da‐top/da‐product‐overview/Human‐Foo.... Accessed 15 Jan 2023
-
- Alberta Environment and Parks . (2017). Draft provincial woodland Caribou range plan. Alberta Environment and Parks. Retrieved from https://open.alberta.ca/dataset/932d6c22‐a32a‐4b4e‐a3f5‐cb2703c53280/res.... Accessed 15 Jan 2023.
-
- Alexander, P. D. , & Gese, E. M. (2018). Identifying individual cougars (Puma concolor) in remote camera images ‐ implications for population estimates. Wildlife Research, 45, 274–281.
-
- Anderson, C. R., Jr. , Lindzey, F. , Knopff, K. H. , Jalkotzy, M. G. , & Boyce, M. G. (2009). Cougar management in north American. In Hornocker M. & Negri S. (Eds.), Cougar: Ecology and conservation (pp. 41–54). University of Chicago Press.
LinkOut - more resources
Full Text Sources
Miscellaneous

