. 2024 Mar 20:15:1343425.
doi: 10.3389/fimmu.2024.1343425. eCollection 2024.

Predicting immunotherapy response in melanoma using a novel tumor immunological phenotype-related gene index

Affiliations

Predicting immunotherapy response in melanoma using a novel tumor immunological phenotype-related gene index

Shaoluan Zheng et al. Front Immunol. .

Abstract

Introduction: Melanoma is a highly aggressive and recurrent form of skin cancer, posing challenges in prognosis and therapy prediction.

Methods: In this study, we developed a novel TIPRGPI consisting of 20 genes using Univariate Cox regression and the LASSO algorithm. The high and low-risk groups based on TIPRGPI exhibited distinct mutation profiles, hallmark pathways, and immune cell infiltration in the tumor microenvironment.

Results: Notably, significant differences in tumor immunogenicity and TIDE were observed between the risk groups, suggesting a better response to immune checkpoint blockade therapy in the low-TIPRGPI group. Additionally, molecular docking predicted 10 potential drugs that bind to the core target, PTPRC, of the TIPRGPI signature.

Discussion: Our findings highlight the reliability of TIPRGPI as a prognostic signature and its potential application in risk classification, immunotherapy response prediction, and drug candidate identification for melanoma treatment. The "TIP genes" guided strategy presented in this study may have implications beyond melanoma and could be applied to other cancer types.

Keywords: bioinformatics; immunotherapy response; melanoma; molecular docking; prognosis; tumor microenvironment.


Conflict of interest statement

The authors declare that the research was conducted in the absence of any commercial or financial relationships that could be construed as a potential conflict of interest.

Figures

Figure 1
Figure 1
The workflow for this study.
Figure 2
Figure 2
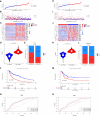
TIP score correlates with the prognosis and the immune state of melanoma. Kaplan–Meier survival plots of TIP score for OS.
Figure 3
Figure 3
WGCNA analysis. (A) Cluster dendrogram of MAD top 5000 genes. (B) Table cells show Pearson correlation coefficients and corresponding P-values between module eigengenes (ME) and the variables in 13 modules. (C) Scatter plot depicting the correlation between gene significance (GS) for TIP score and module membership (MM) in the blue module. (D) Scatter plot depicting the correlation between GS for TIP score and MM in the pink module. (E) Scatter plot depicting the correlation between GS for TIP score and MM in the brown module.
Figure 4
Figure 4
The construction of TIPRGPI for melanoma. (A) The penalty function for the LASSO algorithm was chosen as lambda.min = 0.04591217. (B) LASSO regression using the 128 genes. (C) Twenty robust genes were and their coefficients in the model. (D) ADORA2A positively correlated with OS. (E) CCL8 positively correlated with OS. (F) CFB positively correlated with OS.
Figure 5
Figure 5
Validation of the TIPRGPI predicting model in melanoma. (A–F) Risk score distribution, survival status, the expression of 20 TIPRGPI genes, mortality rate Kaplan-Meier survival curves for patients in low- and high-TIPRGPI groups from training dataset TCGA-SKCM. (G) Time-dependent receiver operating characteristic (ROC) curves of training dataset. (H–M) Risk score distribution, survival status, the expression of 20 TIPRGPI genes, mortality rate Kaplan-Meier survival curves for patients in low- and high-TIPRGPI groups from validation dataset GSE65904. (N) Time-dependent receiver operating characteristic (ROC) curves of validation dataset.
Figure 6
Figure 6
Differences in the distribution of various clinical factors in high- and low-TIPRGPI groups. There were significant differences in stage, T-stage, primary/metastasis, and Breslow depth.
Figure 7
Figure 7
Univariate and multivariate analyses of the clinical traits and TIPRGPI for the OS in melanoma.
Figure 8
Figure 8
Evaluation of the TIPRGPI-integrated nomogram in melanoma. (A) Nomogram for predicting the probability of 1-, 2-, and 3-year OS. (B) The calibration plots of the nomogram predicting the probability of 1-, 2-, and 3-year OS. (C) Kaplan-Meier survival analysis of the age-TIPRGPI integrated nomogram for OS. (D) Decision curves showing the comparison of net benefits of the age, TIPRGPI, and age-TIPRGPI integrated for 2-year OS.
Figure 9
Figure 9
Genetic variations of the high- and low-TIPRGPI groups. (A, B) Waterfall plots showing the mutation landscapes of the high- (A) and low-TIPRGPI (B) groups, TTN and MUC16 mutations were obtained; (C) Forest plot showing significantly different mutated genes between high- and low-TIPRGPI groups; (D) The coincident and exclusive associations across the top mutated genes in high- and low-TIPRGPI groups; (E) Lollipop plot indicating the distribution of mutation spots in the high- and low-TIPRGPI groups.
Figure 10
Figure 10
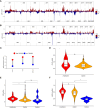
The distribution of CNV features across all chromosomes for the high- (A) and low- (B) TIPRGPI groups; (C) CLIC2, CFB and UBE2L6 showed significant differences at the CNV level; (D) Violin plots indicating the positive correlation of gene expression and copy number of CLIC2 in the high-TIPRGPI group; (E) Violin plots indicating the positive correlation of gene expression and copy number of CFB in the high- TIPRGPI group; (F) Violin plots indicating the positive correlation of gene expression and copy number of UBE2L6 in the high-TIPRGPI group.
Figure 11
Figure 11
Determination of the distinct hallmark pathways of the high- and low TIPRGPI groups. (A) Differences in cancer hallmark pathway activities between the between the high- and low-TIPRGPI groups as assessed by GSVA; (B) The GSEA results for the 2 overlapping upregulated hallmark pathways in terms of the TIPRGPI groups; (C) Kaplan-Meier survival plots showing the significant correlations between the OS and GSVA scores of HALLMARK_ALLOGRAFT_REJECTION; (D) Kaplan-Meier survival plots showing the significant correlations between the OS and GSVA scores of HALLMARK_IL6_JAK_STAT3_SIGNALING.
Figure 12
Figure 12
The differences of 23 TME cells infiltration between high- and low- TIPRGPI groups.
Figure 13
Figure 13
Application of the TIPRGPI model for immunotherapy prediction in melanoma. (A) The high- and low-TIPRGPI groups were significantly different in 58 out of 61 immune checkpoints; (B) The high- and low-TIPRGPI groups were significantly different in 11 of the 12 interferon-γ pathway marker genes; (C) The high- and low-TIPRGPI groups were significantly different in 8 of the 20 m6A regulators; (D–G) The relationship between TIPRGPI and IPS, significant difference in all 4 subgroups; (H) TIDE correlated with TIPRGPI, which showed a significant negative correlation.
Figure 14
Figure 14
Applying TIPRGPI to assess immunotherapy prognosis in the GSE91061 melanoma immunotherapy dataset. (A) Significant difference in survival between high- and low-TIPRGPI groups in the GSE91061 dataset; (B) Significant difference in TIPRGPI scores between immunotherapy CR, PR, SD and PD groups; (C) ROC curve.
Figure 15
Figure 15
Docking conformation and interaction force analysis. (A) Pymol 3D structures and binding modes showing the formed hydrogen bonds between the predicted pocket of PTPRC and DB08676 (A), DB05608 (B) and DB12369 (C); Ligplus interaction force analysis showing hydrogen bonds formed by DB08676 (D), DB05608 (E) and DB12369 (F) with amino acid residues of proteins.

Similar articles

Cited by

References

    1. Shain AH, Bastian BC. From melanocytes to melanomas. Nat Rev Cancer. (2016) 16:345–58. doi: 10.1038/nrc.2016.37 - DOI - PubMed
    1. Mathur P, Sathishkumar K, Chaturvedi M, Das P, Sudarshan KL, Santhappan S, et al. . Cancer statistics, 2020: report from national cancer registry programme, India. JCO Glob Oncol. (2020) 6:1063–75. doi: 10.1200/GO.20.00122 - DOI - PMC - PubMed
    1. Siegel RL, Miller KD, Jemal A. Cancer statistics, 2020. CA Cancer J Clin. (2020) 70:7–30. doi: 10.3322/caac.21590 - DOI - PubMed
    1. Li WQ, Cho E, Weinstock MA, Li S, Stampfer MJ, Qureshi AA. Cutaneous nevi and risk of melanoma death in women and men: A prospective study. J Am Acad Dermatol. (2019) 80:1284–91. doi: 10.1016/j.jaad.2018.12.058 - DOI - PMC - PubMed
    1. Natale CA, Li J, Zhang J, Dahal A, Dentchev T, Stanger BZ, et al. . Activation of G protein-coupled estrogen receptor signaling inhibits melanoma and improves response to immune checkpoint blockade. ELIFE. (2018) 7 :e31770. doi: 10.7554/eLife.31770 - DOI - PMC - PubMed

Publication types