. 2024 Apr;14(4):1677-1692.
doi: 10.1016/j.apsb.2023.12.015. Epub 2023 Dec 30.

Eubacterium coprostanoligenes alleviates chemotherapy-induced intestinal mucositis by enhancing intestinal mucus barrier

Affiliations

Eubacterium coprostanoligenes alleviates chemotherapy-induced intestinal mucositis by enhancing intestinal mucus barrier

Dongsheng Bai et al. Acta Pharm Sin B. 2024 Apr.

Abstract

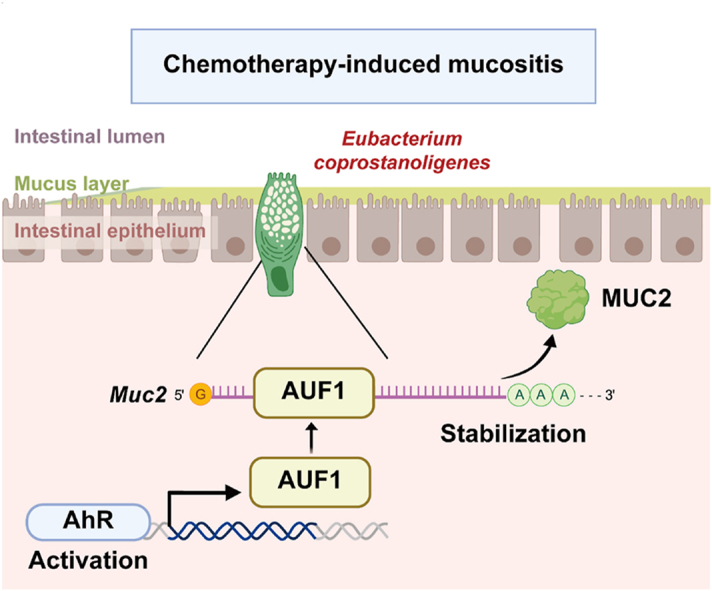
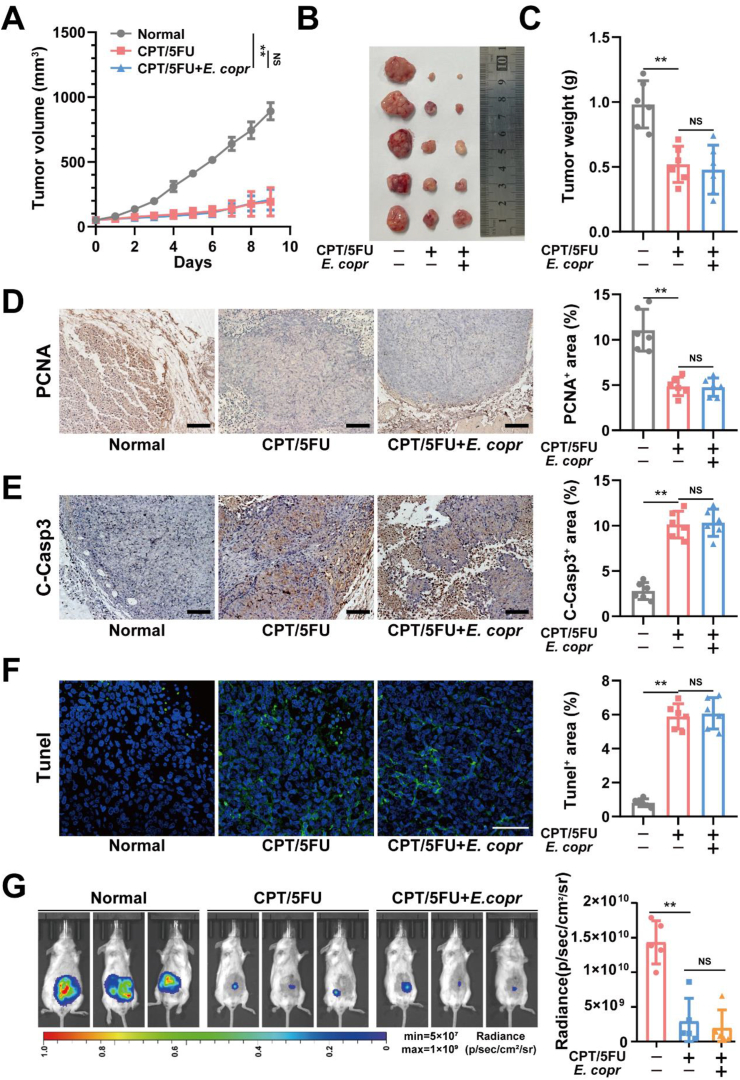
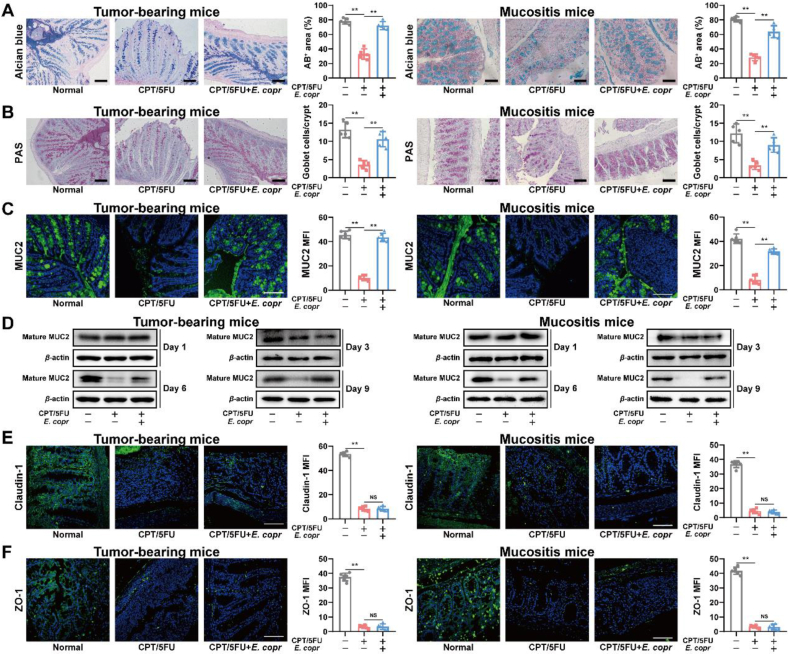
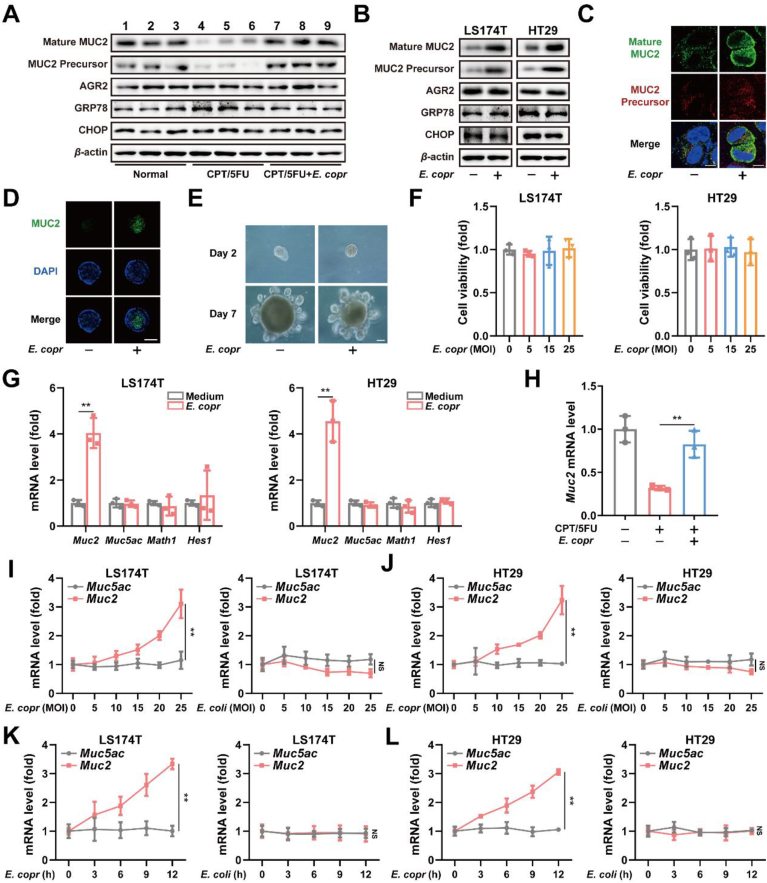
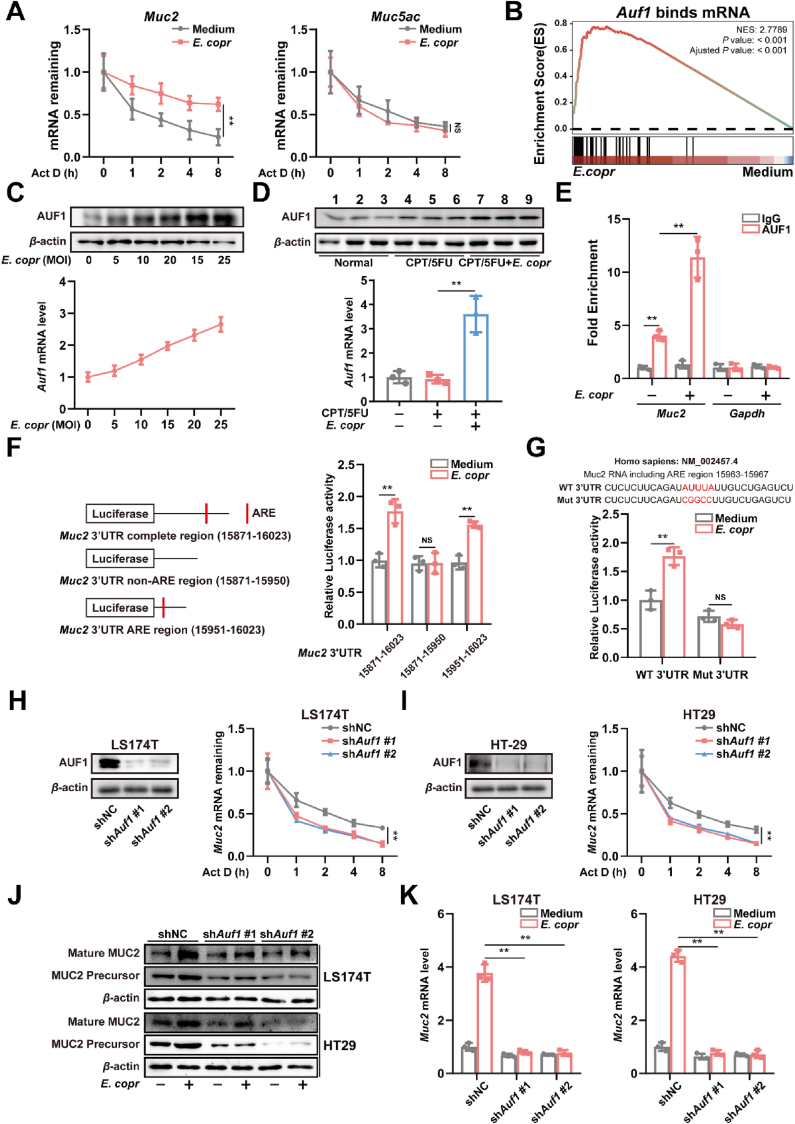
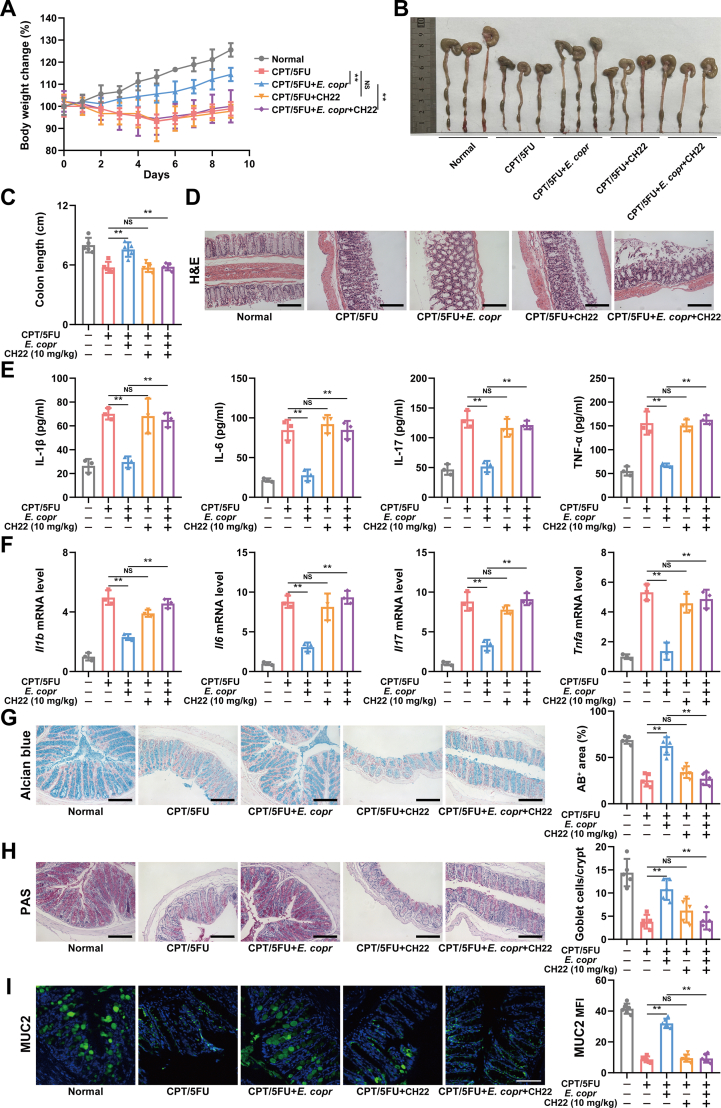
Chemotherapy-induced mucositis represents a severe adverse outcome of cancer treatment, significantly curtailing the efficacy of these treatments and, in some cases, resulting in fatal consequences. Despite identifying intestinal epithelial cell damage as a key factor in chemotherapy-induced mucositis, the paucity of effective treatments for such damage is evident. In our study, we discovered that Eubacterium coprostanoligenes promotes mucin secretion by goblet cells, thereby fortifying the integrity of the intestinal mucus barrier. This enhanced barrier function serves to resist microbial invasion and subsequently reduces the inflammatory response. Importantly, this effect remains unobtrusive to the anti-tumor efficacy of chemotherapy drugs. Mechanistically, E. copr up-regulates the expression of AUF1, leading to the stabilization of Muc2 mRNA and an increase in mucin synthesis in goblet cells. An especially significant finding is that E. copr activates the AhR pathway, thereby promoting the expression of AUF1. In summary, our results strongly indicate that E. copr enhances the intestinal mucus barrier, effectively alleviating chemotherapy-induced intestinal mucositis by activating the AhR/AUF1 pathway, consequently enhancing Muc2 mRNA stability.

Keywords: AUF1; Chemotherapy; Eubacterium coprostanoligenes; MUC2; Mucositis.


Conflict of interest statement

The authors have no conflicts of interest to declare.

Figures

Image 1
Graphical abstract
Figure 1
Figure 1
E. copr did not affect the tumor inhibitory effect of CPT/5FU in vivo. (A) Tumor volume in the control, CPT/5FU and E. copr groups were recorded daily. (B) Tumors images were obtained from indicated group on Day 9. (C) Weight of tumors were measured from indicated group. Expression of PCNA (D) and Cleaved-Caspase 3 (C-Casp3) (E) was measured by IHC and quantified by ImageJ in the tumor sections. Scale bar: 100 μm. (F) TUNEL staining and the quantification of TUNEL-positive cell was performed in tumor tissues. Scale bar: 20 μm. (G) Bioluminescence was detected and quantified in orthotopic xenografts of luciferase-labeled HCT116 cells from indicated group. The values are expressed as the mean ± SD, ∗∗P < 0.01. NS, not significant.
Figure 2
Figure 2
E. copr prevented intestinal mucositis induced by CPT/5FU in tumor-bearing mice. (A) Body weight of tumor-bearing mice in the control, CPT/5FU and E. copr groups were recorded daily. (B) Colon images of tumor-bearing mice in the indicated group were obtained on Day 9. (C) The colon length was measured from indicated group tumor-bearing mice. (D) Representative images of the histopathology of the colon sections were obtained from indicated group. Scale bar: 100 μm. (E) Expression of Cleaved-Caspase 3 (C-Casp3) was measured by IHC and quantified by ImageJ in the colon sections. Scale bar: 100 μm. (F) TUNEL staining and the quantification of TUNEL-positive cell was performed in the colon sections. Scale bar: 20 μm. The values are expressed as the mean ± SD, ∗∗P < 0.01. NS, not significant.
Figure 3
Figure 3
E. copr ameliorated intestinal mucositis induced by CPT/5FU. (A) Body weight in the control, CPT/5FU and E. copr groups were recorded daily. (B) Images of the colon in the indicated group were obtained on Day 9. (C) The colon length was measured in the indicated. (D) Representative images of the histopathology of the colon sections were obtained from indicated group. Scale bar: 100 μm. (E) Expression of Cleaved-Caspase 3 (C-Casp3) was measured by IHC and quantified by ImageJ in the colon sections. Scale bar: 100 μm. (F) TUNEL staining and the quantification of TUNEL-positive cell was performed in the colon sections. Scale bar: 20 μm. (G) Serum levels of IL-1β, IL-6, IL-17 and TNF-α were measured in the indicated group mice. (H) The mRNA levels of Il1b, Il6, Il17 and Tnfa were measured in the colon tissues of indicated group mice. The values are expressed as the mean ± SD, ∗∗P < 0.01. NS, not significant.
Figure 4
Figure 4
E. copr alleviated loss of the mucous layer induced by CPT/5FU. Alcian blue (A) and periodic acid-Schiff (B) were performed in colon sections from tumor-bearing mice and mucositis mice. Scale bar: 100 μm. (C) Expression of MUC2 was analyzed in colon sections from tumor-bearing mice and mucositis mice by immunofluorescence staining. Scale bar: 20 μm. (D) Expression of colonic mature MUC2 in indicated time was analyzed from tumor-bearing mice and mucositis mice. Claudin-1 (E) and ZO-1 (F) immunofluorescence staining were performed in colon sections from tumor-bearing mice and mucositis mice. Scale bar: 20 μm. The values are expressed as the mean ± SD, ∗∗P < 0.01. NS, not significant.
Figure 5
Figure 5
E. copr increased Muc2 mRNA level in goblet cells. (A) Expressions of mature MUC2, MUC2 precursor, AGR2, GRP78 and CHOP were analyzed by Western blot in colon tissues of mucositis mice. (B) Expressions of mature MUC2, MUC2 precursor, AGR2, GRP78 and CHOP were analyzed by Western blot in LS174T and HT29 cells. (C) Mature MUC2 and MUC2 precursor immunofluorescence staining were performed in LS174T cells. Scale bar: 10 μm. (D) Immunofluorescence staining of MUC2 were performed in intestinal organoids. Scale bar: 100 μm. (E) Light microscopy images were collected from intestinal organoids at passage 2. Scale bar: 100 μm. (F) Cell viability was measured in LS174T and HT29 cells infected with different amounts of E. copr. (G) The mRNA levels of Muc2, Muc5ac, Math1 and Hes1 were measured in LS174T and HT29 cells infected with E. copr (MOI = 25). (H) The mRNA level of Muc2 was measured in the colon tissues of indicated group mice. The mRNA levels of Muc2 and Muc5ac were measured in LS174T (I) and HT29 (J) cells infected with different amounts of E. copr or E. coli. The mRNA levels of Muc2 and Muc5ac were measured in LS174T (K) and HT29 (L) cells infected with E. copr (MOI = 25) or E. coli (MOI = 25) for different time. The values are expressed as the mean ± SD, ∗∗P < 0.01. NS, not significant.
Figure 6
Figure 6
E. copr increased Muc2 mRNA stability through AUF1. (A) After treatment with 5 μg/mL actinomycin D, total RNA was extracted at 0, 1, 2, 4, and 8 h. The half-lives of Muc2 and Muc5ac mRNA were measured after infection with E. copr (MOI = 25). (B) GSEA analyses of Auf1 binds mRNA gene sets in LS174T cells treated with E. copr vs medium. (C) Expression of Auf1 in protein (top) and mRNA (bottom) levels were analyzed in LS174T cells infected with different amounts of E. copr. (D) Expression of Auf1 in protein (top) and mRNA (bottom) levels were analyzed in the colon tissues of indicated group mice. (E) Muc2 mRNA expression was measured by qPCR in the RNA-binding protein immunoprecipitation (RIP) assay, and normalized to IgG isotype controls. (F) Diagram of the region of the pGL3 vector that encodes Muc2 3′UTR complete region (15871–16023), Muc2 3′UTR non-ARE region (15871–15950), or Muc2 3′UTR ARE region (15951–16023). The red bar shows the locations of AREs (left). The luciferase activities of each of the vectors encoding one of three different fragments of the Muc2 3′UTR were measured after infection with E. copr (MOI = 25) (right). (G) A predicted ARE region in the Muc2 3′UTR is shown in red (top). The luciferase activities of each of the vectors encoding WT or mutant fragments of the Muc2 3′UTR were measured after infection with E. copr (MOI = 25) (bottom). The half-lives of Muc2 mRNA were measured in LS174T (H) and HT29 (I) cells expressing Auf1 shRNA. (J) Expressions of mature MUC2 and MUC2 precursor were analyzed by Western blot in LS174T and HT29 cells expressing Auf1 shRNA after infection of E. copr (MOI = 25). (K) The mRNA levels of Muc2 were measured in LS174T and HT29 cells expressing Auf1 shRNA after infection of E. copr (MOI = 25).
Figure 7
Figure 7
E. copr increased AUF1 transcription and Muc2 mRNA stability through activating AhR. (A) After 12 h of infection with E. copr and another 12 h of treatment with actinomycin D, the Auf1 mRNA levels were measured at specific times. (B) TF-binding site motif analysis for upregulated Auf1 in LS174T cells. (C) GSEA analyses of AhR regulated gene sets in LS174T cells treated with E. copr vs medium. (D) The mRNA levels of Cyp1a1 and Cyp1b1 were measured in LS174T and HT29 cells after infection of E. copr (MOI = 25). (E) Schematic representation of the different luciferase reporter vectors of the 5′ deletions Auf1 promoter (left). The luciferase activities of different 5′ deletions Auf1 promoter were measured after infection of E. copr (MOI = 25) (right). (F) Sequence logo of AhR complement (top). Schematic representation of the different luciferase reporter vectors of the Auf1 promoter mutants (bottom). (G) Schematic representation of the different luciferase reporter vectors of the 5′ mutation Auf1 promoter (left). The luciferase activities of different 5′ mutation Auf1 promoter were measured after infection with E. copr (MOI = 25) (right). (H) Chromatin from LS174T cells treated with E. copr or medium was analyzed for recruitment of AhR to the regulatory region of the Auf1 promoter by ChIP-qPCR. (I) Chromatin from LS174T cells expressing Ahr shRNA after treatment of E. copr or medium was analyzed for recruitment of RNA Pol-II to the regulatory region of the Auf1 promoter by ChIP-qPCR. The mRNA levels of Auf1 were measured in LS174T (J) and HT29 (K) cells expressing Ahr shRNA after infection of E. copr (MOI = 25). (L) Expressions of mature MUC2 and MUC2 precursor were analyzed by Western blot in LS174T and HT29 cells expressing Ahr shRNA after infection of E. copr (MOI = 25). (M) The mRNA levels of Muc2 were measured in LS174T and HT29 cells expressing Ahr shRNA after infection of E. copr (MOI = 25).
Figure 8
Figure 8
E. copr alleviated intestinal mucositis through activating AhR. (A) Body weight in the control, CPT/5FU, E. copr, CH223191 and the combination of E. copr and CH223191 groups were recorded daily. (B) Images of the colon in the indicated group were obtained on Day 9. (C) The colon length was measured in the indicated. (D) Representative images of the histopathology of the colon sections were obtained from indicated group. Scale bar: 100 μm. (E) Serum levels of IL-1β, IL-6, IL-17 and TNF-α were measured in the indicated group mice. (F) The mRNA levels of Il1b, Il6, Il17 and Tnfa were measured in the colon tissues of indicated group mice. Alcian blue (G) and periodic acid-Schiff (H) were performed in colon sections of mucositis mice. Scale bar: 100 μm. (I) Expression of MUC2 was analyzed in colon sections of mucositis mice by immunofluorescence staining. Scale bar: 20 μm.

Similar articles

Cited by

References

    1. Akbarali H.I., Muchhala K.H., Jessup D.K., Cheatham S. Chemotherapy induced gastrointestinal toxicities. Adv Cancer Res. 2022;155:131–166. - PMC - PubMed
    1. Wei L., Wen X.S., Xian C.J. Chemotherapy-induced intestinal microbiota dysbiosis impairs mucosal homeostasis by modulating Toll-like receptor signaling pathways. Int J Mol Sci. 2021;22 - PMC - PubMed
    1. Docimo R., Anastasio M.D., Bensi C. Chemotherapy-induced oral mucositis in children and adolescents: a systematic review. Eur Arch Paediatr Dent. 2022;23:501–511. - PubMed
    1. De Pietri S., Weischendorff S., Rathe M., Frandsen T.L., Hasle H., Nersting J., et al. Gastrointestinal barrier integrity and mucosal inflammation as risk factors of blood stream infections in children treated for acute lymphoblastic leukaemia. Int J Cancer. 2023;153:1635–1642. - PubMed
    1. Hino S., Yamada M., Iijima Y., Fujita Y., Sano M., Kaneko T., et al. Cancer chemotherapy-induced oral adverse events: oral dysesthesia and toothache–a retrospective study. Ann Maxillofac Surg. 2021;11:86–90. - PMC - PubMed

LinkOut - more resources