. 2024 Mar 20:18:1372297.
doi: 10.3389/fnins.2024.1372297. eCollection 2024.

β-amyloid accumulation enhances microtubule associated protein tau pathology in an APPNL-G-F/MAPTP301S mouse model of Alzheimer's disease

Affiliations

β-amyloid accumulation enhances microtubule associated protein tau pathology in an APPNL-G-F/MAPTP301S mouse model of Alzheimer's disease

Lulu Jiang et al. Front Neurosci. .

Abstract

Introduction: The study of the pathophysiology study of Alzheimer's disease (AD) has been hampered by lack animal models that recapitulate the major AD pathologies, including extracellular -amyloid (A) deposition, intracellular aggregation of microtubule associated protein tau (MAPT), inflammation and neurodegeneration.

Methods: The humanized APPNL-G-F knock-in mouse line was crossed to the PS19 MAPTP301S, over-expression mouse line to create the dual APPNL-G-F/PS19 MAPTP301S line. The resulting pathologies were characterized by immunochemical methods and PCR.

Results: We now report on a double transgenic APPNL-G-F/PS19 MAPTP301S mouse that at 6 months of age exhibits robust A plaque accumulation, intense MAPT pathology, strong inflammation and extensive neurodegeneration. The presence of A pathology potentiated the other major pathologies, including MAPT pathology, inflammation and neurodegeneration. MAPT pathology neither changed levels of amyloid precursor protein nor potentiated A accumulation. Interestingly, study of immunofluorescence in cleared brains indicates that microglial inflammation was generally stronger in the hippocampus, dentate gyrus and entorhinal cortex, which are regions with predominant MAPT pathology. The APPNL-G-F/MAPTP301S mouse model also showed strong accumulation of N6-methyladenosine (m6A), which was recently shown to be elevated in the AD brain. m6A primarily accumulated in neuronal soma, but also co-localized with a subset of astrocytes and microglia. The accumulation of m6A corresponded with increases in METTL3 and decreases in ALKBH5, which are enzymes that add or remove m6A from mRNA, respectively.

Discussion: Our understanding of the pathophysiology of Alzheimer's disease (AD) has been hampered by lack animal models that recapitulate the major AD pathologies, including extracellular -amyloid (A) deposition, intracellular aggregation of microtubule associated protein tau (MAPT), inflammation and neurodegeneration. The APPNL-G-F/MAPTP301S mouse recapitulates many features of AD pathology beginning at 6 months of aging, and thus represents a useful new mouse model for the field.

Keywords: RNA binding proteins; RNA methylation; clarity; neuritic plaques; neurodegeneration; neuropathology; tau oligomers; tauopathy.


Conflict of interest statement

CK and BN are employed by LifeCanvas Technologies. BW is co-founder and Chief Scientific Officer for Aquinnah Pharmaceuticals Inc. The remaining authors declare that the research was conducted in the absence of any commercial or financial relationships that could be construed as a potential conflict of interest.

Figures

Figure 1
Figure 1
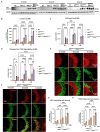
Beta-amyloid deposition accumulates in a time-dependent manner in the APPNL-G-F/MAPTP301S mouse. (A) Representative images of immunoblot with 4G8 antibody showed the expression of human amyloid precursor protein (APP) in the APPNL-G-F and APPNL-G-F/MAPTP301S mouse brain but not wild type (WT) or MAPTP301S brain. Total brain lysates were harvested at 3, 6, and 9 months for each of the four mouse genotypes (WT, APPNL-G-F, MAPTP301S, and APPNL-G-F/MAPTP301S double transgenic, respectively). GAPDH was detected as the internal control. (B) Quantification of human APP expression in the total brain lysate as shown in (A). N = 4, data shown as mean ± SEM. (C,D) The amount of Aβ38 and Aβ42 in the total brain lysate detected by V-PLEX Aβ Peptide Panel 1 (4G8) Kit. Brain lysate from 4 genotypes of mice were detected at 3, 6, and 9 months, respectively. N = 4 mice in each condition, data shown as mean ± SEM. Two-way ANOVA with Tukey’s multiple comparisons test, *p < 0.05, **p < 0.01, and ****p < 0.001. (E) The 6E10 antibody (reactive to aa 1–16 Aβ and to APP) was used to examine the diffused amyloid plaques in the aging process of APPNL-G-F and APPNL-G-F/MAPTP301S mouse brain. Representative DAB staining images showed the progressive increase of 6E10 positive β-amyloid plaques in the entorhinal cortex from 3 to 6 and 9 months of mouse brain. Scale bar 250 μm. (F) Quantification for the number of 6E10 positive β-amyloid plaques averaged over 1 mm2 squares across each brain slice. N = 4 mice in each group, data shown as mean ± SEM. Two-way ANOVA with Tukey’s multiple comparisons test, *p < 0.05 and ****p < 0.001. (G) The 4G8 antibody (reactive to Aβ, aa 17–24) was used to examine the compact amyloid plaques in the aging process of APPNL-G-F and APPNL-G-F/MAPTP301S mouse brain. Representative red fluorescence labeling stacked images showed the progressive increase of 4G8 positive β-amyloid plaques in the entorhinal cortex from 3 to 6 and 9 months of mouse brain. Scale bar 100 μm. (H,I) Quantification of the number and average size of 4G8 positive Aβ + plaques. N = 4 mice per group, 3 sections were used for each mouse. Data shown as mean ± SEM. Two-way ANOVA with Tukey’s multiple comparisons test, *p < 0.05 and ****p < 0.001.
Figure 2
Figure 2
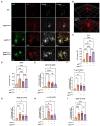
APPNL-G-F potentiates progression of MAPT pathology in the APPNLGF/MAPTP301S double transgenic mice. (A) Representative images of western blot with phosphorylated tau antibody on phosphor-site threonine217 (pTau217) showed the accumulation of hyper phosphorylated tau in the MAPTP301S and APPNL-G-F/MAPTP301S mouse brain but not wild type (WT) or APPNL-G-F brain. Total brain lysate were harvested at 3, 6, and 9 months for each of the four genotypes (WT, APPNL-G-F, MAPTP301S, and APPNL-G-F/MAPTP301S) of mice, respectively. GAPDH was detected as the internal control. (B) Quantification of pTau217 in the total brain lysate as shown in (A). N = 4 mice in each group, data shown as mean ± SEM. Statistics was by two-way ANOVA with post hoc Tukey’s multiple comparisons test, ****p < 0.001. (C,D) Detection of total MAPT levels in the brain lysates with the BT2 antibody (epitope between aa 194–198, but not PHF tau) and threonine181 phosphorylated tau (pTau181) by AT270 antibody, respectively, with ELISA assay. N = 4 mice in each group, data shown as mean ± SEM. Statistical analysis was by two-way ANOVA with post hoc Tukey’s multiple comparisons test, ***p < 0.005 and ****p < 0.001. (E) Representative fluorescence labeling images showed the accumulation of misfolding tau (by MC1 antibody, red) in the hippocampal CA3 region of APPNL-G-F/MAPTP301S mice over 3, 6, and 9 months. NeuN antibody (green) was used to label the neuronal cells. Scale bar 50 μm. (F) Representative fluorescence images show the accumulation of oligomeric tau (TOMA2 antibody, red) in the hippocampal CA3 brain region of APPNL-G-F/MAPTP301S mice over 3, 6, and 9 months. NeuN antibody (green) was used to label neurons. Scale bar 50 μm. (G,H) Quantification of misfolded tau (MC1) and oligomeric tau (TOMA2) as shown in (E,F) respectively. Total fluorescence intensity was collected and then normalized by NeuN for statistics. N = 4 mice in each group, data is shown as mean ± SEM. Two-way ANOVA was used for statistics followed by post hoc analysis with Tukey’s multiple comparisons test, *p < 0.05, **p < 0.01, ***p < 0.005, and ****p < 0.001.
Figure 3
Figure 3
APPNL-G-F is the predominant driver of microglial activation and astrogliosis. (A) Representative fluorescence labeling images showed the activation and morphological changes of microglia (by Iba-1 antibody, red) in the frontal cortex in pathological APPNL-G-F and/or MAPTP301S mouse brain at 9 months old. Astrocytes (GFAP antibody, white) were robustly activated around Aβ plaques. Scale bar 50 μm. (B) Enlarged image showed the amoeba-like morphological changes of microglia in the APPNL-G-F/MAPTP301S mouse brain. (C,D) Quantification of microglial activation by Iba-1 intensity and astrogliosis by GFAP intensity as shown in (A). Data was normalized to the fold increase of WT control. N = 6 mice in each group, data is shown as mean ± SEM. Two-way ANOVA was used for statistics followed by post hoc analysis with Tukey’s multiple comparisons test, **p < 0.01, ***p < 0.005, and ****p < 0.001. (E–I) Quantification on the transcriptomic levels of inflammatory factors in the brain of WT, APPNL-G-F, MAPTP301S, and APPNL-G-F/MAPTP301S mouse lines, respectively, at 9 months. The pro-inflammatory factors TNF-α, IL-1β, C1qa as well as BDNF were quantified by RT qPCR. Results are shown as fold-change vs. WT control. N = 10–12 mice per group; data is shown as mean ± SEM. One-way ANOVA was used for statistics followed by post hoc analysis with Tukey’s multiple comparisons test, *p < 0.05, **p < 0.01, ***p < 0.005, and ****p < 0.001.
Figure 4
Figure 4
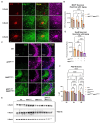
APPNL-G-F potentiates neurodegeneration in the APPNLGF/MAPTP301S double transgenic mice. (A) Representative images showed the enhanced neurodegeneration (MAP-2, magenta) associated with progressive Aβ deposition (4G8, red) and phosphorylated tau (pTau217, green) accumulation in the APPNL-G-F/MAPTP301S mouse brain. Scale bar 50 μm. (B) Quantification of neurodegeneration by MAP-2 intensity as shown in (A). N = 6 mice in each group; data is shown as mean ± SEM. Two-way ANOVA was used for statistics followed by post hoc analysis with Tukey’s multiple comparisons test, *p < 0.05 and ****p < 0.001. (C) Representative images showed enhanced neurodegeneration in APPNL-G-F/MAPTP301S mouse brain compared to APPNL-G-F or MAPTP301S mouse lines at 9 months. Scale bar 50 μm. (D) Quantification of neurodegeneration by NeuN positive neuronal intensity as shown in panel (C) (magenta panels). N = 6 mice in each group, data is shown as mean ± SEM. One-way ANOVA was used for statistics followed by post hoc analysis with Tukey’s multiple comparisons test, *p < 0.05 and ***p < 0.005. (E,F) Immunoblot of post-synaptic marker PSD-95 showed the potentiated neurodegeneration in the APPNL-G-F/MAPTP301S mouse brain compared to APPNL-G-F or MAPTP301S mouse lines over a 3, 6, and 9 months old. Quantification of band intensities showed that progressive and enhanced decrease of PSD-95 in the APPNL-G-F/MAPTP301S mouse brain. N = 4 mice in each group, data was normalized to percentage of WT control and is shown as mean ± SEM. Two-way ANOVA was used for statistics followed by post hoc analysis with Tukey’s multiple comparisons test, *p < 0.05, **p < 0.01, ***p < 0.005, and ****p < 0.001.
Figure 5
Figure 5
m6A and its regulator enzyme proteins are dysregulated in the APPNLGF/MAPTP301S double transgenic mice in correspondence to the progression of tau pathology. (A) Representative images showed the increased m6A intensity in APPNLGF/MAPTP301S mouse brain at 6 months compared to WT control. Scale bar 50 μm. (B) Quantification of m6A intensity in comparison between APPNLGF/MAPTP301S and WT control during the aging process. N = 6 mice in each group, 3 brain sections were selected from each mouse brain with same position of hippocampus CA3. Data are shown as mean ± SEM. Two-way ANOVA was used for statistics followed by post hoc analysis with Tukey’s multiple comparisons test, ***p < 0.005 and ****p < 0.001. (C,D) Immunoblot analysis of the m6A methyltransferase Mettl3 showed progressively increased intensity in APPNL-G-F /MAPTP301S mouse brain compared to APPNL-G-F or MAPTP301S alone at 3, 6, and 9 months. GAPDH was detected and used as internal control for statistical analysis. N = 4 mice in each group, data was normalized to percentage of WT control and is shown as mean ± SEM. Two-way ANOVA was used followed by post hoc analysis with Tukey’s multiple comparisons test, ****p < 0.001. (E,F) Immunoblot analysis of the m6A RNA demethylase ALKBH5 showed decreased intensity in APPNL-G-F/MAPTP301S mouse brain compared to APPNL-G-F or MAPTP301S alone during the aging process at 3 to 6 and 9 months. Quantification of band intensity showed the decreased ALKBH5 correlated with MAPT pathology in APPNL-G-F/MAPTP301S and MAPTP301S mouse brain. GAPDH was used as internal control for statistical analysis. N = 4 mice in each group, data was normalized to percentage of WT control and is shown as mean ± SEM. Two-way ANOVA was used followed by post hoc analysis with Tukey’s multiple comparisons test, ****p < 0.001.

References

    1. Afagh A., Cummings B. J., Cribbs D. H., Cotman C. W., Tenner A. J. (1996). Localization and cell association of C1q in Alzheimer’s disease brain. Exp. Neurol. 138, 22–32. doi: 10.1006/exnr.1996.0043 - DOI - PubMed
    1. Apicco D. J., Ash P. E. A., Maziuk B., LeBlang C., Medalla M., Al Abdullatif A., et al. . (2018). Reducing the RNA binding protein TIA1 protects against tau-mediated neurodegeneration in vivo. Nat. Neurosci. 21, 72–80. doi: 10.1038/s41593-017-0022-z, PMID: - DOI - PMC - PubMed
    1. Apicco D. J., Zhang C., Maziuk B., Jiang L., Ballance H. I., Boudeau S., et al. . (2019). Dysregulation of RNA splicing in tauopathies. Cell Rep. 29, 4377–4388.e4. doi: 10.1016/j.celrep.2019.11.093, PMID: - DOI - PMC - PubMed
    1. Ash P. E., Vanderweyde T. E., Youmans K. L., Apicco D. J., Wolozin B. (2014). Pathological stress granules in Alzheimer’s disease. Brain Res. 1584, 52–58. doi: 10.1016/j.brainres.2014.05.052, PMID: - DOI - PMC - PubMed
    1. Ashton N. J., Janelidze S., Mattsson-Carlgren N., Binette A. P., Strandberg O., Brum W. S., et al. . (2022). Differential roles of Aβ42/40, p-tau231 and p-tau217 for Alzheimer’s trial selection and disease monitoring. Nat. Med. 28, 2555–2562. doi: 10.1038/s41591-022-02074-w - DOI - PMC - PubMed

LinkOut - more resources