. 2024 Mar 20:11:1353096.
doi: 10.3389/fcvm.2024.1353096. eCollection 2024.

Automatic and interpretable prediction of the site of origin in outflow tract ventricular arrhythmias: machine learning integrating electrocardiograms and clinical data

Affiliations

Automatic and interpretable prediction of the site of origin in outflow tract ventricular arrhythmias: machine learning integrating electrocardiograms and clinical data

Álvaro J Bocanegra-Pérez et al. Front Cardiovasc Med. .

Abstract

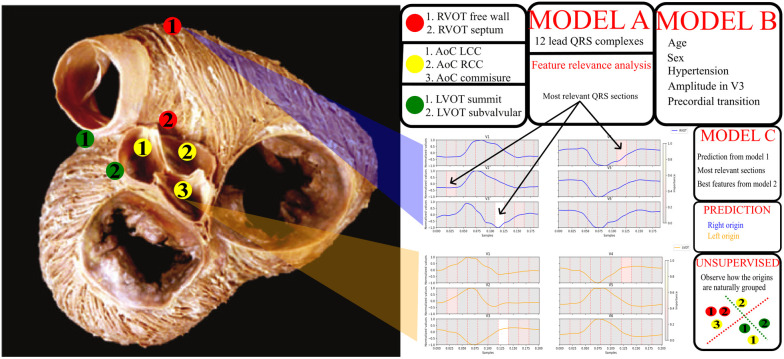
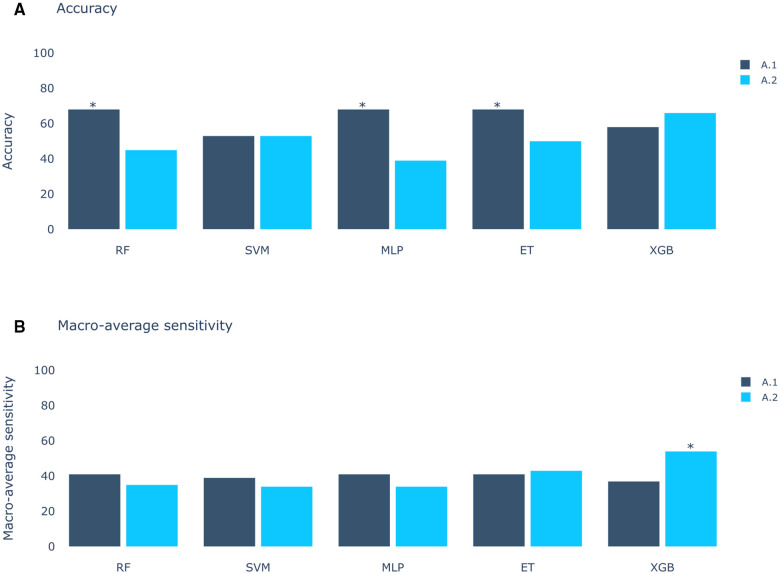
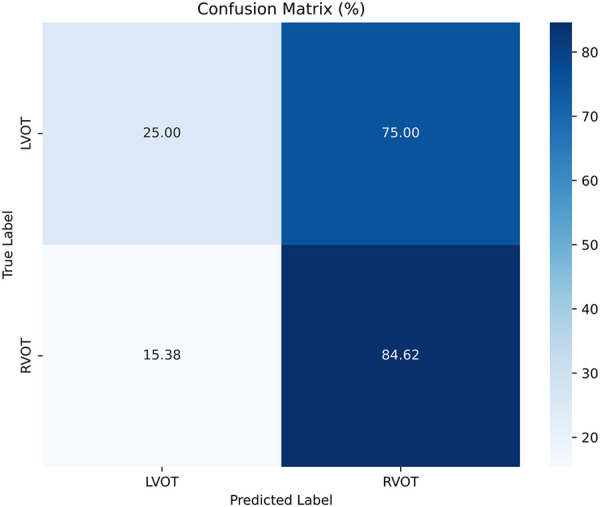
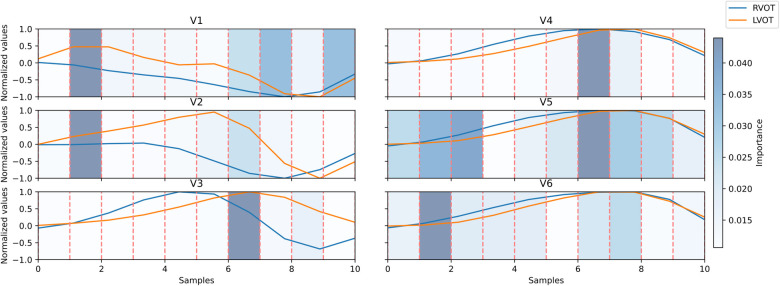
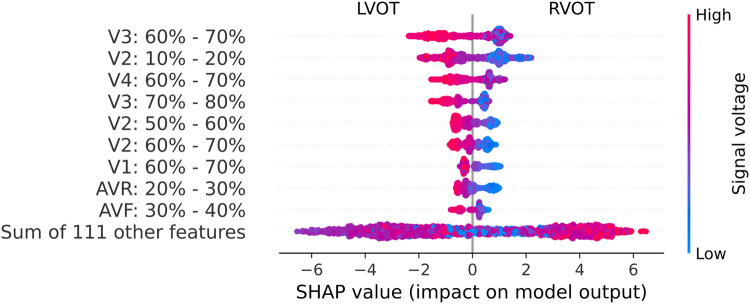
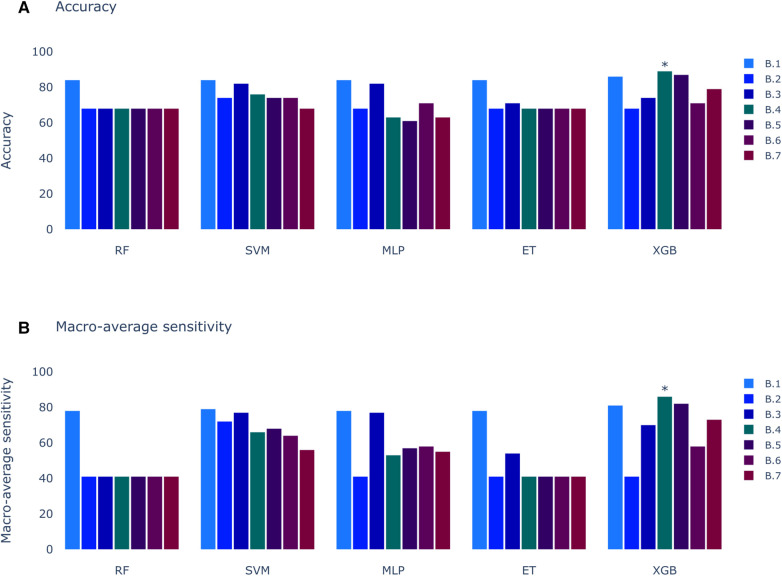
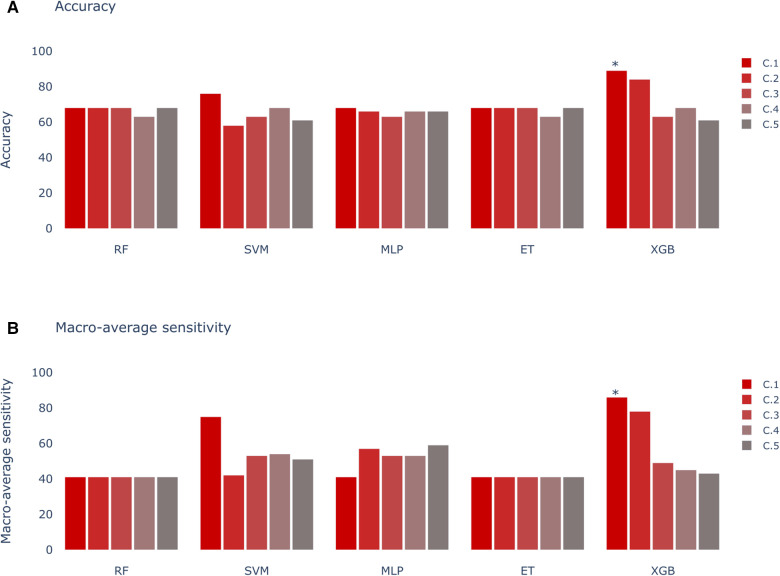
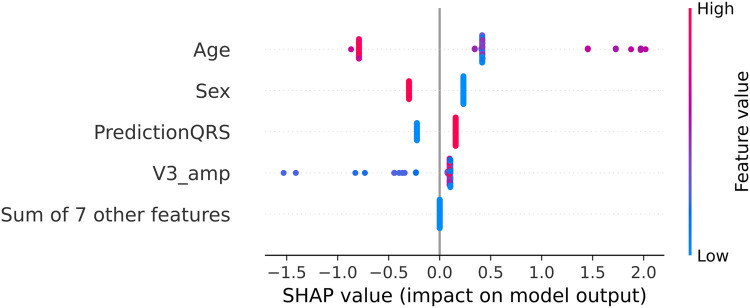
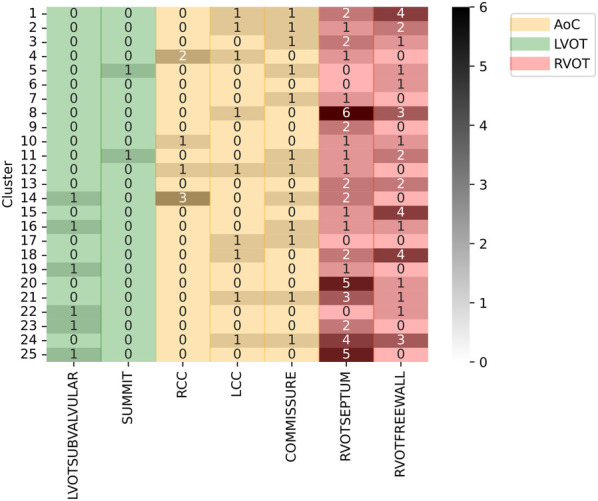
The treatment of outflow tract ventricular arrhythmias (OTVA) through radiofrequency ablation requires the precise identification of the site of origin (SOO). Pinpointing the SOO enhances the likelihood of a successful procedure, reducing intervention times and recurrence rates. Current clinical methods to identify the SOO are based on qualitative analysis of pre-operative electrocardiograms (ECG), heavily relying on physician's expertise. Although computational models and machine learning (ML) approaches have been proposed to assist OTVA procedures, they either consume substantial time, lack interpretability or do not use clinical information. Here, we propose an alternative strategy for automatically predicting the ventricular origin of OTVA patients using ML. Our objective was to classify ventricular (left/right) origin in the outflow tracts (LVOT and RVOT, respectively), integrating ECG and clinical data from each patient. Extending beyond differentiating ventricle origin, we explored specific SOO characterization. Utilizing four databases, we also trained supervised learning models on the QRS complexes of the ECGs, clinical data, and their combinations. The best model achieved an accuracy of 89%, highlighting the significance of precordial leads V1-V4, especially in the R/S transition and initiation of the QRS complex in V2. Unsupervised analysis revealed that some origins tended to group closer than others, e.g., right coronary cusp (RCC) with a less sparse group than the aortic cusp origins, suggesting identifiable patterns for specific SOOs.

Keywords: electrocardiogram; feature analysis; machine learning; outflow tract ventricular arrhythmias; site of origin.


Conflict of interest statement

The authors declare that the research was conducted in the absence of any commercial or financial relationships that could be construed as a potential conflict of interest.

Figures

Figure 1
Figure 1
General diagram of the pipeline. On the left, a picture of the outflow tracts adapted from Sánchez-Quintana et al. (13). The specific sites of origin are marked in the picture. The red points correspond to the RVOT origins, the green points to the LVOT, and the yellow to the aortic cusp (AoC) origins, which are subgroup from the LVOT origins. On the right, a legend for the origins, two signal examples for RVOT (blue) and LVOT (orange) origins and a scheme with the models obtained from the different experiments. Model A uses the 12 lead QRS complexes, model B patient data and basic ECG features listed in the figure, model C uses the best QRS segments obtained from the feature relevance analysis of model A, the best feature configuration obtained from model B and the prediction done by the model A. Finally, unsupervised clustering was performed to explore the natural distribution of the specific sites of origin using the best set of features.
Figure 2
Figure 2
Models score comparison. RF, Random Forest; SVM, Support Vector Machine; MLP, Multilayer Perceptron; ET, Extra Trees; XGB, XGBoost. (A) Models accuracy.* shows the highest scores at 68% in RF, MLP and ET for Experiment A, Scenario 1 (A.1). (B) Models macro-average sensitivity comparison. * shows the highest score at 54% for XGB in Experiment A, Scenario 2 (A.2). Achieving better results when using all databases (Scenario 2) than using only DS-114 (Scenario 1).
Figure 3
Figure 3
Confusion matrix of the model of Experiment A.2 with XGBoost.
Figure 4
Figure 4
Signal comparison between the average QRS complex of right ventricular outflow tract (RVOT) cases, in blue, vs. left ventricular outflow tract (LVOT) cases, in orange, in the precordial leads. The distribution of relevance per section; in blue scaled in the background, the amplitudes were normalized per lead. Dashed lines in red mark segments of 10% of the original signal.
Figure 5
Figure 5
Beeswarm graph from the SHAP values. The SHAP values (horizontal axis) show how each feature (left column) contributes to the negative (LVOT) or positive (RVOT) outputs. Color is employed to represent the original value of a feature, in this case, mean voltage per QRS complex section (each feature corresponds to 10% sections of the QRS complex in each lead). Each dot corresponds to one patient.
Figure 6
Figure 6
Models score comparison. RF, Random Forest; SVM, Support Vector Machine; MLP, Multilayer Perceptron; ET, Extra Trees; XGB, XGBoost; RF, Random Forest; SVM, Support Vector Machine; MLP, Multilayer Perceptron; ET, Extra Trees; XGB, XGBoost. (A) Models accuracy. * shows the highest scores at 89% in XGB for Experiment B, Scenario 4 (B.4). (B) Models macro-average sensitivity comparison. * shows the highest score at 86% for XGB in Experiment B, Scenario 4 (B.4).
Figure 7
Figure 7
Models score comparison. RF, Random Forest; SVM, Support Vector Machine; MLP, Multilayer Perceptron; ET, Extra Trees; XGB, XGBoost. (A) Models accuracy. * shows the highest scores at 89% in XGB for Experiment C, Scenario 1 (C.1). (B) Models macro-average sensitivity comparison. * shows the highest score at 86% for XGB in Experiment C, Scenario 1 (C.1).
Figure 8
Figure 8
SHAP values for the best model in Experiment C (C.1 with XGBoost). The SHAP values (horizontal axis) show how each feature (left column) contributes to the negative (LVOT) or positive (RVOT) outputs. Color is employed to represent the original value of a feature. Each dot corresponds to one patient. Age: age of the patient, red indicates an older patient. Sex: sex of the patient, red indicates male patients, PredictionQRS: Binary prediction done by the best model of Experiment A.2, red indicates a LVOT prediction. V3_Amp: Amplitude in lead V3, red indicates a higher peak voltage in V3.
Figure 9
Figure 9
Clustering results using specific SOO as label. Y-axis show the clusters, X-axis show the specific SOO, being: LVOTSUBVALVULAR, left ventricular outflow tract in the sub-valvular area; SUMMIT, summit of the left ventricle; RCC, right coronary cusp; LCC, left coronary cusp; COMMISSURE, RCC/LCC commissure; RVOTSEPTUM, the septum in the right ventricular outflow tract and RVOTFREEWALL, the free wall in the right ventricular outflow tract. Green zone groups the LVOT origins, excluding the AoC origins, the red zone groups the RVOT origins and the yellow zone shows the AoC origins. The grayscale shows the frequency of each origin per cluster.

Similar articles

References

    1. Koplan BA, Stevenson WG. Ventricular tachycardia, sudden cardiac death. In: Mayo Clinic Proceedings. Elsevier (2009). Vol. 84, p. 289–97. - PMC - PubMed
    1. Lerman BB. Mechanism, diagnosis,, treatment of outflow tract tachycardia. Nat Rev Cardiol. (2015) 12:597–608. 10.1038/nrcardio.2015.121 - DOI - PubMed
    1. Marrouche NF, Wilber D, Hindricks G, Jais P, Akoum N, Marchlinski F, et al. Association of atrial tissue fibrosis identified by delayed enhancement MRI and atrial fibrillation catheter ablation: the DECAAF study. JAMA. (2014) 311:498–506. 10.1001/jama.2014.3 - DOI - PubMed
    1. Anderson RD, Kumar S, Parameswaran R, Wong G, Voskoboinik A, Sugumar H, et al. Differentiating right-and left-sided outflow tract ventricular arrhythmias: classical ECG signatures and prediction algorithms. Circ Arrhythm Electrophysiol. (2019) 12:e007392. 10.1161/CIRCEP.119.007392 - DOI - PubMed
    1. Jiao Z, Li Y, Mao J, Liu X, Yang X, Tan C, et al. Differentiating origins of outflow tract ventricular arrhythmias: a comparison of three different electrocardiographic algorithms. Braz J Med Biol Res. (2016) 49:e5206. 10.1590/1414-431x20165206 - DOI - PMC - PubMed

LinkOut - more resources