

DRD1 suppresses cell proliferation and reduces EGFR activation and PD-L1 expression in NSCLC
- PMID: 38572507
- PMCID: PMC11161724
- DOI: 10.1002/1878-0261.13608
DRD1 suppresses cell proliferation and reduces EGFR activation and PD-L1 expression in NSCLC
Abstract
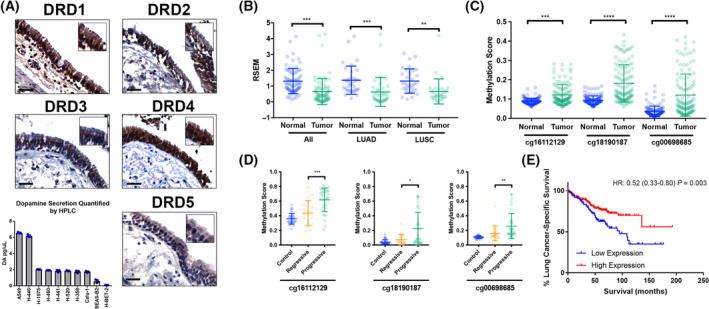
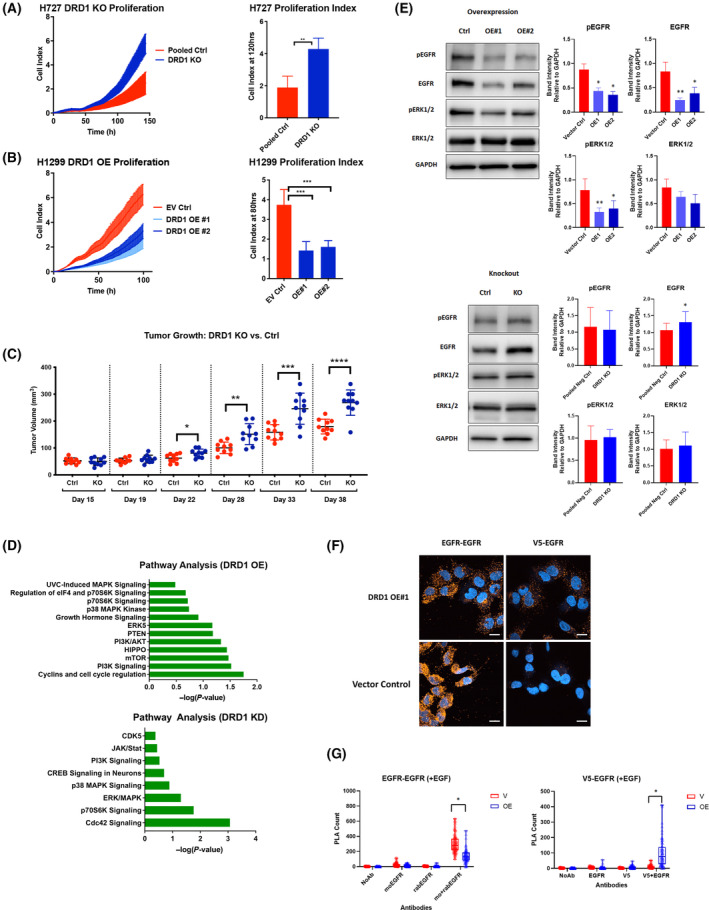
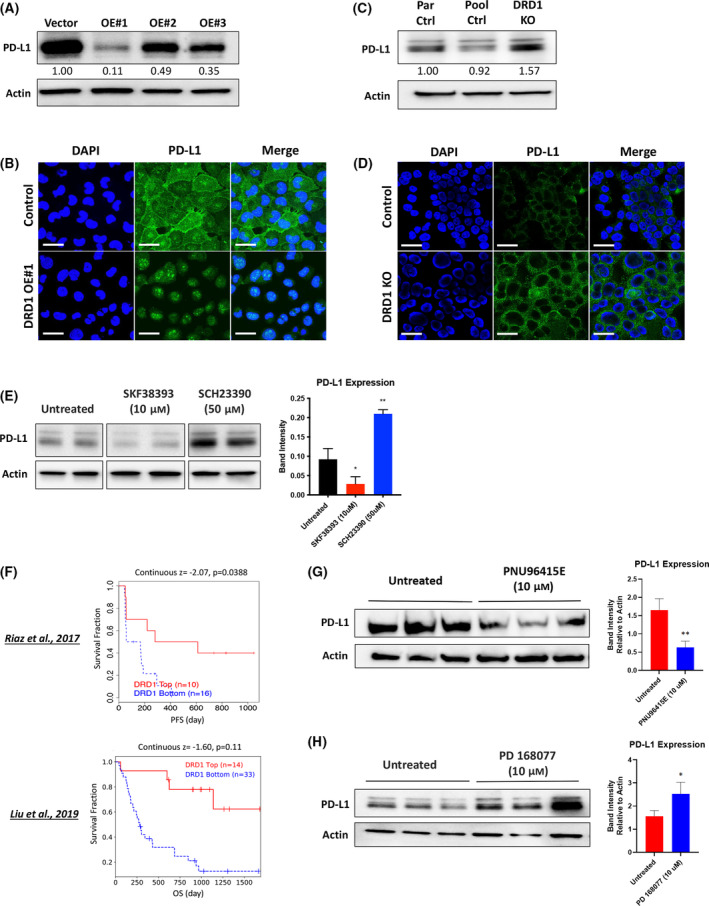
Dopamine (DA) acts in various key neurological and physiological processes as both a neurotransmitter and circulating hormone. Over the past several decades, the DA signaling network has been shown to regulate the progression of several types of solid tumors, and considerable evidence has shown it is a druggable pathway in the cancer cell context. However, the specific activity and effect of these pathway components appears to be tissue-type and cell-context-dependent. In the present study, expression and methylation of dopamine receptor D1 (DRD1) were measured using RNA sequencing (RNAseq) and reverse transcription polymerase chain reaction (RT-PCR) in non-small cell lung cancer (NSCLC) samples, and validated using publicly available datasets, including The Cancer Genome Atlas (TCGA). In vitro and in vivo functional experiments were performed for cell proliferation and tumor growth, respectively. Mechanistic analyses of the transcriptome and kinome in DRD1-modulated cells informed further experiments, which characterized the effects on the epidermal growth factor receptor (EGFR) pathway and programmed cell death 1 ligand 1 (PD-L1) proteins. Through these experiments, we identified the DRD1 gene as a negative regulator of disease progression in NSCLC. We show that DRD1, as well as other DA pathway components, are expressed in normal human lung tissue, and that loss of DRD1 expression through promoter hypermethylation is a common feature in NSCLC patients and is associated with worse survival. At the cellular level, DRD1 affects proliferation by inhibiting the activation of EGFR and mitogen-activated protein kinase 1/2 (ERK1/2). Interestingly, we also found that DRD1 regulates the expression of PD-L1 in lung cancer cells. Taken together, these results suggest that DRD1 methylation may constitute a biomarker of poor prognosis in NSCLC patients while other components of this pathway could be targeted to improve response to EGFR- and PD-L1-targeted therapies.
Keywords: DRD1; EGFR; PD‐L1; dopamine; non‐small cell lung cancer.
© 2024 The Authors. Molecular Oncology published by John Wiley & Sons Ltd on behalf of Federation of European Biochemical Societies. This article has been contributed to by U.S. Government employees and their work is in the public domain in the USA.
Conflict of interest statement
The authors declare no conflict of interest.
Figures
Similar articles
-
ILT4 inhibition prevents TAM- and dysfunctional T cell-mediated immunosuppression and enhances the efficacy of anti-PD-L1 therapy in NSCLC with EGFR activation.Theranostics. 2021 Jan 19;11(7):3392-3416. doi: 10.7150/thno.52435. eCollection 2021. Theranostics. 2021. PMID: 33537094 Free PMC article.
-
Hypoxia-inducible factor-1α and nuclear factor-κB play important roles in regulating programmed cell death ligand 1 expression by epidermal growth factor receptor mutants in non-small-cell lung cancer cells.Cancer Sci. 2019 May;110(5):1665-1675. doi: 10.1111/cas.13989. Epub 2019 Mar 23. Cancer Sci. 2019. PMID: 30844110 Free PMC article.
-
Cytochalasin H enhances sensitivity to gefitinib in non-small-cell lung cancer cells through inhibiting EGFR activation and PD-L1 expression.Sci Rep. 2024 Oct 25;14(1):25276. doi: 10.1038/s41598-024-76060-2. Sci Rep. 2024. PMID: 39455693 Free PMC article.
-
Epidermal Growth Factor Receptor (EGFR) Pathway, Yes-Associated Protein (YAP) and the Regulation of Programmed Death-Ligand 1 (PD-L1) in Non-Small Cell Lung Cancer (NSCLC).Int J Mol Sci. 2019 Aug 5;20(15):3821. doi: 10.3390/ijms20153821. Int J Mol Sci. 2019. PMID: 31387256 Free PMC article. Review.
-
PD-L1 expression and EGFR status in advanced non-small-cell lung cancer patients receiving PD-1/PD-L1 inhibitors: a meta-analysis.Future Oncol. 2019 May;15(14):1667-1678. doi: 10.2217/fon-2018-0639. Epub 2019 May 1. Future Oncol. 2019. PMID: 31041879
Cited by
-
Analysis of a pan-cancer panel reveals the amino acid metabolism-related gene MTHFD1 as a potential prognostic and immunotherapeutic biomarker.Exp Ther Med. 2025 May 20;30(1):142. doi: 10.3892/etm.2025.12892. eCollection 2025 Jul. Exp Ther Med. 2025. PMID: 40462856 Free PMC article.
-
Cancer and neurotransmitter receptors.Chin Med J (Engl). 2025 Jul 5;138(13):1540-1558. doi: 10.1097/CM9.0000000000003656. Epub 2025 May 30. Chin Med J (Engl). 2025. PMID: 40456676 Free PMC article. Review.
References
-
- Siegel RL, Miller KD, Fuchs HE, Jemal A. Cancer statistics, 2021. CA Cancer J Clin. 2021;71(1):7–33. - PubMed
-
- Wang S, Sun T, Sun H, Li X, Li J, Zheng X, et al. Survival improvement in patients with non‐small cell lung cancer between 1983 and 2012: analysis of the surveillance, epidemiology, and end results database. Tumour Biol. 2017;39(5):1010428317691677. - PubMed
-
- Tan WL, Jain A, Takano A, Newell EW, Iyer NG, Lim WT, et al. Novel therapeutic targets on the horizon for lung cancer. Lancet Oncol. 2016;17(8):e347–e362. - PubMed
-
- Garau L, Govoni S, Stefanini E, Trabucchi M, Spano PF. Dopamine receptors: pharmacological and anatomical evidences indicate that two distinct dopamine receptor populations are present in rat striatum. Life Sci. 1978;23(17–18):1745–1750. - PubMed
MeSH terms
Substances
LinkOut - more resources
Full Text Sources
Medical
Molecular Biology Databases
Research Materials
Miscellaneous
