. 2024 Jun;15(3):919-933.
doi: 10.1002/jcsm.13454. Epub 2024 Apr 4.

Administration of adiponectin receptor agonist AdipoRon relieves cancer cachexia by mitigating inflammation in tumour-bearing mice

Affiliations

Administration of adiponectin receptor agonist AdipoRon relieves cancer cachexia by mitigating inflammation in tumour-bearing mice

Isabelle S Massart et al. J Cachexia Sarcopenia Muscle. 2024 Jun.

Abstract

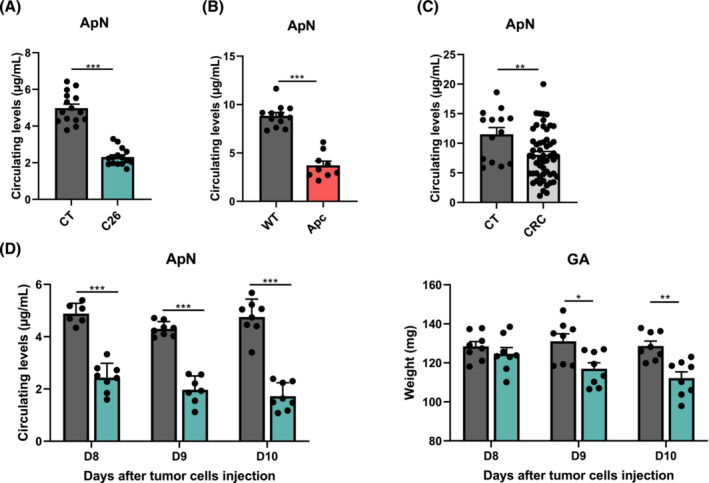
Background: Cancer cachexia is a life-threatening, inflammation-driven wasting syndrome that remains untreatable. Adiponectin, the most abundant adipokine, plays an important role in several metabolic processes as well as in inflammation modulation. Our aim was to test whether administration of AdipoRon (AR), a synthetic agonist of the adiponectin receptors, prevents the development of cancer cachexia and its related muscle atrophy.

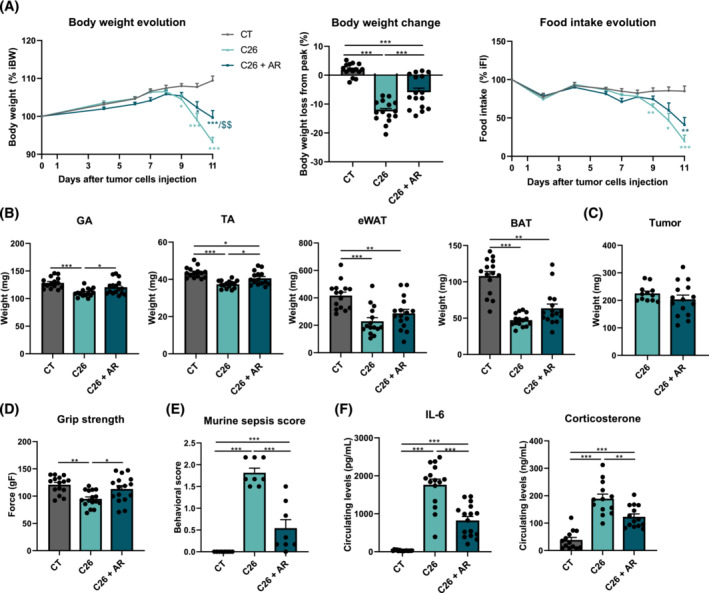
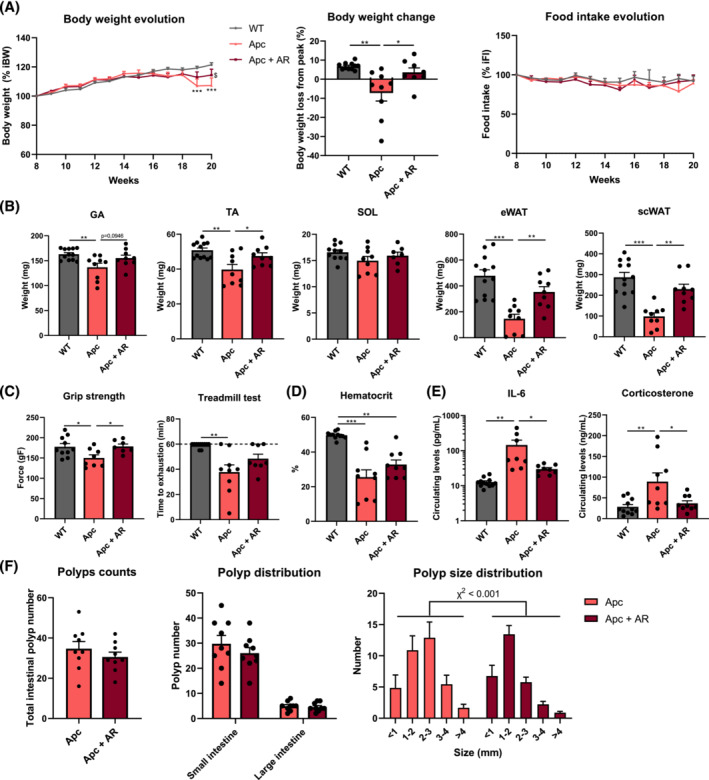
Methods: The effect of AR on cancer cachexia was investigated in two distinct murine models of colorectal cancer. First, 7-week-old CD2F1 male mice were subcutaneously injected with colon-26 carcinoma cells (C26) or vehicle (CT). Six days after injection, mice were treated for 5 days with AdipoRon (50 mg/kg/day; C26 + AR) or the corresponding vehicle (CT and C26). Additionally, a genetic model, the ApcMin/+ mouse, that develops spontaneously numerous intestinal polyps, was used. Eight-week-old male ApcMin/+ mice were treated with AdipoRon (50 mg/kg/day; Apc + AR) or the corresponding vehicle (Apc) over a period of 12 weeks, with C57BL/6J wild-type mice used as controls. In both models, several parameters were assessed in vivo: body weight, grip strength and serum parameters, as well as ex vivo: molecular changes in muscle, fat and liver.

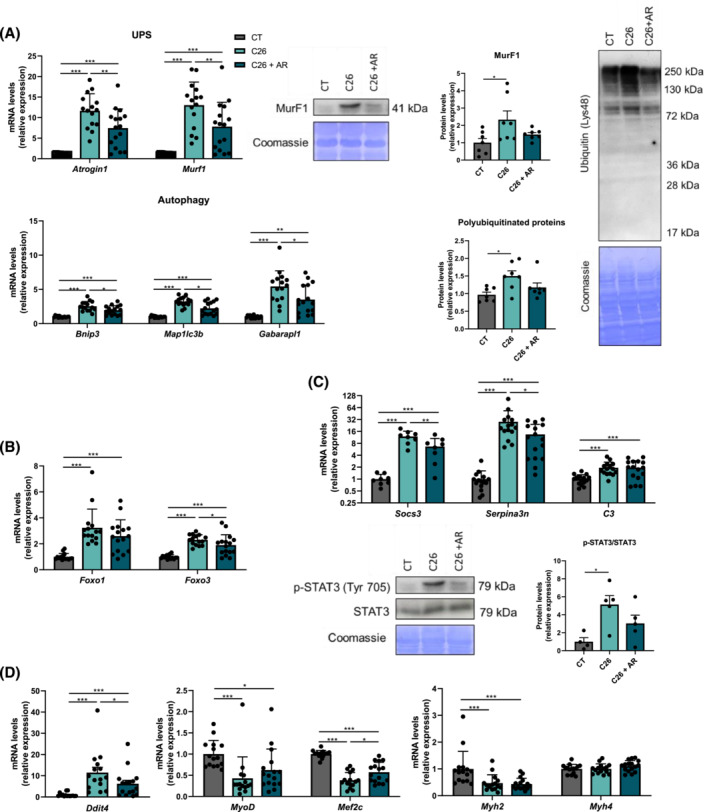
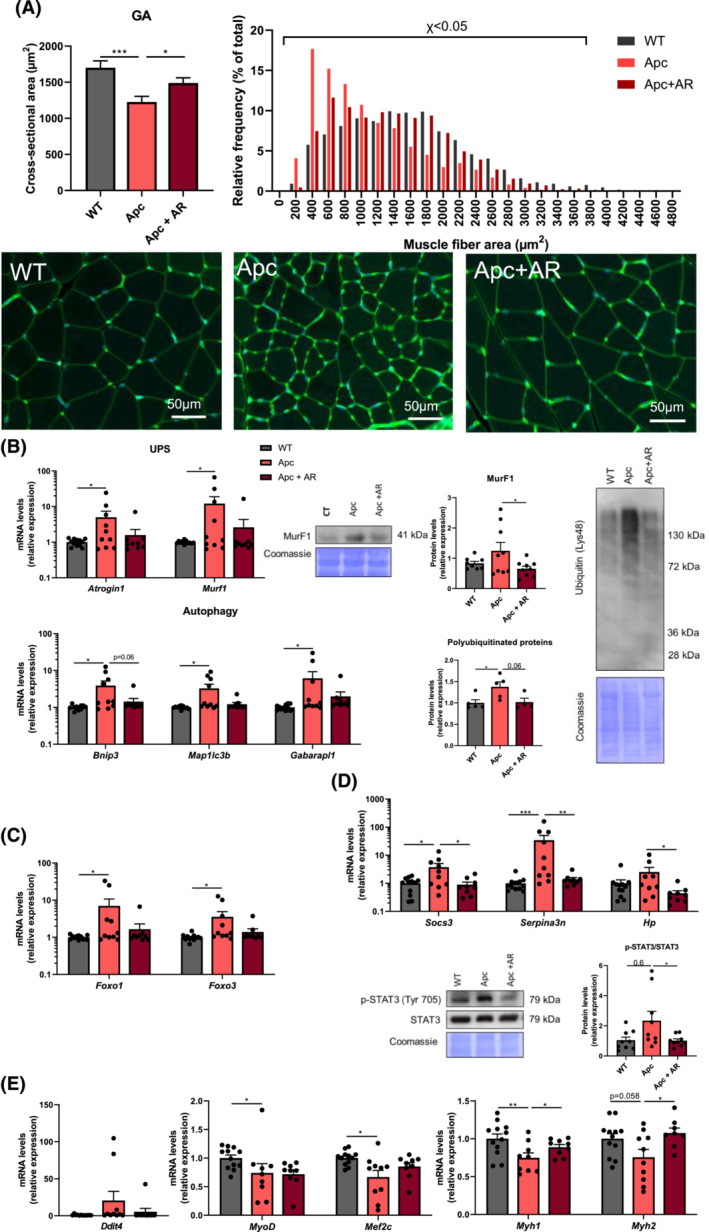
Results: The protective effect of AR on cachexia development was observed in both cachectic C26 and ApcMin/+ mice. In these mice, AR administration led to a significant alleviation of body weight loss and muscle wasting, together with rescued muscle strength (P < 0.05 for all). In both models, AR had a strong anti-inflammatory effect, reflected by lower systemic interleukin-6 levels (-55% vs. C26, P < 0.001 and -80% vs. Apc mice, P < 0.05), reduced muscular inflammation as indicated by lower levels of Socs3, phospho-STAT3 and Serpina3n, an acute phase reactant (P < 0.05 for all). In addition, AR blunted circulating levels of corticosterone (-46% vs. C26 mice, P < 0.001 and -60% vs. Apc mice, P < 0.05), the predominant murine glucocorticoid known to induce muscle atrophy. Accordingly, key glucocorticoid-responsive factors implicated in atrophy programmes were-or tended to be-significantly blunted in skeletal muscle by AR. Finally, AR protected against lipid metabolism alterations observed in ApcMin/+ mice, as it mitigated the increase in circulating triglyceride levels (-38%, P < 0.05) by attenuating hepatic triglyceride synthesis and fatty acid uptake by the liver.

Conclusions: Altogether, these results show that AdipoRon rescued the cachectic phenotype by alleviating body weight loss and muscle atrophy, along with restraining inflammation and hypercorticism in preclinical murine models. Therefore, AdipoRon could represent an innovative therapeutic strategy to counteract cancer cachexia.

Keywords: adiponectin; cachexia; cancer; inflammation; skeletal muscle.


Conflict of interest statement

The authors declare no conflict of interest.

Figures

Figure 1
Figure 1
Circulating levels of adiponectin are decreased in mice and in patients with colorectal cancer. (A) Serum adiponectin (ApN) levels in 8‐week‐old CD2F1 male mice injected with C26 colon‐26 carcinoma cells (C26) or corresponding vehicle (CT), 11 days after C26 cell injection (n = 15–16 per group). (B) Serum ApN levels in 20‐week‐old male Apc Min/+ mice (Apc) or wild‐type (WT) mice (n = 9–12 per group). (C) Plasma ApN levels in healthy subjects (CT) and colorectal cancer (CRC) patients (CT, n = 14; CRC, n = 54). (D) Evolution of serum ApN levels and gastrocnemius (GA) muscle weight (as previously reported in Thibaut et al. 19 ) in C26 mice or sham‐injected mice (CT) euthanized at 8, 9 and 10 days after C26 cell injection (n = 8 per group). Data are reported as mean ± SEM. Significant differences are indicated as *P < 0.05, **P < 0.01 and ***P < 0.001.
Figure 2
Figure 2
AdipoRon treatment counteracts cancer cachexia by alleviating body weight loss, muscle wasting and inflammation in C26 cachectic mice. Eight‐week‐old CD2F1 male mice were injected with C26 cells (C26) or a vehicle (CT). Six days after cancer cell injection, C26 mice were treated with AdipoRon (AR) intraperitoneally for 5 days (50 mg/kg/day, i.p.; C26 + AR) or corresponding vehicle for the two other groups (CT and C26). (A) Relative changes in body weight and food intake since cancer cell injection (expressed as percentage of initial value) and body weight change between Day 8 (body weight peak in C26 mice) and Day 11, in CT mice (CT), C26 mice (C26) and AR‐treated C26 mice (C26 + AR). (B) Tibialis anterior (TA) muscle, gastrocnemius (GA) muscle, epididymal white adipose tissue (eWAT) and brown adipose tissue (BAT) weights 11 days after cancer cell injection. (C) Tumour weight of C26 and AR‐treated C26 mice at Day 11 (n = 13–16 per group). (D) Grip strength (expressed in grams of force) at Day 11. (E) Sepsis score 10 days after cancer cell injection (n = 8 per group). (F) Serum IL‐6 and corticosterone levels at Day 11 (n = 13–16 per group). Data are reported as mean ± SEM (n = 15–16 per group, unless otherwise indicated). Significant differences are indicated as *P < 0.05, **P < 0.01 and ***P < 0.001, or $$ P < 0.01 versus C26.
Figure 3
Figure 3
AdipoRon treatment mitigates the muscle activation of the ubiquitin–proteasome system and autophagy in C26 cachectic mice. (A) Relative expression levels of the main genes involved in the ubiquitin–proteasome system (Atrogin1 and Murf1) and autophagy (Bnip3, Map 1lc3b and Gabarapl1) in the tibialis muscle (TA) of sham‐injected mice (CT), untreated C26 mice (C26) and AdipoRon‐injected C26 mice (C26 + AR) 11 days after cancer cell injection. MuRF1 and total poly‐ubiquitinated protein levels measured by western blotting in the skeletal muscle of mice from the three groups. Quantification of protein levels normalized to CT mice (n = 7 per group) and representative images. Coomassie blue staining was used as a loading control. (B) Relative gene expression levels of the glucocorticoid‐responsive transcription factors Foxo1 and Foxo3 in TA muscle. (C) Relative gene expression levels of Socs3 and acute phase reactants (Serpina3n and C3) in TA muscle. pSTAT3 and STAT3 protein levels measured by western blotting in the skeletal muscle of mice from the three groups. Quantification of pSTAT3/STAT3 protein ratio level normalized to CT mice (n = 4–5 per group) and representative images. Coomassie blue staining was used as a loading control. (D) Relative expression levels of genes involved in protein synthesis and/or myogenesis (Ddit4, MyoD, Mef2c, Myh2 and Myh4) in TA muscle. Atrogin1, F‐box only protein 32; Bnip3, BCL2/adenovirus E1B 19‐kDa protein‐interacting protein 3; C3, complement C3; Ddit4, DNA damage‐inducible transcript 4 protein; Foxo1, forkhead box protein O1; Foxo3, forkhead box protein O3; Gabarapl1, gamma‐aminobutyric acid receptor‐associated protein‐like 1; Map 1lc3b, microtubule‐associated proteins 1A/1B light chain 3B; Mef2c, myocyte‐specific enhancer factor 2C; Murf1, E3 ubiquitin‐protein ligase TRIM63; Myh2, myosin‐2; Myh4, myosin‐4; MyoD, myoblast determination protein; Serpina3n, serine protease inhibitor A3N; Socs3, suppressor of cytokine signalling 3. Data are reported as mean ± SEM (n = 15–16 per group, unless otherwise indicated). Significant differences are indicated as *P < 0.05, **P < 0.01 and ***P < 0.001.
Figure 4
Figure 4
AdipoRon treatment counteracts cancer cachexia by alleviating body weight loss, muscle and adipose tissue wasting and inflammation in Apc Min/+ cachectic mice. (A) Relative changes in body weight and food intake since Week 8 (expressed as percentage of initial value) and body weight change between Week 15 (body weight peak in Apc Min/+ mice) and Week 20 in C57BL/6J wild‐type (WT) mice, Apc Min/+ mice (Apc) and Apc Min/+ mice receiving AdipoRon (AR) in their water (Apc + AR). (B) Tibialis anterior (TA), gastrocnemius (GA), soleus (SOL) muscles, epididymal (eWAT) and subcutaneous (scWAT) white adipose tissue weights at 20 weeks. (C) Grip strength (expressed in grams of force) at 18 weeks and treadmill test at 15 weeks (n = 7–12 per group). The maximum test duration was set at 60 min. (D) Haematocrit levels at 20 weeks. (E) Circulating IL‐6 and corticosterone levels at 20 weeks (n = 8–12 per group). (F) Total intestinal polyp number in the small intestine and colon, polyp intestinal distribution and polyp size distribution of Apc and Apc + AR mice at 20 weeks (n = 9 per group). Data are reported as mean ± SEM (n = 9–12 per group, unless otherwise indicated). Significant differences are indicated as *P < 0.05, **P < 0.01 and ***P < 0.001, or $ P < 0.05 versus Apc.
Figure 5
Figure 5
AdipoRon treatment mitigates the muscle activation of the ubiquitin–proteasome system and autophagy in Apc Min/+ cachectic mice. (A) Mean cross‐sectional area of gastrocnemius (GA) muscle fibre and relative frequency distribution (percentage to total fibre number) of GA muscle fibre cross‐sectional area of C57BL/6J wild‐type (WT) mice, Apc Min/+ mice (Apc) and Apc Min/+ mice receiving AdipoRon in their water (Apc + AR) at 20 weeks. Representative images of GA muscle sections stained with rhodamine‐labelled WGA (wheat germ agglutinin) for each group are shown. Scale bar =  50 μm. (B) Relative expression levels of main genes involved in the ubiquitin–proteasome system (Atrogin1 and Murf1) and autophagy (Bnip3, Map 1lc3b and Gabarapl1) in GA muscle. MuRF1 and total poly‐ubiquitinated protein levels measured by western blotting in the skeletal muscle of mice from the three groups. Quantification of protein level normalized to WT mice (n = 4–9 per group) and representative images. Coomassie blue staining was used as a loading control. (C) Relative gene expression levels of the glucocorticoid‐responsive transcription factors Foxo1 and Foxo3 in GA muscle. (D) Relative gene expression levels of Socs3 and inflammatory acute phase reactant proteins (Serpina3n and Haptoglobin) in GA muscle. pSTAT3 and STAT3 protein levels measured by western blotting in the skeletal muscle of mice from the three groups. Quantification of pSTAT3/STAT3 protein ratio level normalized to CT mice (n = 9 per group) and representative images. Coomassie blue staining was used as a loading control. (E) Relative expression levels of genes involved in protein synthesis and/or myogenesis (Ddit4, MyoD, Mef2c and Myh1/2) in GA muscle. Atrogin1, F‐box only protein 32; Bnip3, BCL2/adenovirus E1B 19‐kDa protein‐interacting protein 3; Ddit4, DNA damage‐inducible transcript 4 protein; Foxo1, forkhead box protein O1; Foxo3, forkhead box protein O3; Gabarapl1, gamma‐aminobutyric acid receptor‐associated protein‐like 1; Hp, haptoglobin; Map 1lc3b, microtubule‐associated proteins 1A/1B light chain 3B; Mef2c, myocyte‐specific enhancer factor 2C; Murf1, E3 ubiquitin‐protein ligase TRIM63; Myh1, myosin‐1; Myh2, myosin‐2; MyoD, myoblast determination protein; Serpina3n, serine protease inhibitor A3N; Socs3, suppressor of cytokine signalling 3. Data are reported as mean ± SEM (n = 9–12 per group, unless otherwise indicated). Significant differences are indicated as *P < 0.05, **P < 0.01 and ***P < 0.001.
Figure 6
Figure 6
AdipoRon reverses lipid metabolism alterations in Apc Min/+ cachectic mice. (A) Mean cross‐sectional area of adipocytes in epididymal white adipose tissue (eWAT) and relative frequency distribution (percentage of total adipocyte number) of adipocytes cross‐sectional area in C57BL/6J wild‐type (WT) mice, Apc Min/+ mice (Apc) and Apc Min/+ mice receiving AdipoRon in their water (Apc + AR) at 20 weeks. Representative images of white adipose tissue sections stained with haematoxylin–eosin (HE) for each group are shown. Scale bar = 100 μm. (B) Subcutaneous white adipose tissue gene expression levels of enzymes involved in lipolysis (Pnpla2), de novo lipogenesis (Fasn) and browning (Ucp1). (C) Serum levels of total non‐esterified fatty acids (NEFAs), glycerol and triglycerides (TAG) (n = 7–12 per group). (D) Hepatic gene expression levels of enzymes involved in triglyceride synthesis (Gpat1 and Lpin1), de novo lipogenesis (Fasn), fatty acid uptake (Cd36), triglyceride hydrolysis (Lpl and Gpihbp1) and fatty acid β‐oxidation (Cpt1a). Cd36, platelet glycoprotein 4; Cpt1a, carnitine O‐palmitoyltransferase 1, liver isoform; Fasn, fatty acid synthase; Gpat1, glycerol‐3‐phosphate acyltransferase 1, mitochondrial; Gpihbp1, glycosylphosphatidylinositol‐anchored high‐density lipoprotein‐binding protein 1; Lpin1, phosphatidate phosphatase LPIN1; Lpl, lipoprotein lipase; Pnpla2, patatin‐like phospholipase domain‐containing protein 2; Ucp1, mitochondrial brown fat uncoupling protein 1. Data are reported as mean ± SEM (n = 9–12 per group, unless otherwise indicated). Significant differences are indicated as *P < 0.05, **P < 0.01 and ***P < 0.001.

Similar articles

Cited by

References

    1. Argiles JM, Busquets S, Stemmler B, Lopez‐Soriano FJ. Cancer cachexia: understanding the molecular basis. Nat Rev Cancer 2014;14:754–762. - PubMed
    1. Fearon KC, Glass DJ, Guttridge DC. Cancer cachexia: mediators, signaling, and metabolic pathways. Cell Metab 2012;16:153–166. - PubMed
    1. Loumaye A, de Barsy M, Nachit M, Lause P, van Maanen A, Trefois P, et al. Circulating Activin A predicts survival in cancer patients. J Cachexia Sarcopenia Muscle 2017;8:768–777. - PMC - PubMed
    1. Benny Klimek ME, Aydogdu T, Link MJ, Pons M, Koniaris LG, Zimmers TA. Acute inhibition of myostatin‐family proteins preserves skeletal muscle in mouse models of cancer cachexia. Biochem Biophys Res Commun 2010;391:1548–1554. - PubMed
    1. Zhou X, Wang JL, Lu J, Song Y, Kwak KS, Jiao Q, et al. Reversal of cancer cachexia and muscle wasting by ActRIIB antagonism leads to prolonged survival. Cell 2010;142:531–543. - PubMed