. 2024 Aug 1;109(8):2487-2499.
doi: 10.3324/haematol.2023.284619.

Mutual regulation of CD4+ T cells and intravascular fibrin in infections

Affiliations

Mutual regulation of CD4+ T cells and intravascular fibrin in infections

Tonina T Mueller et al. Haematologica. .

Abstract

Innate myeloid cells especially neutrophils and their extracellular traps are known to promote intravascular coagulation and thrombosis formation in infections and various other conditions. Innate myeloid cell-dependent fibrin formation can support systemic immunity while its dysregulation enhances the severity of infectious diseases. Less is known about the immune mechanisms preventing dysregulation of fibrin homeostasis in infection. During experimental systemic infections local fibrin deposits in the liver microcirculation cause rapid arrest of CD4+ T cells. Arrested T-helper cells mostly represent Th17 cells that partially originate from the small intestine. Intravascular fibrin deposits activate mouse and human CD4+ T cells which can be mediated by direct fibrin-CD4+ T-cell interactions. Activated CD4+ T cells suppress fibrin deposition and microvascular thrombosis by directly counteracting coagulation activation by neutrophils and classical monocytes. T-cell activation, which is initially triggered by IL-12p40- and MHC-II-dependent mechanisms, enhances intravascular fibrinolysis via LFA-1. Moreover, CD4+ T cells disfavor the association of the thrombin-activatable fibrinolysis inhibitor (TAFI) with fibrin whereby fibrin deposition is increased by TAFI in the absence but not in the presence of T cells. In human infections thrombosis development is inversely related to microvascular levels of CD4+ T cells. Thus, fibrin promotes LFA-1-dependent T-helper cell activation in infections which drives a negative feedback cycle that rapidly restricts intravascular fibrin and thrombosis development.


Figures

Figure 1.
Figure 1.
Microvascular recruitment of immune cells during systemic infection. (A) Identities and kinetics of arrested immune cells (1-6 hours [h]) in mice infected with E. coli (3-6 h) in the liver. (B) Unbiased DAVID cluster analysis of significant altered genes (adjusted P<0.05) in uninfected (0 h) and infected (3 h and 18 h) mice. Boxes indicate different mice. Dots refer to different visual fields (A) analyzed from 3-9 animals per group. In violin plots, box plots indicate 25th and 75th percentiles and median is marked by bold lines (A). P values were calculated by one-way ANOVA (A). *P<0.05, **P<0.01, ***P<0.001, ****P<0.0001.
Figure 2.
Figure 2.
CD4+ T cells express and attract major fibrinolysis regulators. (A) Heatmap showing mRNA expression levels of T-help-er cell genes implicated in negative regulation of coagulations of uninfected (0 hours [h]) or infected mice (3 h, 18 h). Boxes indicate different mice. (B) Associations of tissue factor (TF), uPA, uPAR, PLG and PAI-1 with arrested immune cells in mice infected with E. coli (3-6 h) in the liver (last graph showing percentage of myeloid cells and CD4+ T cells). Dots refer to different visual fields (B) analyzed from 3-6 animals per group. In violin plots, box plots indicate 25th and 75th percentiles and median is marked by bold lines (B). P values were calculated by one-way ANOVA (B). *P<0.05, **P<0.01, ***P<0.001, ****P<0.0001.
Figure 3.
Figure 3.
Suppression of intravascular fibrin and microvascular thrombosis by T-helper cells. (A-D) Representative images of liver microcirculation (A, left) and macrovasculature (C) and quantifications of microvascular fibrin deposition and microthrombi in the liver or lung (A, B, D) after infection with E. coli (A-C) or after infection with S. pneumoniae (D) in T-helper cell-depleted mice (αCD4, 1 hour [h] [A], 3 h [B, C], 6 h [D]). Values indicate intravascular fibrin-covered area as percentage of total intravascular area in the liver (A, B, D) or of intravascular fibrin-covered area per visual field in the lung (B, D). Dotted lines indicate vessel walls. Scale bar, 10 μm (A) or 20 μm (C). Dots refer to different visual fields (A) analyzed from 3 animals per group or the mean of at least 5 visual fields per animal (B, D). In violin plots, box plots indicate 25th and 75th percentiles and median is marked by bold lines (A). P values were calculated by unpaired two-tailed t test (A, B, D). *P<0.05, **P<0.01, ****P<0.0001. A405: optical density.
Figure 4.
Figure 4.
Thrombin-activatable fibrinolysis inhibitor increases fibrin deposition in absence of CD4+ T cells. (A) Plasmin formation by CD4+ T cells from uninfected and infected (3 hours [h]) mice. (B-D) Microvascular fibrin-rich area in liver microcirculation after αCD4 and αUPa treatment (B), thrombin-activatable fibrinolysis inhibitor (TAFI) neutralization (C) or CPI injection (D). (E) Association of TAFI with leukocytes (CD45+) and T-helper cells (CD45+ CD3+) 3 h after infection. (F) TAFI co-localization with CD4+ T cells (3 h, immunoglobulin G [IgG]) or other immune cell-rich thrombi (αCD4, 3 h). (G) Association of TAFI with fibrin deposits in vicinity of CD4+ T cells (control) or T-cell-free immune cell thrombi (CD4+ T-cell depletion). Dots indicate different animals (BE, G) or mean value from 3 independent samples (A). Data shown as means ± standard error of the mean. P values calculated by two-Way ANOVA (A, C) or unpaired two-tailed t test (B, D, E, G). P values calculated compared to control group (A). *P<0.05, **P<0.01, ***P<0.001, ****P<0.0001.
Figure 5.
Figure 5.
Fibrin critically drives arrest of T-helper cells. (A, B) CD4+ T cells or CD4+ RORγt+ cells (B) arrested in liver microvessels in f12-/- mice (6 hours [h]) (A) or plg-/- mice (3 h) (B) infected with E. coli. (C) Percentage of activated T-helper cells (defined as CD38+ or CD69+) in fibrin-negative (-) or fibrin-positive (+) areas (3 h). (D, E) T-helper cell activation in the liver microcirculation of rivaroxaban-treated wild-type (WT) mice (D) and f12-/- mice (3 h) (E). (F) Percentage of interferon (IFN)γ+ T-helper cells in rivaroxaban-treated mice. (G) Percentage of T-helper cell activation in mice treated with aMHC-II or aIL12p40-antibody prior to infection with E. coli (3 h). In violin plots, box plots indicate 25th and 75th percentiles and median is marked by bold lines (A, B). A minimum of 3 biological replicates was analyzed (A-G) and dots indicate different animals (C-G). Scale bar, 10 μm (C). Data shown as means ± standard error of the mean. P values calculated by unpaired two-tailed t test (A-G). *P<0.05, **P<0.01, **P<0.01.
Figure 6.
Figure 6.
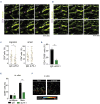
Fibrin activates T-helper cells via LFA-1. (A, B) Time lapse showing intravascular unidirectional (A) and back-forward (B) crawling of CMTPX-labeled CD4+ T cells (magenta) by multi-photon intravital imaging (1-6 hours [h], E. coli). Dragon tails visualize the last hundreds of cell movements. Scale bar, 10 μm. (C) Effect of aLFA-1 antibody on unidirectional migration and arrest of T-helper cells in the liver microcirculation analyzed by multi-photon intravital imaging (1-6 h). (D) Percentages of activated CD4+ T cells arrested in microvessels after treatment with aLFA-1 antibody (3 h). (E) Effect of aLFA-1 antibody on activation of isolated human CD4+ T cells in vitro on poly-L-ornithine- or fibrin-coated surfaces. (L) Migration of isolated human CD4+ T cells on fibrin- versus poly-L-ornithine-coated surfaces. Lines indicate covered distance by single cells. Speed of cell movements is color coded. Dots indicate different animals (D), different videos (C) analyzed in at least 3 animals per group, or isolated cells from different donors (E). Scale bar, 10 μm (A, B) or 20 μm (F). Data shown as means ± standard error of the mean. P values calculated by Mann-Whitney test (C), unpaired two-tailed t test (D) or two-way ANOVA (E). *P<0.05, **P<0.01.
Figure 7.
Figure 7.
Thrombosis development in human infections is negatively associated with T-cell arrest. (A, B) CD4+ T cells in pulmonary vessels with diameter <50 μm (A) or 50-500 μm (B) in patients with SARS-CoV- 2 or influenza virus infections in post-mortem histological analysis of human lung samples with pulmonary infections. (C) Representative image of thrombus in pulmonary vessels of a patients with severe influenza virus (left) or SARS-CoV-2 infection (right). Scale bar, 20 μm. (D) Association of thrombin-activatable fibrinolysis inhibitor (TAFI) with leukocyte-free thrombi during SARS-CoV-2 infection. (E) Correlation between pulmonary thrombosis and intravascular T-helper cells. Scale bar, 20 μm. Dots indicate different patients (A, B, E). Values given as mean ± standard error of the mean. P values calculated by unpaired two-tailed t test (A, B) or Pearson’ correlation with 95% confidence interval (E). **P<0.01, ***P<0.001.

References

    1. Iba T, Levy JH. Inflammation and thrombosis: roles of neutrophils, platelets and endothelial cells and their interactions in thrombus formation during sepsis. J Thromb Haemost. 2018;16(2):231-241. - PubMed
    1. Van Bruggen S, Martinod K. The coming of age of neutrophil extracellular traps in thrombosis: where are we now and where are we headed? Immunol Rev. 2023;314(1):376-398. - PubMed
    1. Wu C, Lu W, Zhang Y, et al. . Inflammasome activation triggers blood clotting and host death through pyroptosis. Immunity. 2019;50(6):1401-1411. - PMC - PubMed
    1. Engelmann B, Massberg S. Thrombosis as an intravascular effector of innate immunity. Nat Rev Immunol. 2013;13(1):34-45. - PubMed
    1. Opal SM, Esmon CT. Bench-to-bedside review: functional relationships between coagulation and the innate immune response and their respective roles in the pathogenesis of sepsis. Crit Care. 2002;7(1):23-38. - PMC - PubMed

Publication types

LinkOut - more resources