. 2024 Apr;14(4):e1628.
doi: 10.1002/ctm2.1628.

m6A-dependent upregulation of DDX21 by super-enhancer-driven IGF2BP2 and IGF2BP3 facilitates progression of acute myeloid leukaemia

Affiliations

m6A-dependent upregulation of DDX21 by super-enhancer-driven IGF2BP2 and IGF2BP3 facilitates progression of acute myeloid leukaemia

Yanchun Zhao et al. Clin Transl Med. 2024 Apr.

Abstract

Background: Acute myeloid leukaemia (AML) is a haematological malignancy with unfavourable prognosis. Despite the effectiveness of chemotherapy and targeted therapy, relapse or drug resistance remains a major threat to AML patients. N6-methyladenosine (m6A) RNA methylation and super-enhancers (SEs) are extensively involved in the leukaemogenesis of AML. However, the potential relationship between m6A and SEs in AML has not been elaborated.

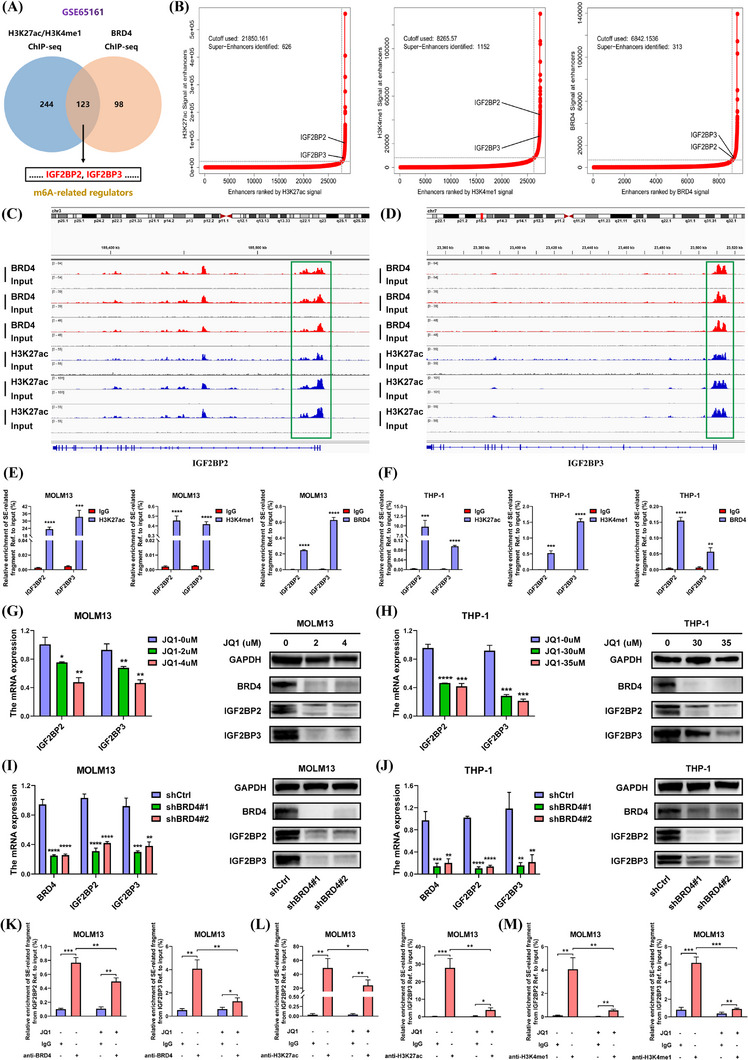
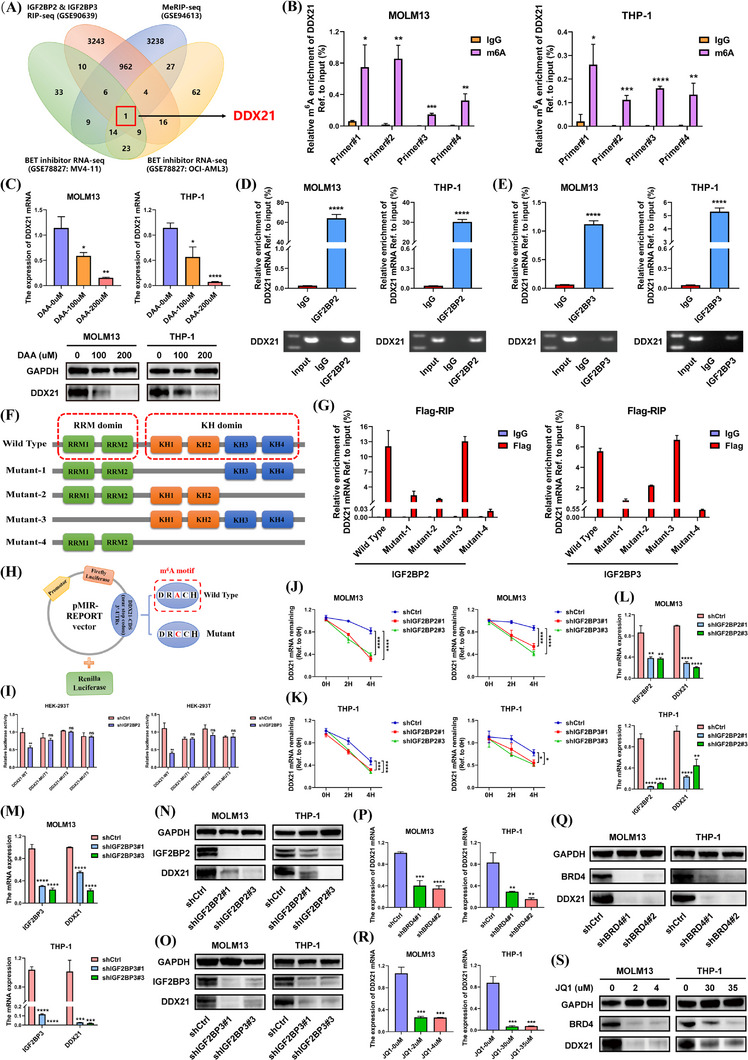
Methods: Chromatin immunoprecipitation (ChIP) sequencing data from Gene Expression Omnibus (GEO) cohort were analysed to search SE-related genes. The mechanisms of m6 A-binding proteins IGF2BP2 and IGF2BP3 on DDX21 were explored via methylated RNA immunoprecipitation (MeRIP) assays, RNA immunoprecipitation (RIP) assays and luciferase reporter assays. Then we elucidated the roles of DDX21 in AML through functional assays in vitro and in vivo. Finally, co-immunoprecipitation (Co-IP) assays, RNA sequencing and ChIP assays were performed to investigate the downstream mechanisms of DDX21.

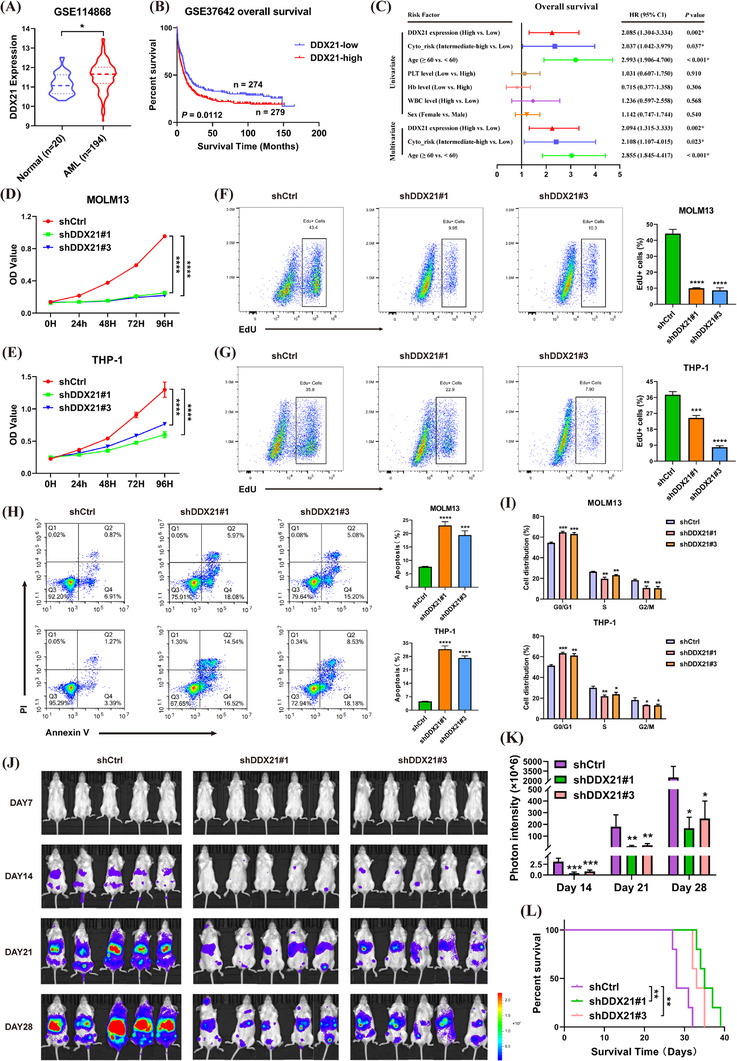
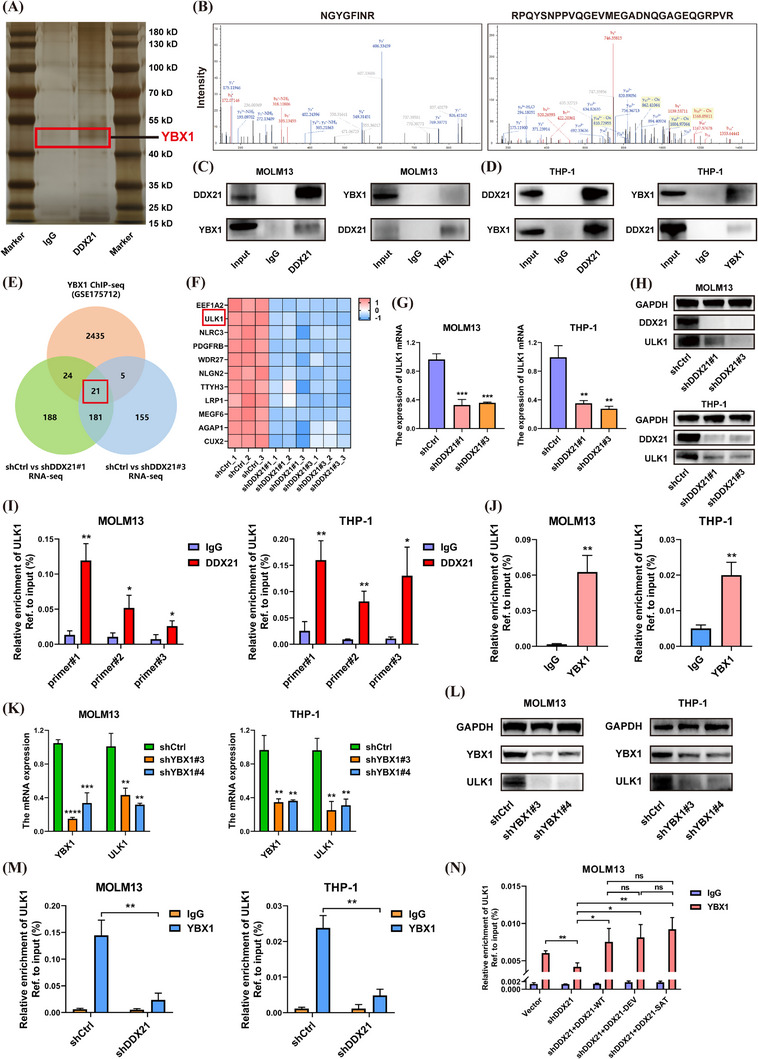
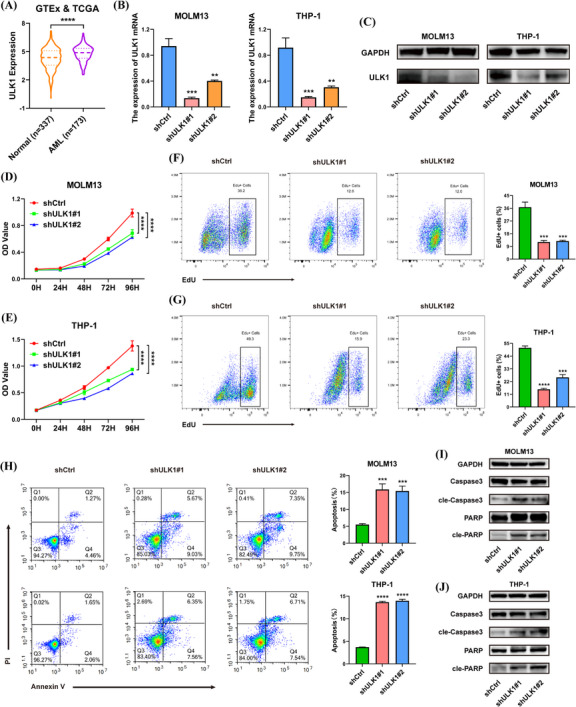
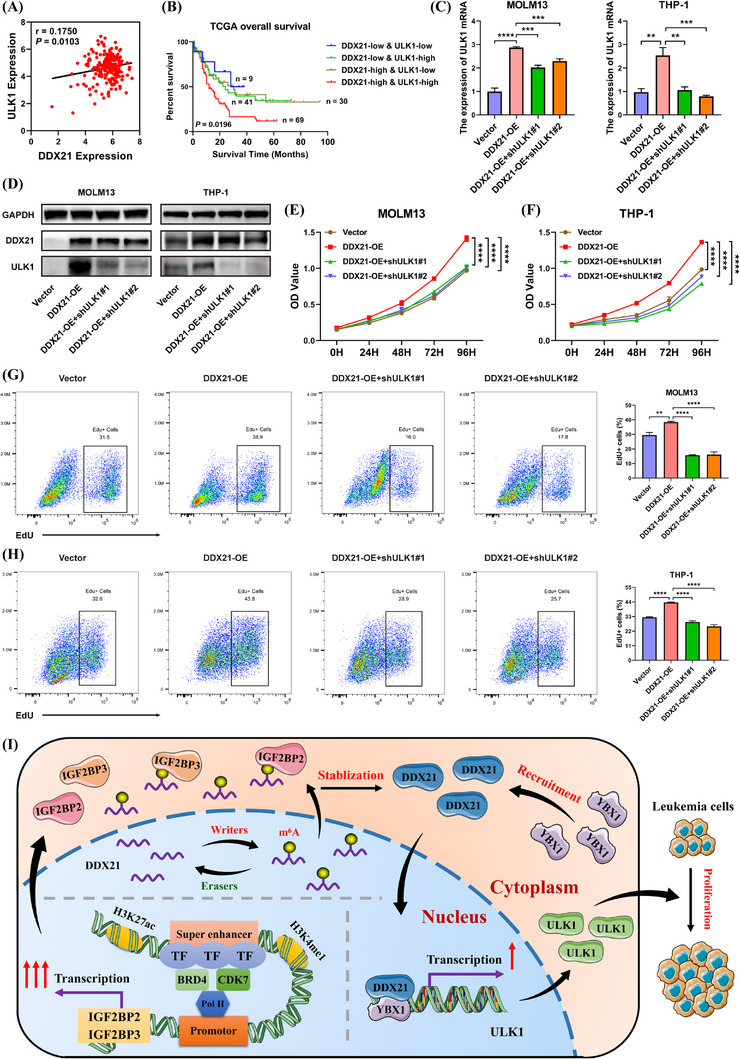
Results: We identified two SE-associated transcripts IGF2BP2 and IGF2BP3 in AML. High enrichment of H3K27ac, H3K4me1 and BRD4 was observed in IGF2BP2 and IGF2BP3, whose expression were driven by SE machinery. Then IGF2BP2 and IGF2BP3 enhanced the stability of DDX21 mRNA in an m6A-dependent manner. DDX21 was highly expressed in AML patients, which indicated a poor survival. Functionally, knockdown of DDX21 inhibited cell proliferation, promoted cell apoptosis and led to cell cycle arrest. Mechanistically, DDX21 recruited transcription factor YBX1 to cooperatively trigger ULK1 expression. Moreover, silencing of ULK1 could reverse the promoting effects of DDX21 overexpression in AML cells.

Conclusions: Dysregulation of SE-IGF2BP2/IGF2BP3-DDX21 axis facilitated the progression of AML. Our findings provide new insights into the link between SEs and m6A modification, elucidate the regulatory mechanisms of IGF2BP2 and IGF2BP3 on DDX21, and reveal the underlying roles of DDX21 in AML.

Keywords: DDX21; N6‐methyladenosine (m6A); acute myeloid leukaemia (AML); super‐enhancers (SEs).


Conflict of interest statement

The authors declare they have no conflicts of interest.

Figures

FIGURE 1
FIGURE 1
SEs participated in the regulation of IGF2BP2 and IGF2BP3. (A) A Venn diagram was generated to present the SE‐associated genes based on the ChIP‐seq data of H3K27ac, H3K4me1 and BRD4 in MOLM14 cells (GSE65161). Two m6A readers, IGF2BP2 and IGF2BP3, were found at the intersection. (B) Hockey stick plots depicted the rank order of enhancers based on H3K27ac (left), H3K4me1 (middle) and BRD4 (right) signals (GSE65161). SEs were defined as the enhancers that were located above the inflection point of curve, thus IGF2BP2 and IGF2BP3 were considered as two SE‐related genes. (C and D) Integrative Genomics Viewer (IGV) tracks of BRD4 and H3K27ac signals displayed the SE regions on IGF2BP2 (C) and IGF2BP3 (D) where peaks were notably enriched compared with the input. (E and F) ChIP‐qPCR assays were performed in MOLM13 (E) and THP‐1 (F) cells to confirm the enrichment of H3K27ac, H3K4me1 and BRD4 on IGF2BP2 and IGF2BP3. (G and H) RNA (left) and protein (right) levels of IGF2BP2 and IGF2BP3 were detected after the treatment of JQ1. (I and J) The inhibitory effects of BRD4 knockdown on the expression of IGF2BP2 and IGF2BP3 were assessed by RT‐qPCR (left) and Western blotting (right) assays. (K–M). MOLM13 cells were treated with or without JQ1 for 24 h. ChIP assays with antibodies against BRD4 (K), H3K27ac (L) or H3K4me1 (M) were performed, respectively. The alterations of BRD4, H3K27ac and H3K4me1 enrichment on IGF2BP2 and IGF2BP3 after JQ1 treatment were assessed by subsequent qPCR assays (*p < .05, **p < .01, ***p < .001, ****p < .0001).
FIGURE 2
FIGURE 2
m6A‐modified DDX21 was modulated by SE‐driven IGF2BP2 and IGF2BP3. (A) A Venn diagram based on three GEO datasets was employed to explore the possible downstream transcripts of IGF2BP2 and IGF2BP3. The data were obtained from IGF2BP2/IGF2BP3 RIP‐seq in HEK‐293T cells (GSE90639), MeRIP‐seq in MOLM13 cells (GSE94613) and BET inhibitor RNA‐seq in MV4‐11 and OCI‐AML3 cells (GSE78827). In GSE78827, RNA‐seq data of AML cells treated with DMSO or JQ1 were selected to identify the transcripts suppressed by JQ1 (p < .05 and FC < .5). (B) MeRIP assays with m6A‐specific antibodies were performed to determine the m6A abundance on DDX21. Relative m6A enrichment was obtained by comparing m6A‐IP/input with IgG‐IP/input. (C) MOLM13 and THP‐1 cells were treated with DAA in different concentrations (0, 100 and 200 µM, respectively). The alterations of DDX21 expression were detected. (D and E) The binding of IGF2BP2 (D) or IGF2BP3 (E) to DDX21 was identified by RIP assays. Results of RT‐qPCR and DNA gel electrophoresis assays are exhibited. (F) As the schematic illustration shows, four truncation mutants (M1–4) and one wild‐type (WT) plasmid with flag‐tag were constructed for IGF2BP2 and IGF2BP3, respectively. (G) Above plasmids were separately transfected into HEK‐293T cells. RIP assays with IgG or flag antibodies were performed to determine the domains binding to DDX21. (H) The m6A sites of DDX21 were predicted to be mainly located at the CDS near stop codon and 3′UTRs according to the m6A motif DRACH. In mutant plasmid, adenosine (A) bases in possible m6A sites were replaced by cytosine (C) bases. (I) These plasmids mentioned above were transfected into HEK‐293T cells whose IGF2BP2 or IGF2BP3 was stably knocked down, respectively. Following luciferase reporter assays were carried out. (J and K) The impacts of IGF2BP2 or IGF2BP3 on DDX21 stability were investigated via RNA decay assays with actinomycin D. (L–O) The expression of DDX21 was measured when IGF2BP2 or IGF2BP3 was suppressed. (P–S) After the loss of BRD4 (P and Q) or the treatment of JQ1 (R and S), DDX21 expression was examined (*p < .05, **p < .01, ***p < .001, ****p < .0001).
FIGURE 3
FIGURE 3
Inhibition of DDX21 suppressed the proliferation and promoted the apoptosis of AML cells. (A) The expression of DDX21 was compared between normal (n = 20) and AML (n = 194) patients from the GEO cohort (GSE114868). (B) The Kaplan–Meier survival analysis was performed in AML patients based on the expression of DDX21 from the GEO cohort (GSE37642). (C) Forest plots based upon the outcomes of COX univariate and multivariate analysis of several factors associated with OS in AML patients from TCGA database. (D and E) The proliferation abilities of MOLM13 (D) and THP‐1 (E) cells were assessed by CCK‐8 assays when DDX21 was silenced. (F and G) EdU assays were performed followed by flow cytometric analysis to assess the changes in DNA replication capabilities of cells after DDX21 was repressed (left). The bar charts show the percentages of EdU‐positive cells (right). (H) AML cells with DDX21 knockdown or not were stained with Annexin V and propidium iodide (PI), and subsequently subjected to flow cytometric analysis for apoptosis measurement (left). The percentages of apoptotic cells (Annexin V+) were calculated and exhibited in the bar charts (right). (I) The results of changes in cell cycle after DDX21 knockdown are shown. (J–L) Luciferase‐labelled THP‐1 cells were transfected with DDX21 deficiency (sh1 and sh3) or negative control lentivirus, and then implanted into immunodeficient mice via tail vein injection (n = 5 for each group). The tumour load in each group of mice was monitored by IVIS at Days 7, 14, 21 and 28 (J). The photon intensities were calculated and shown in the bar chart (K). The survival of mice was evaluated by Kaplan–Meier analysis (L) (*p < .05, **p < .01, ***p < .001, ****p < .0001).
FIGURE 4
FIGURE 4
YBX1 was recruited by DDX21 to impel the transcription of ULK1. (A and B) Co‐IP assays were conducted with DDX21 and IgG antibodies, followed by the silver staining assays (A). The gels with differential staining between these two groups were applied to MS analysis, which identified two unique peptides of YBX1 (B). (C and D) Reciprocal Co‐IP assays with either DDX21 or YBX1 antibody were employed to determine whether DDX21 could interact with YBX1. (E) RNA‐seq was carried out using MOLM13 cells with DDX21 knockdown or negative control. The genes that were downregulated when DDX21 was silenced were selected for subsequent investigation (average FPKM in negative control group > 1, FC < .5, q < .05). Results of ChIP‐seq in GSE175713 identified the transcripts bound by YBX1. Then a Venn diagram was generated based on these two datasets. There were 21 genes in the overlap. (F) This heatmap depicted the relative expression of 11 candidate transcripts between negative control and DDX21‐knockdown groups according to our RNA‐seq data. ULK1 was one of the differential genes. (G and H) The effects of DDX21 on ULK1 expression were verified via RT‐qPCR and Western blotting assays (I and J) ChIP‐qPCR assays were applied to substantiate the occupancy of DDX21 (I) or YBX1 (J) on ULK1. Relative enrichment was normalised to the input. (K and L) The expression of ULK1 was examined when YBX1 was deficient. (M) To investigate the effects of DDX21 on YBX1‐mediated transcriptional activation, ChIP‐qPCR assays were utilised to measure the enrichment of YBX1 on the promoter of ULK1 when DDX21 was silenced or not. (N) Enrichment of YBX1 on ULK1 promoter was determined when mutated DDX21 plasmids were transfected into DDX21‐silenced cells (*p < .05, **p < .01, ***p < .001, ****p < .0001).
FIGURE 5
FIGURE 5
ULK1 was involved in regulating the proliferation and apoptosis of AML cells. (A) The comparison of ULK1 expression between normal (n = 337) and AML (n = 173) patients was performed based on GTEx and TCGA databases. (B and C) The efficiency of ULK1 silencing was examined in RNA (B) and protein (C) levels. (D and E) CCK‐8 assays were conducted to evaluate the impacts of ULK1 knockdown on cell growth. (F and G) When ULK1 was deficient in MOLM13 (F) and THP‐1 (G) cells, DNA replication capabilities were assessed via EdU assays. (H) The apoptosis of AML cells was measured via flow cytometric analysis after the inhibition of ULK1. (I and J) Western blotting assays detected the changes in expression of apoptosis‐associated proteins (*p < .05, **p < .01, ***p < .001, ****p < .0001).
FIGURE 6
FIGURE 6
ULK1 suppression reversed the malignant phenotypes induced by DDX21 overexpression. (A) The correlation between DDX21 and ULK1 expression was analysed using TCGA datasets. (B) The survival analysis was conducted in AML patients based on the co‐expression of DDX21 and ULK1 from TCGA datasets. (C and D) The rescue efficiency was validated by RT‐qPCR (C) and Western blotting (D) assays. (E and F) The proliferation of AML cells transfected with empty vector, DDX21‐overexpression and DDX21‐overexpression/ULK1‐knockdown lentivirus was assessed by CCK‐8 assays. (G and H) EdU assays were conducted in the rescue models above (left), and the bar chart shows the DNA duplication abilities of each group (right). (I) A schematic diagram presents the mechanisms that SE‐driven IGF2BP2 and IGF2BP3 trigger the stabilisation of m6A‐modified DDX21, which recruits YBX1 to further activate the transcription of ULK1, facilitating the malignancy of AML (*p < .05, **p < .01, ***p < .001, ****p < .0001).

Similar articles

Cited by

References

    1. Lowenberg B, Downing J, Burnett A. Acute myeloid leukemia. N Engl J Med. 1999;341:1051‐1062. - PubMed
    1. Juliusson G, Antunovic P, Derolf A, et al. Age and acute myeloid leukemia: real world data on decision to treat and outcomes from the Swedish Acute Leukemia Registry. Blood. 2009;113:4179‐4187. - PubMed
    1. Döhner H, Wei A, Löwenberg B. Towards precision medicine for AML. Nat Rev Clin Oncol. 2021;18:577‐590. - PubMed
    1. Shallis RM, Wang R, Davidoff A, et al. Epidemiology of acute myeloid leukemia: recent progress and enduring challenges. Blood Rev. 2019;36:70‐87. - PubMed
    1. Ding Y, Gao H, Zhang Q. The biomarkers of leukemia stem cells in acute myeloid leukemia. Stem Cell Invest. 2017;4:19. - PMC - PubMed

Publication types