. 2024 May 8;52(8):4702-4722.
doi: 10.1093/nar/gkae229.

Protein G-quadruplex interactions and their effects on phase transitions and protein aggregation

Affiliations

Protein G-quadruplex interactions and their effects on phase transitions and protein aggregation

Bikash R Sahoo et al. Nucleic Acids Res. .

Abstract

The SERF family of proteins were originally discovered for their ability to accelerate amyloid formation. Znf706 is an uncharacterized protein whose N-terminus is homologous to SERF proteins. We show here that human Znf706 can promote protein aggregation and amyloid formation. Unexpectedly, Znf706 specifically interacts with stable, non-canonical nucleic acid structures known as G-quadruplexes. G-quadruplexes can affect gene regulation and suppress protein aggregation; however, it is unknown if and how these two activities are linked. We find Znf706 binds preferentially to parallel G-quadruplexes with low micromolar affinity, primarily using its N-terminus, and upon interaction, its dynamics are constrained. G-quadruplex binding suppresses Znf706's ability to promote protein aggregation. Znf706 in conjunction with G-quadruplexes therefore may play a role in regulating protein folding. RNAseq analysis shows that Znf706 depletion specifically impacts the mRNA abundance of genes that are predicted to contain high G-quadruplex density. Our studies give insight into how proteins and G-quadruplexes interact, and how these interactions affect both partners and lead to the modulation of protein aggregation and cellular mRNA levels. These observations suggest that the SERF family of proteins, in conjunction with G-quadruplexes, may have a broader role in regulating protein folding and gene expression than previously appreciated.


Figures

Graphical Abstract
Graphical Abstract
Figure 1.
Figure 1.
Znf706 is partially disordered and binds G-quadruplexes. (A) Schematic diagram showing that Znf706’s domain organization includes a conserved N-terminal low-complexity domain, colored in blue (residues 2–36) that is homologous to the SERF family and a single C2H2 type zinc-finger domain that is shown in red (residues 39–62). The DNA binding specificity of this zinc finger was predicted using the interactive PWM predictor to be GGGG, with the first residues of the motif more favored to be G than the latter ones. (B) De novo structures of full-length (1–76) and Znf706 (39–76) generated by CS-ROSETTA using Cα, Cβ, CO, N, and NH NMR chemical shifts. Superimposed zinc-coordinated structures of Znf706 models were generated using HADDOCK. Cartoon structures of the CS-ROSETTA model of the human Znf706 zinc-finger domain in cyan superimposed with the solution NMR model structure of C2H2 type Miz-1 (yellow) zinc finger domain-12 (PDB ID: 7MC3). (C) 1D 1H NMR spectra showing signals of imino protons involved in Watson–Crick base pairs, with no significant change in the chemical shift observed in the presence of Znf706. This indicates no interactions between a G-rich (GGA) hairpin DNA (200 μM) and increasing concentrations of Znf706, at the indicated molar excesses of DNA relative to Znf706. (D) Competitive NMR titration measurements probing the binding specificity of Znf706 to G-quadruplexes and duplexes containing the same sequence of Bcl2SH and its complementary strand as listed in Table 1. The arrows indicate peaks showing substantial chemical shift changes upon Znf706 binding to the Bcl2SH G-quadruplex and the duplex mixture. The inset shows an enlarged image of the region of the Bcl2SH G-quadruplex imino protons (∼10.4–11.5 ppm) showing chemical shift changes. No substantial chemical shifts were observed in the Watson–Crick base pair regions (∼12.5–14 ppm) indicating that Znf706 binds exclusively to the G-quadruplex structures of the Bcl2SH sequence. All 1D NMR samples were prepared in 20 mM phosphate buffer containing 100 mM KCl and 7.5% D2O (pH 7.4).
Figure 2.
Figure 2.
Znf706 displays thermal stability and binds more tightly to well folded G-quadruplexes. (A, B) FP binding assay with Znf706 and 5′ 6-FAM labeled G-quadruplexes prepared in 20 mM NaPi, 100 mM KCl, pH 7.4 (A) or 20 mM Tris–HCl, 100 mM LiCl, pH 7.4 (B). The indicated Kd values are calculated by non-linear regression analysis and one site binding saturation model in GraphPad Prism at an increasing concentration of Znf706 (4 nM to 130 μM for (A) and 32 nM to 1.04 mM (B)). Error bars represent standard deviations derived from three replicates. (C) Secondary structure analysis of Znf706 (50 μM), in the absence (solid circles) or presence of 20 × molar excess of EDTA (open circles), studied using Circular dichroism (CD) spectroscopy recorded at different temperatures as indicated. (D) CD melting curves of 20 μM cMyc G-quadruplex, in the absence (blue, Tm= 38.67 ± 0.51°C) or presence of equimolar (green, Tm= 47.70 ± 0.52°C) or 5× molar excess (red, Tm = 48.88 ± 0.33°C) of Znf706, dissolved in 20 mM NaPi, 4 mM KCl, pH 7.4. The CD molar ellipticity at 264 nm, as a function of temperature, was normalized to generate the melting curves, and the CD melting temperatures (Tm) were calculated by fitting the fraction folding curves in the Origin program and the arrow indicates the change in Tm.
Figure 3.
Figure 3.
NMR-guided structural and dynamic studies showing cMyc G-quadruplex binding induces conformational rigidity in the N-terminal SERF domain of Znf706. (A) 1D proton NMR spectra recorded at 37°C showing the imino proton chemical shifts in cMyc G-quadruplex (200 μM), in the absence (blue) and presence of an increasing concentration of Znf706 (10–400 μM) dissolved in 20 mM NaPi, 100 mM KCl, pH 7.4. The G-imino peaks showing significant chemical shift changes at sub-stoichiometric protein concentration are marked with dashed lines and asterisks. (B) A high-resolution structure of cMyc (PDB ID: 2LBY) with the nucleotides likely involved in the binding with Znf706 and/or undergo conformational alteration upon Znf706 binding obtained from Figure 3A and Supplementary Figure S14 are indicated by arrows (G3, G12, G14, G16, G18, and T19). A, T, and G nucleotides are shown in red, orange, and cyan, respectively. (C) Heteronuclear NOE measurement of 200 μM 15N Znf706, in the absence (red) and presence (green) of 100 μM cMyc, showing the induction of structural rigidity in Znf706’s N-terminal upon cMyc binding. Standard errors are estimated from the signal-to-noise ratios. (D) R2/R1 relaxation ratios of 200 μM Znf706 in the absence (red) and presence (green) of 100 μM cMyc G-quadruplex. The heteronuclear NOE and relaxation NMR experiments were done on a Bruker 600 MHz at 4°C in 20 mM NaPi, 100 mM KCl, pH 7.4 buffer containing 7.5% D2O.
Figure 4.
Figure 4.
15N/1H heteronuclear and PRE NMR studies show that Znf706’s N-terminal SERF predominantly binds to G-quadruplex and its C-terminal zinc-finger domain facilitates complex formation. (A, B)15N/1H 2D correlation spectrum of 100 μM uniformly 15N labeled Znf706 dissolved in 20 mM NaPi, 100 mM KCl, pH 7.4 in the absence (red) and presence of 50 μM (green) cMyc (A) and Bcl2WT G-quadruplexes (B). The non-proline backbone amide resonances were assigned using a series of 3D NMR experiments that include HNCA, HNCACB, CBCA(CO)NH, HNCO, and HNCOCA and 2D 15N- and 13C-HSQC. (C, D) Plots showing chemical shift perturbations (CSPs) derived from the 15N/1H 2D spectrum of 100 μM Znf706 titrated with variable concentrations of cMyc (C) and Bcl2WT (D) G-quadruplexes as indicated in colors. The CSPs were calculated using the equation formula image and the dashed lines indicate the average CSPs in each group. (E–G) Signal intensity ratio of amide protons observed for 100 μM 15N Znf706 A2C-MTSL (E), Znf706 A2C-NEM (F) mixed with 50 μM cMyc G-quadruplex. The intramolecular PRE effects at N-terminus are shaded in pink, whereas cMyc binding-induced PRE effects are highlighted in yellow. (G) Monitoring the paramagnetic effect upon cMyc binding to 50 μM 15N Znf706 A2C-MTSL at the indicated concentration. The final titrated product containing 50 μM Znf706 and 20 μM cMyc was reduced for ∼3 h following the acquisition of the diamagnetic spectrum. NMR spectra were collected either on a Bruker 800 or 600 MHz spectrometer at 4°C for samples dissolved in 20 mM NaPi, 100 mM KCl, pH 7.4 buffer containing 7.5% D2O. Standard errors were estimated from the signal-to-noise ratios.
Figure 5.
Figure 5.
Znf706 binding to G-quadruplex forming DNA oligonucleotides induces liquid-liquid phase transition under physiological salt conditions. (A, B) Regime diagrams illustrating the effect of Znf706 and G-quadruplex (1:1) on droplet formation (black: no droplets, orange: droplets) at the indicated concentration (A) and variable salt concentrations with equimolar (100 μM) Znf706 and G-quadruplex (B) on droplet formation. Sample solutions were incubated overnight before imaging. (C) Fluorescence images of Znf706-Bcl2WT droplets prepared in 20 mM NaPi, 20 mM KCl, pH 7.4. The sample mixtures were prepared at room temperature by incubating 100 μM Znf706, 1 μM AF488-Znf706 (green signals), and 100 μM Bcl2WT. Droplet formation was confirmed by differential interference contrast (DIC) imaging, followed by the addition of 5 μM NMM to visualize Bcl2WT G-quadruplexes (red signals). (D) Monitoring droplet formation of 100 μM Znf706 mixed with an equimolar amount of topologically distinct G-quadruplexes as indicated. (E) FRAP analysis of Znf706 droplets formed in the presence of equimolar Znf706 and G-quadruplex (100 μM) reveals a long recovery suggesting slow Znf706 dynamics. Fluorescence images retrieved before FRAP, right after FRAP (0 sec), and at increasing diffusion times are shown. (F–H) Znf706 and G-quadruplex droplets were half-bleached and the normalized FRAP recovery plots are shown for Znf706 droplets formed in the presence of cMyc (F), Bcl2WT (G) and polyG (H). G-quadruplexes were fitted to a one-phase association curve in GraphPad Prism to obtain the recovery half times (t1/2) which are indicated in the figures. Errors represent standard deviations of measurements derived from four droplets in each sample. (I–K) Determination of Znf706 and G-quadruplex complex size using analytical ultracentrifugation (AUC). eGFP-Znf706 (12.2 μM, predicted molecular weight 35.5 kDa) dissolved in 20 mM NaPi, 100 mM KCl, pH 7.4 (I) was incubated with equimolar cMyc (J) or Bcl2WT (K) G-quadruplexes for ∼1 h before AUC measurement (absorbance 488 nm). AUC data were analyzed in Ultrascan and a 2D plot of frictional ratio f/f0 versus sedimentation coefficient ‘S’ are shown with an indicated estimated molecular weight as shown by arrows. The partial concentration represented by color intensity in the z-dimension represents the abundance of each species.
Figure 6.
Figure 6.
Znf706 co-localizes with DNA G-quadruplexes and its depletion alters gene expression in vivo. (A) Formaldehyde fixed HEK 293T cells were immunolabeled and counterstained with DAPI, anti-Znf706, and anti-DNA G-quadruplex binding specific antibodies, clone 1H6, at the indicated colors. A zoomed single cell, with an inset highlighting the Znf706 and DNA G-quadruplex colocalization (yellow signals), is shown. (B) The degree of Znf706 and G-quadruplex colocalization was calculated by quantifying the red and green fluorescence signal intensities across a straight line drawn along a selected cell, as shown in zoom using ImageJ. The scale bar represents 10 μm. (C, D) Volcano plots of RNA-seq differential expression analysis in Znf706 knockdown HeLa (C) and HEK 293T (D) cells, compared to a control knockdown. The genes with a minimal fold change in gene expression levels are represented within the dashed vertical lines. Znf706 depletion down- and up-regulates 458 and 696 genes in HeLa, and 294 and 405 genes in HEK 293T cells, respectively, and are indicated on the left and right side in the volcano plots. (E, F) Violin plots of observed G-quadruplex density of annotated genes from Znf706 knockdown RNA-seq in HeLa (E) and in HEK 293T (F) cells. A similar analysis was done to generate a violin plot for the relationship between G-quadruplex density and genes affected by a DHX36 knockout in HEK 293 cells (G), using the data obtained from work done by Chambers et al. (21).
Figure 7.
Figure 7.
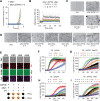
G-quadruplex binding suppresses the aggregation activity of Znf706. (A) Monitoring the aggregation kinetics of 100 μM α-Synuclein (aSyn) dissolved in 20 mM NaPi, 100 mM KCl, pH 7.4 mixed, without (blue) or with 100 μM Znf706 (gold), by ThT fluorescence. Aggregation of aSyn in a sample containing equimolar Znf706 and cMyc G-quadruplexes is not shown and carried out in the absence of ThT. (B) Light scattering of aSyn aggregates (10 μl of aSyn aggregates dissolved in 1590 μl buffer) taken at time ∼6 h at the indicated Znf706 and cMyc concentrations. (C) TEM images of aSyn aggregates (10 μl) taken at time ∼6 h mixed with or without Znf706 and cMyc G-quadruplex as indicated. (D) TEM images of 50 μM aSyn aggregates taken at time ∼48 h (see methods) mixed with the indicated concentration of Znf706 and cMyc G-quadruplexes. The scale bar is 200 nm. (E) Evaluation of the effect of aSyn (100 μM) on Znf706 and G-quadruplex LLPT in 20 mM NaPi, 100 mM KCl, pH 7.4 without crowding agents (-PEG) and 20 mM NaPi, 150 mM KCl, 10% PEG8000, pH 7.4 (+PEG). For fluorescent imaging, 0.5 μM of AF488 labeled aSyn A90C and Cy5 labeled Znf706 A2C are mixed with 100 μM of unlabeled proteins. Droplet formation was confirmed by DIC imaging followed by the addition of 5 μM NMM, to visualize G-quadruplexes (red signals). A phase diagram for aSyn, Znf706, and G-quadruplex mixtures in ±PEG8000 is shown in the lower panel (see also DIC images in Supporting Figure 32). (F–I) Thermal aggregation of 300 nM citrate synthase (CS) was monitored using light-scattering mixed without (blue) or with an increasing concentration of Znf706 (F) or Seq576 G-quadruplexes (H) as indicated. A competitive thermal aggregation assay presenting the effect of an increasing concentration of Seq576 (G) and cMyc (I) G-quadruplexes on 300 nM CS mixed with 150 nM of Znf706. The thermal aggregation experiments were performed at 48°C in 40 mM HEPES–KOH, pH 7.5.

Update of

References

    1. Dyson H.J., Wright P.E.. Intrinsically unstructured proteins and their functions. Nat. Rev. Mol. Cell Biol. 2005; 6:197–208. - PubMed
    1. Bannen R.M., Bingman C.A., Phillips G.N.. Effect of low-complexity regions on protein structure determination. J. Struct. Funct. Genomics. 2007; 8:217–226. - PubMed
    1. Kumari B., Kumar R., Chauhan V., Kumar M.. Comparative functional analysis of proteins containing low-complexity predicted amyloid regions. PeerJ. 2018; 6:e5823. - PMC - PubMed
    1. Michelitsch M.D., Weissman J.S.. A census of glutamineasparagine-rich regions: implications for their conserved function and the prediction of novel prions. Proc. Natl. Acad. Sci. U.S.A. 2000; 97:11910–11915. - PMC - PubMed
    1. Lee M., Ghosh U., Thurber K.R., Kato M., Tycko R.. Molecular structure and interactions within amyloid-like fibrils formed by a low-complexity protein sequence from FUS. Nat. Commun. 2020; 11:5735. - PMC - PubMed

Publication types