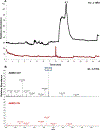
Suppressing the background of LC-ESI-MS analysis of permethylated glycans using the active background ion reduction device
- PMID: 38573014
- PMCID: PMC11438568
- DOI: 10.1002/elps.202300301
Suppressing the background of LC-ESI-MS analysis of permethylated glycans using the active background ion reduction device
Abstract
Mass spectrometry (MS) has revolutionized analytical chemistry, enabling precise identification and quantification of chemical species, which is pivotal for biomarker discovery and understanding complex biological systems. Despite its versatility, the presence of background ions in MS analysis hinders the sensitive detection of low-abundance analytes. Therefore, studies aimed at lowering background ion levels have become increasingly important. Here, we utilized the commercially available Active Background Ion Reduction Device (ABIRD) to suppress background ions and assess its effect on the liquid chromatography-electrospray ionization (LC-ESI)-MS analyses of N-glycans on the Q Exactive HF mass spectrometer. We also investigated the effect of different solvent vapors in the ESI source on N-glycan analysis by MS. ABIRD generally had no effect on high-mannose and neutral structures but reduced the intensity of some structures that contained sialic acid, fucose, or both when methanol vapor filled the ESI source. Based on our findings on the highest number of identified N-glycans from human serum, methanol vapor in the ion source compartment may enhance N-glycan LC-ESI-MS analyses by improving the desolvation of droplets formed during the ESI process due to its high volatility. This protocol may be further validated and extended to advanced bottom-up proteomic/glycoproteomic studies for the analysis of peptide/glycopeptide ions by MS.
Keywords: ABIRD; LC–ESI–MS; N‐glycans; background ion reduction; glycomics.
© 2024 Wiley‐VCH GmbH.
Conflict of interest statement
Conflict of interest statement
The authors have declared no conflict of interest.
Figures


 , N-acetylglucosamine (GlcNAc);
  , Galactose (Gal);
  , Fucose (Fuc);
  , Mannose (Man);
  , Glucose (Glc);
  , N-acetylneuraminic acid (NeuAc/Sialic Acid).
Similar articles
-
4-plex quantitative glycoproteomics using glycan/protein-stable isotope labeling in cell culture.J Proteomics. 2025 Jan 6;310:105333. doi: 10.1016/j.jprot.2024.105333. Epub 2024 Oct 18. J Proteomics. 2025. PMID: 39426592
-
Prescription of Controlled Substances: Benefits and Risks.2025 Jul 6. In: StatPearls [Internet]. Treasure Island (FL): StatPearls Publishing; 2025 Jan–. 2025 Jul 6. In: StatPearls [Internet]. Treasure Island (FL): StatPearls Publishing; 2025 Jan–. PMID: 30726003 Free Books & Documents.
-
[Fast determination of per- and polyfluoroalkyl substances in human serum by cold-induced phase separation coupled with liquid chromatography-tandem mass spectrometry].Se Pu. 2025 Jul;43(7):756-766. doi: 10.3724/SP.J.1123.2024.11028. Se Pu. 2025. PMID: 40610770 Free PMC article. Chinese.
-
Diagnostic test accuracy and cost-effectiveness of tests for codeletion of chromosomal arms 1p and 19q in people with glioma.Cochrane Database Syst Rev. 2022 Mar 2;3(3):CD013387. doi: 10.1002/14651858.CD013387.pub2. Cochrane Database Syst Rev. 2022. PMID: 35233774 Free PMC article.
-
Signs and symptoms to determine if a patient presenting in primary care or hospital outpatient settings has COVID-19.Cochrane Database Syst Rev. 2022 May 20;5(5):CD013665. doi: 10.1002/14651858.CD013665.pub3. Cochrane Database Syst Rev. 2022. PMID: 35593186 Free PMC article.
Cited by
-
Protein pellet sample preparation for the analysis of N-glycans of therapeutic proteins.Anal Bioanal Chem. 2025 Aug;417(20):4505-4511. doi: 10.1007/s00216-025-05995-w. Epub 2025 Jul 8. Anal Bioanal Chem. 2025. PMID: 40628978
References
-
- Daramola O, Gutierrez-Reyes CD, Wang J, Nwaiwu J, Onigbinde S, Fowowe M, et al. Isomeric separation of native N-glycans using nano zwitterionic- hydrophilic interaction liquid chromatography column. J Chromatogr A. 2023;1705:464198. - PubMed
MeSH terms
Substances
Grants and funding
LinkOut - more resources
Full Text Sources
Research Materials
Miscellaneous

