. 2024 May;51(5):3245-3264.
doi: 10.1002/mp.17041. Epub 2024 Apr 4.

Fully automatic online geometric calibration for non-circular cone-beam CT orbits using fiducials with unknown placement

Affiliations

Fully automatic online geometric calibration for non-circular cone-beam CT orbits using fiducials with unknown placement

Yiqun Q Ma et al. Med Phys. 2024 May.

Abstract

Background: Cone-beam CT (CBCT) with non-circular scanning orbits can improve image quality for 3D intraoperative image guidance. However, geometric calibration of such scans can be challenging. Existing methods typically require a prior image, specialized phantoms, presumed repeatable orbits, or long computation time.

Purpose: We propose a novel fully automatic online geometric calibration algorithm that does not require prior knowledge of fiducial configuration. The algorithm is fast, accurate, and can accommodate arbitrary scanning orbits and fiducial configurations.

Methods: The algorithm uses an automatic initialization process to eliminate human intervention in fiducial localization and an iterative refinement process to ensure robustness and accuracy. We provide a detailed explanation and implementation of the proposed algorithm. Physical experiments on a lab test bench and a clinical robotic C-arm scanner were conducted to evaluate spatial resolution performance and robustness under realistic constraints.

Results: Qualitative and quantitative results from the physical experiments demonstrate high accuracy, efficiency, and robustness of the proposed method. The spatial resolution performance matched that of our existing benchmark method, which used a 3D-2D registration-based geometric calibration algorithm.

Conclusions: We have demonstrated an automatic online geometric calibration method that delivers high spatial resolution and robustness performance. This methodology enables arbitrary scan trajectories and should facilitate translation of such acquisition methods in a clinical setting.

Keywords: CBCT; C‐arm; fiducial configuration; geometric calibration; image quality; interventional imaging; quality control; task‐driven imaging.


Conflict of interest statement

CONFLICT OF INTEREST STATEMENT

The author declares no conflicts of interest.

Figures

FIGURE A1
FIGURE A1
Examples demonstrating operations in the initial fiducial localization process. (a) Line integral image. (b) Line integral image after background subtraction. (c) Mask made from (b) by morphological erosion and dilation. (d) Gaussian-filtered line integrals with mask applied. (e) Canny edge detection within masked regions. (f) Circle detection on edge image.
FIGURE A2
FIGURE A2
Examples demonstrating operations in the fiducial labeling process. (a) U-V coordinates of fiducial centroids from initial fiducial extraction, each point representing one fiducial in one frame. (b) U-V coordinates sorted by nearest neighbors into traces of individual fiducials. (c) U-V coordinates of long traces differentiated by color. 40 long traces are identified in this example. (d) Mean virtual intersections from each long trace. Each asterisk corresponds to a single long trace. Asterisks in the same black circles correspond to the same distinct fiducial and are combined. In this example of 40 long traces, 10 distinct fiducials are identified. (e) U-V coordinates of the combined long traces. 10 distinct colors represent the 10 distinct fiducials.
FIGURE A3
FIGURE A3
Examples demonstrating operations in the iterative refinement process. (a) Example ROIs centered at the U-V coordinates in the long traces or at predicted fiducial centroids during iterative refinement. The dot and the “1” represent one fiducial localized with sub-pixel precision on the ROI. (b) U-V coordinates of updated centroids localized from ROIs with sub-pixel precision. (c) Two example ROIs with very different confidence weights. The left ROI shows high background attenuation and low fiducial contrast, resulting in a low weight for calibration. The right ROI conversely has a high confidence weight. (d) Example violin plots of RPE. ROI, regions of interest; RPE, reprojection error.
FIGURE 1
FIGURE 1
Flowchart outlining the automatic online calibration algorithm. Gray boxes are image processing operations. Yellow boxes are circle/fiducial detection operations. Blue boxes are geometry and coordinate estimation-related operations.
FIGURE 2
FIGURE 2
Diagrams of backprojections of fiducial centroids under accurate geometry and inaccurate geometry and the concepts of virtual intersection and 3D RPE. The x-ray source travels on the surface of an imaginary sphere with a fixed isocenter at the center of the mesh spheres. RPE, reprojection error.
FIGURE 3
FIGURE 3
Spine-and-wire phantom design. (a) 0.127 mm diameter tungsten wire cast in plastic resin. (b) Top view of a 3D-printed cervical spine phantom in a clear plastic container with the tungsten wire cast in the spinal canal. Also visible are fiducials under blue tape used in early experiments. (c)–(d) Side views of the water- and plastic spheres-filled phantom. The fiducials are replaced with commercial stainless steel skin markers, with (c) showing the spiral configuration and (d) showing the double-ring configuration. (e)–(f) Diagrams of the fiducial configurations. Fiducials are numbered and connected by lines to help visualize the spiral and ring configuration styles.
FIGURE 4
FIGURE 4
Setup of test bench experiments. (a) Physical setup of the test bench with a diagram of the axes. (b) Diagram of the motion error-free version of the scanning orbits. (c)–(d) Diagrams of the translational and rotational motion errors, respectively, added to the error-free sinusoidal orbit. Motion errors for the multi-arc orbit are in a similar fashion and not shown.
FIGURE 5
FIGURE 5
(a) Setup at the Siemens Artis Zeego scanner with the resolution phantom. The phantom is laid on its side on a foam holder. (b) Diagram of the designed scanning orbits.
FIGURE 6
FIGURE 6
(a) Photo of the anthropomorphic head and thorax phantom on the patient table of the Siemens Artis Zeego scanner. Pieces of blue masking tape mark the locations of 10 manually placed fiducials. (b) Diagram of the orbits when performed on the robotic C-arm, as recorded from projection headers, including circular and non-circular orbits.
FIGURE 7
FIGURE 7
Example resolution phantom results from a test bench scan using the sinusoidal orbit, spiral fiducial configuration, 1x nominal motion errors, and the proposed calibration method. (a) Violin plot showing the RPEn from the geometric calibration process. Each blue dot represents the RPEn for a frame. The horizontal blue line indicates the mean. The white dot indicates the median. (b) An axial slice near the center of the phantom. Display window [min max] = [0 0.04]. (c) An axial slice using MR-MBIR with 0.02 mm isotropic voxels centered at the tungsten wire with overlaying contour map. Display window [min max] = [0 0.3]. MR-MBIR, multiresolution model-based iterative reconstruction; RPE, reprojection error.
FIGURE 8
FIGURE 8
MTF and F20 results from the test bench experiments. (a) MTF curves from all orbits, fiducial configurations, motion error levels, and calibration methods. The dotted line represents the response of a circular 0.127 wire, which was divided from the measured MTFs. (b) Plots F20 values at different amplitudes of motion error. Experiments are encoded using a combination of line style, color, and marker style. The circular scans are plotted as horizontal dotted lines to serve as a baseline with no motion error. MTF, modulation transfer function.
FIGURE 9
FIGURE 9
Results from the Siemens Zeego resolution experiments. (a)–(c) Diagrams of the three selected representative four-fiducial configurations. The four selected fiducials are marked as solid black disks and connected to form tetrahedrons. (d)–(n) PSFs and contours with their respective F20. Experiments are differentiated by underlined labels on the rows and columns. (o) Plot of d2D vs voltet values from all four-fiducial configurations. (p)–(s) Example axial and sagittal slices of reconstructions using the calibration from the worst four-fiducial configuration and the reference calibration. (p) and (q) correspond to PSF (h). (r) and (s) correspond to PSF (n). Three axial slices are averaged to reduce noise. PSF, point spread function.
FIGURE 10
FIGURE 10
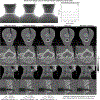
Results of the anthropomorphic phantom using the circular orbit. (a)–(c) Tetrahedron diagrams of selected four-fiducial configurations. Brighter and darker spheres indicate fiducials on the ventral and dorsal surfaces of the phantom, respectively. (d) Plot showing the tracked fiducials in each frame. Un-tracked fiducials are shown as discontinuities in the horizontal lines. (e)–(x) Axial and sagittal slices of the C4 vertebra from MR-MBIR using different calibration results. The voxel sizes for lower-resolution and higher-resolution images are 0.5 and 0.1 mm, respectively. The ROIs of the higher-resolution images are marked as dark blue rectangles in the lower-resolution images. The d2D, voltet, and number of frames with only three fiducials tracked are marked under (t)–(v). No slice averaging was applied. MR-MBIR, multiresolution model-based iterative reconstruction; ROIs, regions of interest.
FIGURE 11
FIGURE 11
Results of the anthropomorphic phantom using the multi-arc orbit. (a)–(c) Tetrahedron diagrams of selected four-fiducial configurations. Brighter and darker spheres indicate fiducials on the ventral and dorsal surfaces of the phantom, respectively. (d) Plot showing the tracked fiducials in each frame. Un-tracked fiducials are shown as discontinuities in the horizontal lines. (e)–(x) Axial and sagittal slices of the C4 vertebra from MR-MBIR using different calibration results. The voxel sizes for lower-resolution and higher-resolution images are 0.5 and 0.1 mm, respectively. The ROIs of the higher-resolution images are marked as dark blue rectangles in the lower-resolution images. The d2D, voltet, and number of frames with only three fiducials tracked are marked under (t)–(v). To reduce image noise, three and seven slices were averaged for the lower- and higher-resolution images, respectively. MR-MBIR, multiresolution model-based iterative reconstruction; ROIs, regions of interest.

Similar articles

Cited by

References

    1. Leschka SC, Babic D, El Shikh S, Wossmann C, Schumacher M, Taschner CA. C-arm cone beam computed tomography needle path overlay for image-guided procedures of the spine and pelvis. Neuroradiology. 2012;54:215–223. - PubMed
    1. Orth RC, Wallace MJ, Kuo MD, Technology Assessment Committee of the Society of Interventional Radiology. C-arm cone-beam CT: general principles and technical considerations for use in interventional radiology. J Vasc Interv Radiol.2008;19(6):814–820. - PubMed
    1. Siewerdsen JH. Cone-beam CT with a flat-panel detector: from image science to image-guided surgery. Nucl Instrum Methods Phys Res. Section A, Accelerators, spectrometers, detectors and associated equipment. 2011;648(Suppl 1):S241. - PMC - PubMed
    1. Ujiie H, Effat A, Yasufuku K. Image-guided thoracic surgery in the hybrid operation room. J Vis Surg. 2017;3:148. - PMC - PubMed
    1. Abi-Jaoudeh N, Fisher T, Jacobus J, et al. Prospective randomized trial for image-guided biopsy using cone-beam CT navigation compared with conventional CT. J Vasc Interv Radiol: JVIR. 2016;27:1342–1349. - PMC - PubMed

LinkOut - more resources