. 2024 Apr 4;9(9):e174127.
doi: 10.1172/jci.insight.174127.

Proteomics identifies complement protein signatures in patients with alcohol-associated hepatitis

Affiliations

Proteomics identifies complement protein signatures in patients with alcohol-associated hepatitis

Moyinoluwa Taiwo et al. JCI Insight. .

Abstract

Diagnostic challenges continue to impede development of effective therapies for successful management of alcohol-associated hepatitis (AH), creating an unmet need to identify noninvasive biomarkers for AH. In murine models, complement contributes to ethanol-induced liver injury. Therefore, we hypothesized that complement proteins could be rational diagnostic/prognostic biomarkers in AH. Here, we performed a comparative analysis of data derived from human hepatic and serum proteome to identify and characterize complement protein signatures in severe AH (sAH). The quantity of multiple complement proteins was perturbed in liver and serum proteome of patients with sAH. Multiple complement proteins differentiated patients with sAH from those with alcohol cirrhosis (AC) or alcohol use disorder (AUD) and healthy controls (HCs). Serum collectin 11 and C1q binding protein were strongly associated with sAH and exhibited good discriminatory performance among patients with sAH, AC, or AUD and HCs. Furthermore, complement component receptor 1-like protein was negatively associated with pro-inflammatory cytokines. Additionally, lower serum MBL associated serine protease 1 and coagulation factor II independently predicted 90-day mortality. In summary, meta-analysis of proteomic profiles from liver and circulation revealed complement protein signatures of sAH, highlighting a complex perturbation of complement and identifying potential diagnostic and prognostic biomarkers for patients with sAH.

Keywords: Complement; Diagnostics; Hepatitis; Hepatology.


Conflict of interest statement

Conflict of interest: The authors have declared that no conflict of interest exists.

Figures

Figure 1
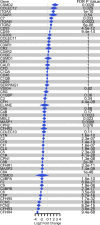
Figure 1. Complement protein plot of summarized log2 fold-change for sAH versus HC of 3 different bulk RNA-Seq data sets.
Bonferroni FDR-adjusted P value < 0.05 is statistically significant.
Figure 2
Figure 2. Validation of top upregulated complement proteins in liver and serum proteome of patients with sAH.
(A) Western blot and ImageJ (NIH) quantification of CD59 expression in HC (n = 5) and sAH (n = 5) liver explants (validation cohort 1). Unpaired 2-tailed t test. (B) ELISA measurement of COLEC11 concentration in HCs (n = 23) and patients with sAH (n = 109) (validation cohort 2). Box-and-whisker plots show minimum and maximum values, lower and upper quartiles, and median, with each individual value represented as a point superimposed on the graph. Mann-Whitney U test. *P < 0.05, ****P < 0.0001.
Figure 3
Figure 3. Circulating complement proteins are associated with 90-day mortality in patients with sAH.
Serum relative concentration of complement proteins that (A) decreased and (B) increased in patients with sAH who died at 90 days. sAH-90d Alive, n = 7; sAH-90d Dead, n = 11 (test cohort 2). *P < 0.05, **P < 0.01 (Benjamini-Hochberg FDR-adjusted P value). (C) Point biserial correlation matrix of serum complement proteins associated with sAH 90-day mortality (Death). Correlation coefficients (r) are given within the blocks with blue and red blocks for positive and negative association, respectively. (D) Receiver operating characteristic (ROC) curves show area under curve (AUC) for MASP1 and F2, potential predictors of 90-day mortality, and MELD. (E) Plasma concentrations of F2 in alive (n = 51) and dead (n = 35) (validation cohort 3). Unpaired 2-tailed t test. ****P < 0.0001. (F) ROC curves show AUC for F2 and MELD. Box-and-whisker plots show minimum and maximum values, lower and upper quartiles, and median, with each individual value represented as a point superimposed on the graph.
Figure 4
Figure 4. Top discriminatory complement proteins in liver proteome of patients with sAH.
(A) Liver protein expression of the top 5 discriminatory complement proteins in HCs and patients with sAH (test cohort 1). Box-and-whisker plots show minimum and maximum values, lower and upper quartiles, and median, with each individual value represented as a point superimposed on the graph (n = 3–12). *P < 0.05, **P < 0.01, ****P < 0.0001 (Benjamini-Hochberg FDR-adjusted P value). (B) ROC curves show AUC of the top 5 discriminatory complement proteins distinguishing patients with sAH from HCs.
Figure 5
Figure 5. Complement protein dysregulation in serum proteome of patients with AUD and sAH (test cohort 2).
(A) Serum relative concentration of select complement proteins in HC (n = 6), AUD (n = 20), and sAH (n = 18). Box-and-whisker plots show minimum and maximum values, lower and upper quartiles, and median, with each individual value represented as a point superimposed on the graph. Values with different superscripts are significantly different, P < 0.05. One-way ANOVA.ROC curves show AUC distinguishing patients with sAH from (B) HCs and (C) patients with AUD.
Figure 6
Figure 6. Complement protein changes from HC in patients with sAH and AC.
(A) Serum relative concentration in HC (n = 6), sAH (n = 18), and AC (n = 13) (test cohort 2). (B) ROC curves show AUC of the top 4 discriminatory serum complement proteins distinguishing patients with sAH from AC. (CE) MASP1, F2, and COLEC11 plasma concentrations, respectively, in HC (n = 21–25), sAH (n = 91–109), and AC (n = 15–17) (validation cohorts 2 and 3). Box-and-whisker plots show minimum and maximum values, lower and upper quartiles, and median, with each individual value represented as a point superimposed on the graph. Values with different superscripts are significantly different, P < 0.05. One-way ANOVA.

References

    1. Chaudhry H, et al. Alcohol-related hepatitis: a review article. World J Gastroenterol. 2023;29(17):2551–2570. doi: 10.3748/wjg.v29.i17.2551. - DOI - PMC - PubMed
    1. Singal AK, et al. Grand rounds: alcoholic hepatitis. J Hepatol. 2018;69(2):534–543. doi: 10.1016/j.jhep.2018.05.001. - DOI - PMC - PubMed
    1. Lucey MR, et al. Alcoholic hepatitis. N Engl J Med. 2009;360(26):2758–2769. doi: 10.1056/NEJMra0805786. - DOI - PubMed
    1. Singal AK, Mathurin P. Diagnosis and treatment of alcohol-associated liver disease: a review. JAMA. 2021;326(2):165–176. doi: 10.1001/jama.2021.7683. - DOI - PubMed
    1. Serste T, et al. The prognostic value of acute-on-chronic liver failure during the course of severe alcoholic hepatitis. J Hepatol. 2018;69(2):318–324. doi: 10.1016/j.jhep.2018.02.022. - DOI - PubMed

Publication types