. 2024 Apr 23;43(4):113991.
doi: 10.1016/j.celrep.2024.113991. Epub 2024 Apr 3.

Tactile processing in mouse cortex depends on action context

Affiliations

Tactile processing in mouse cortex depends on action context

Eric A Finkel et al. Cell Rep. .

Abstract

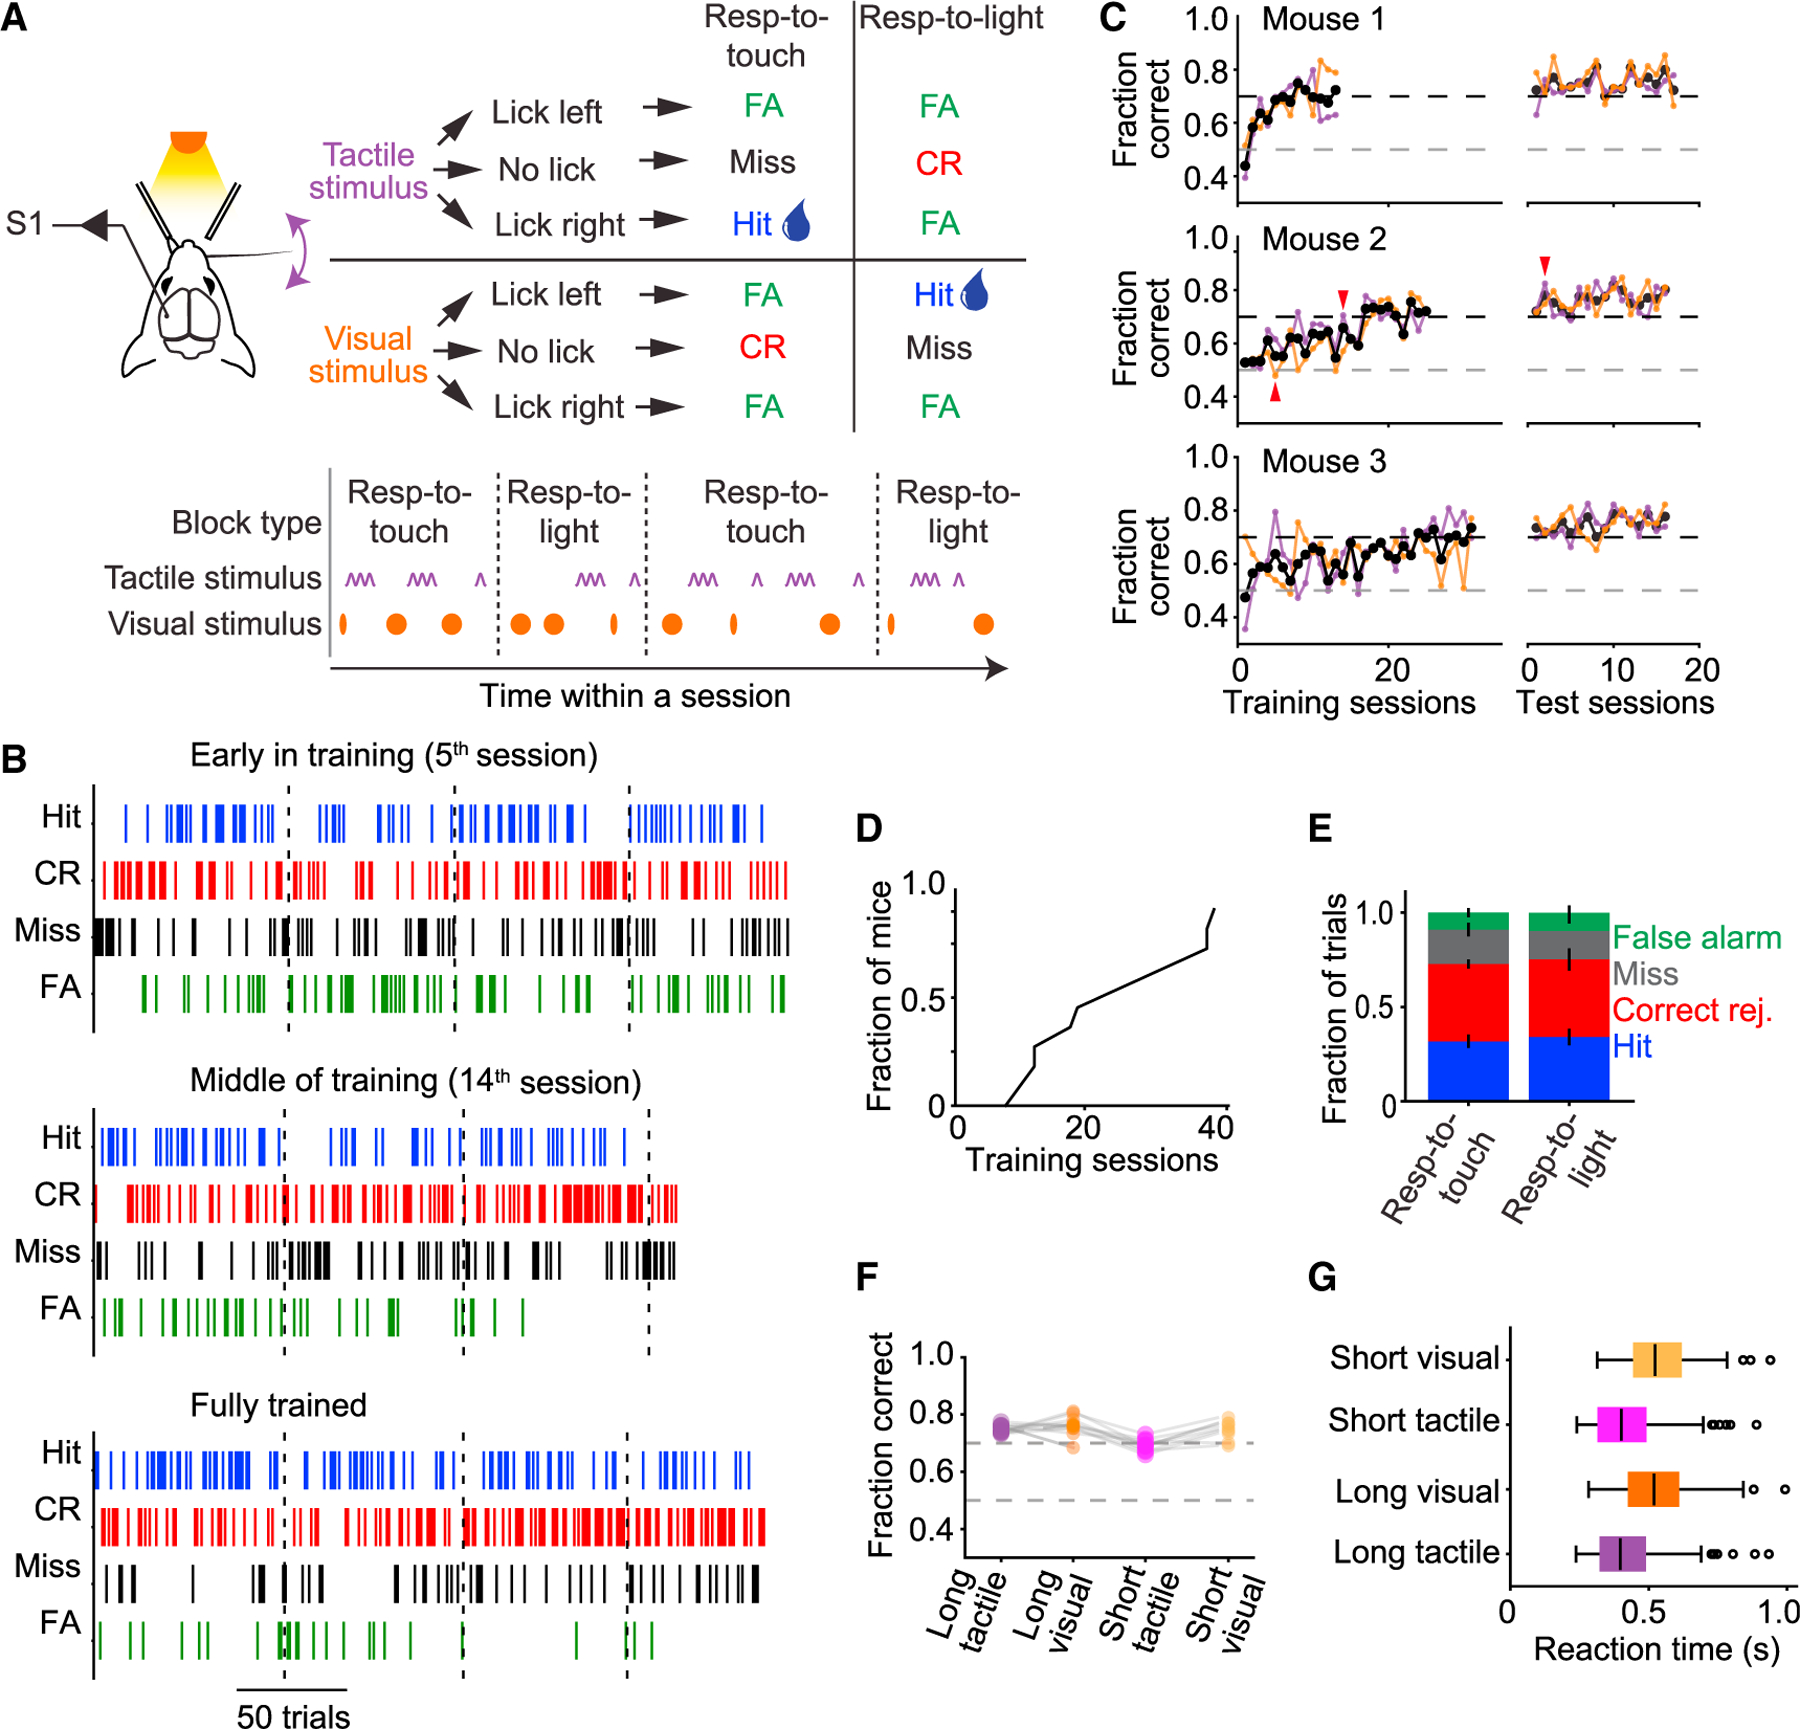
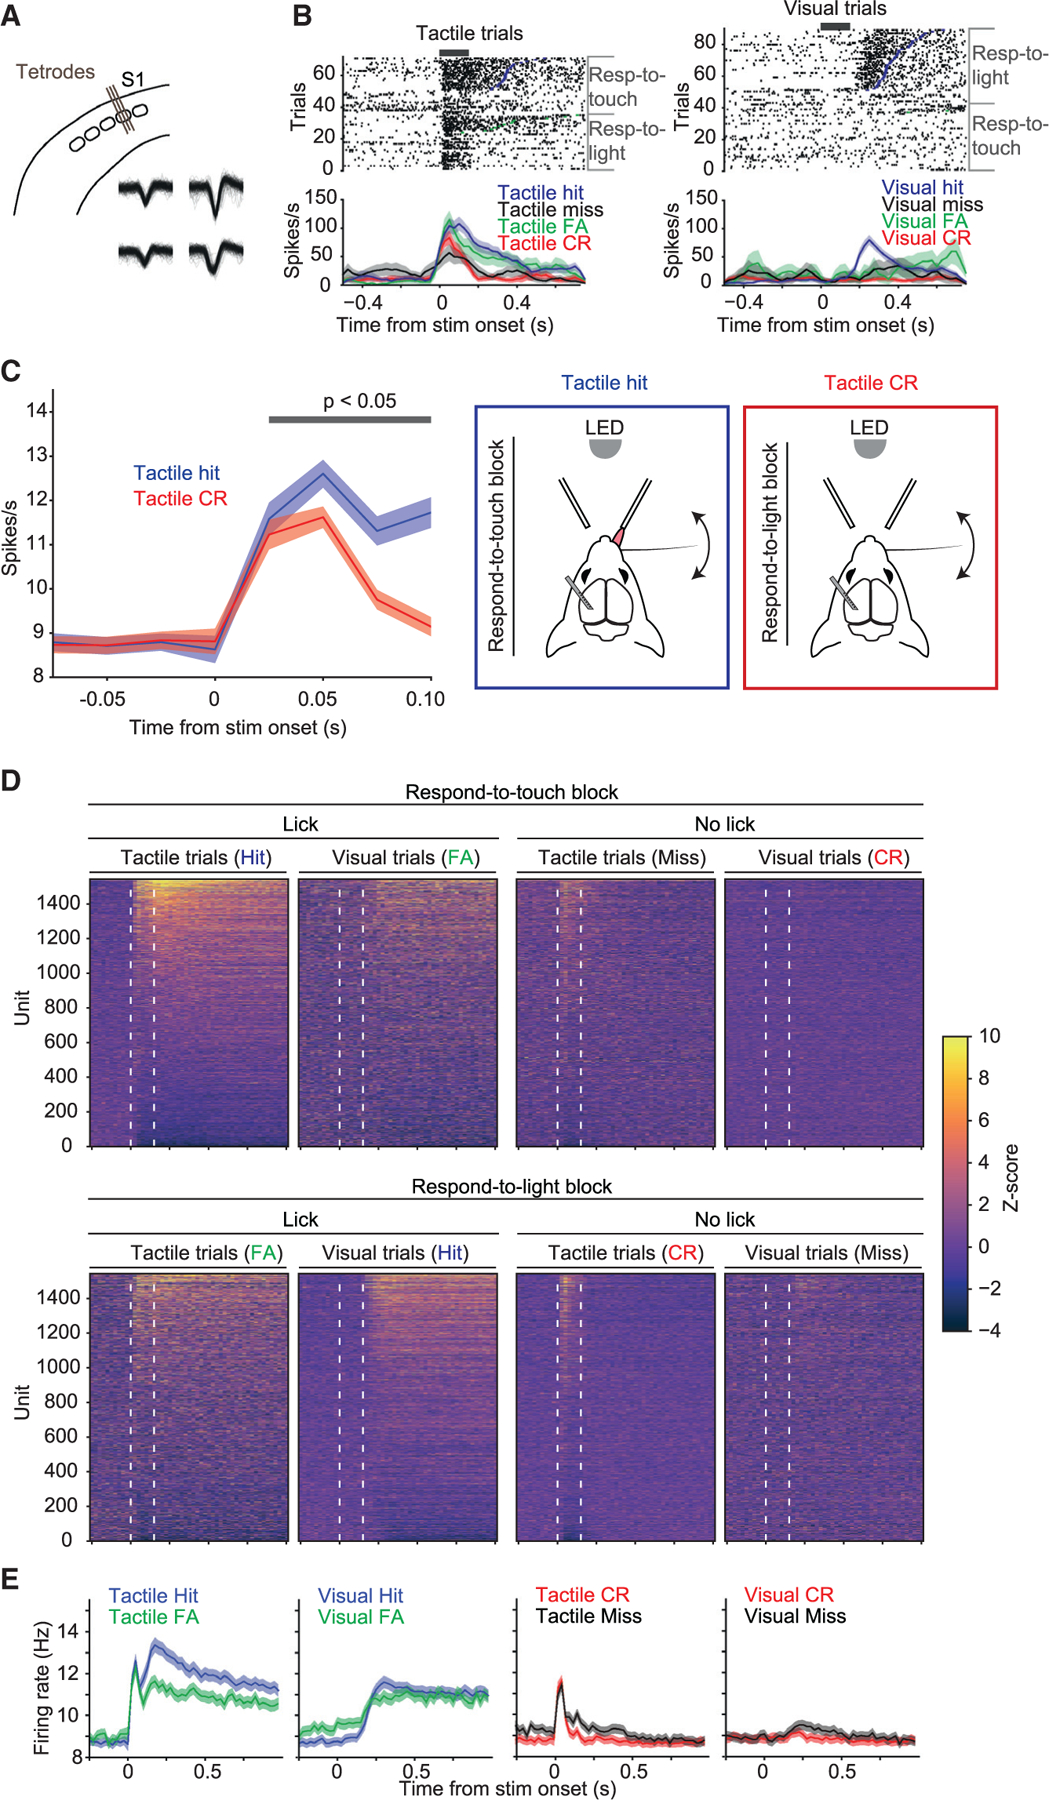
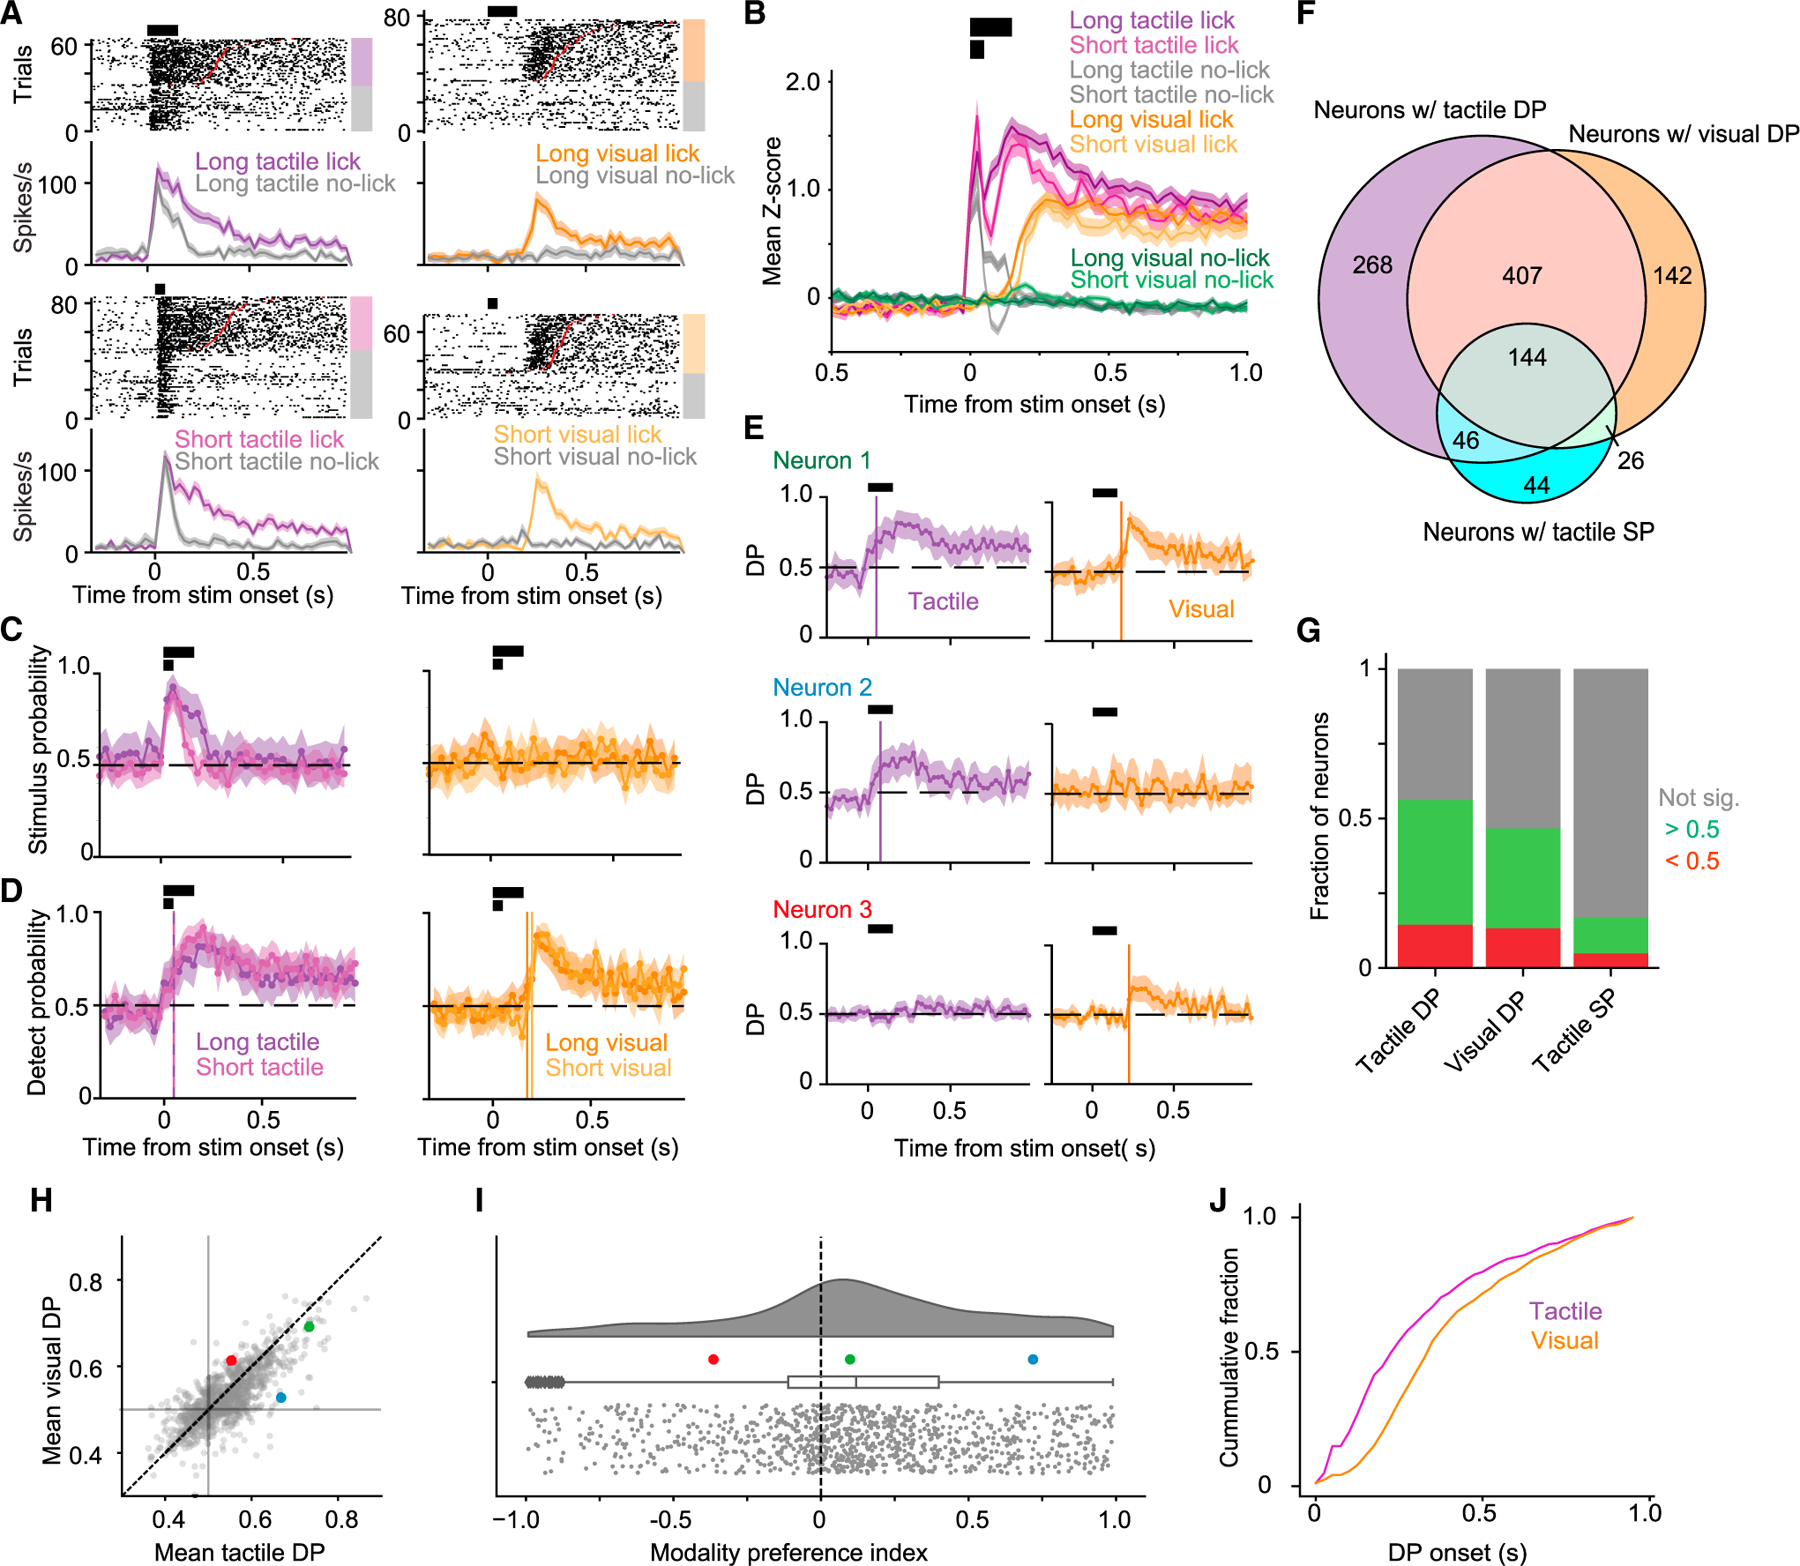
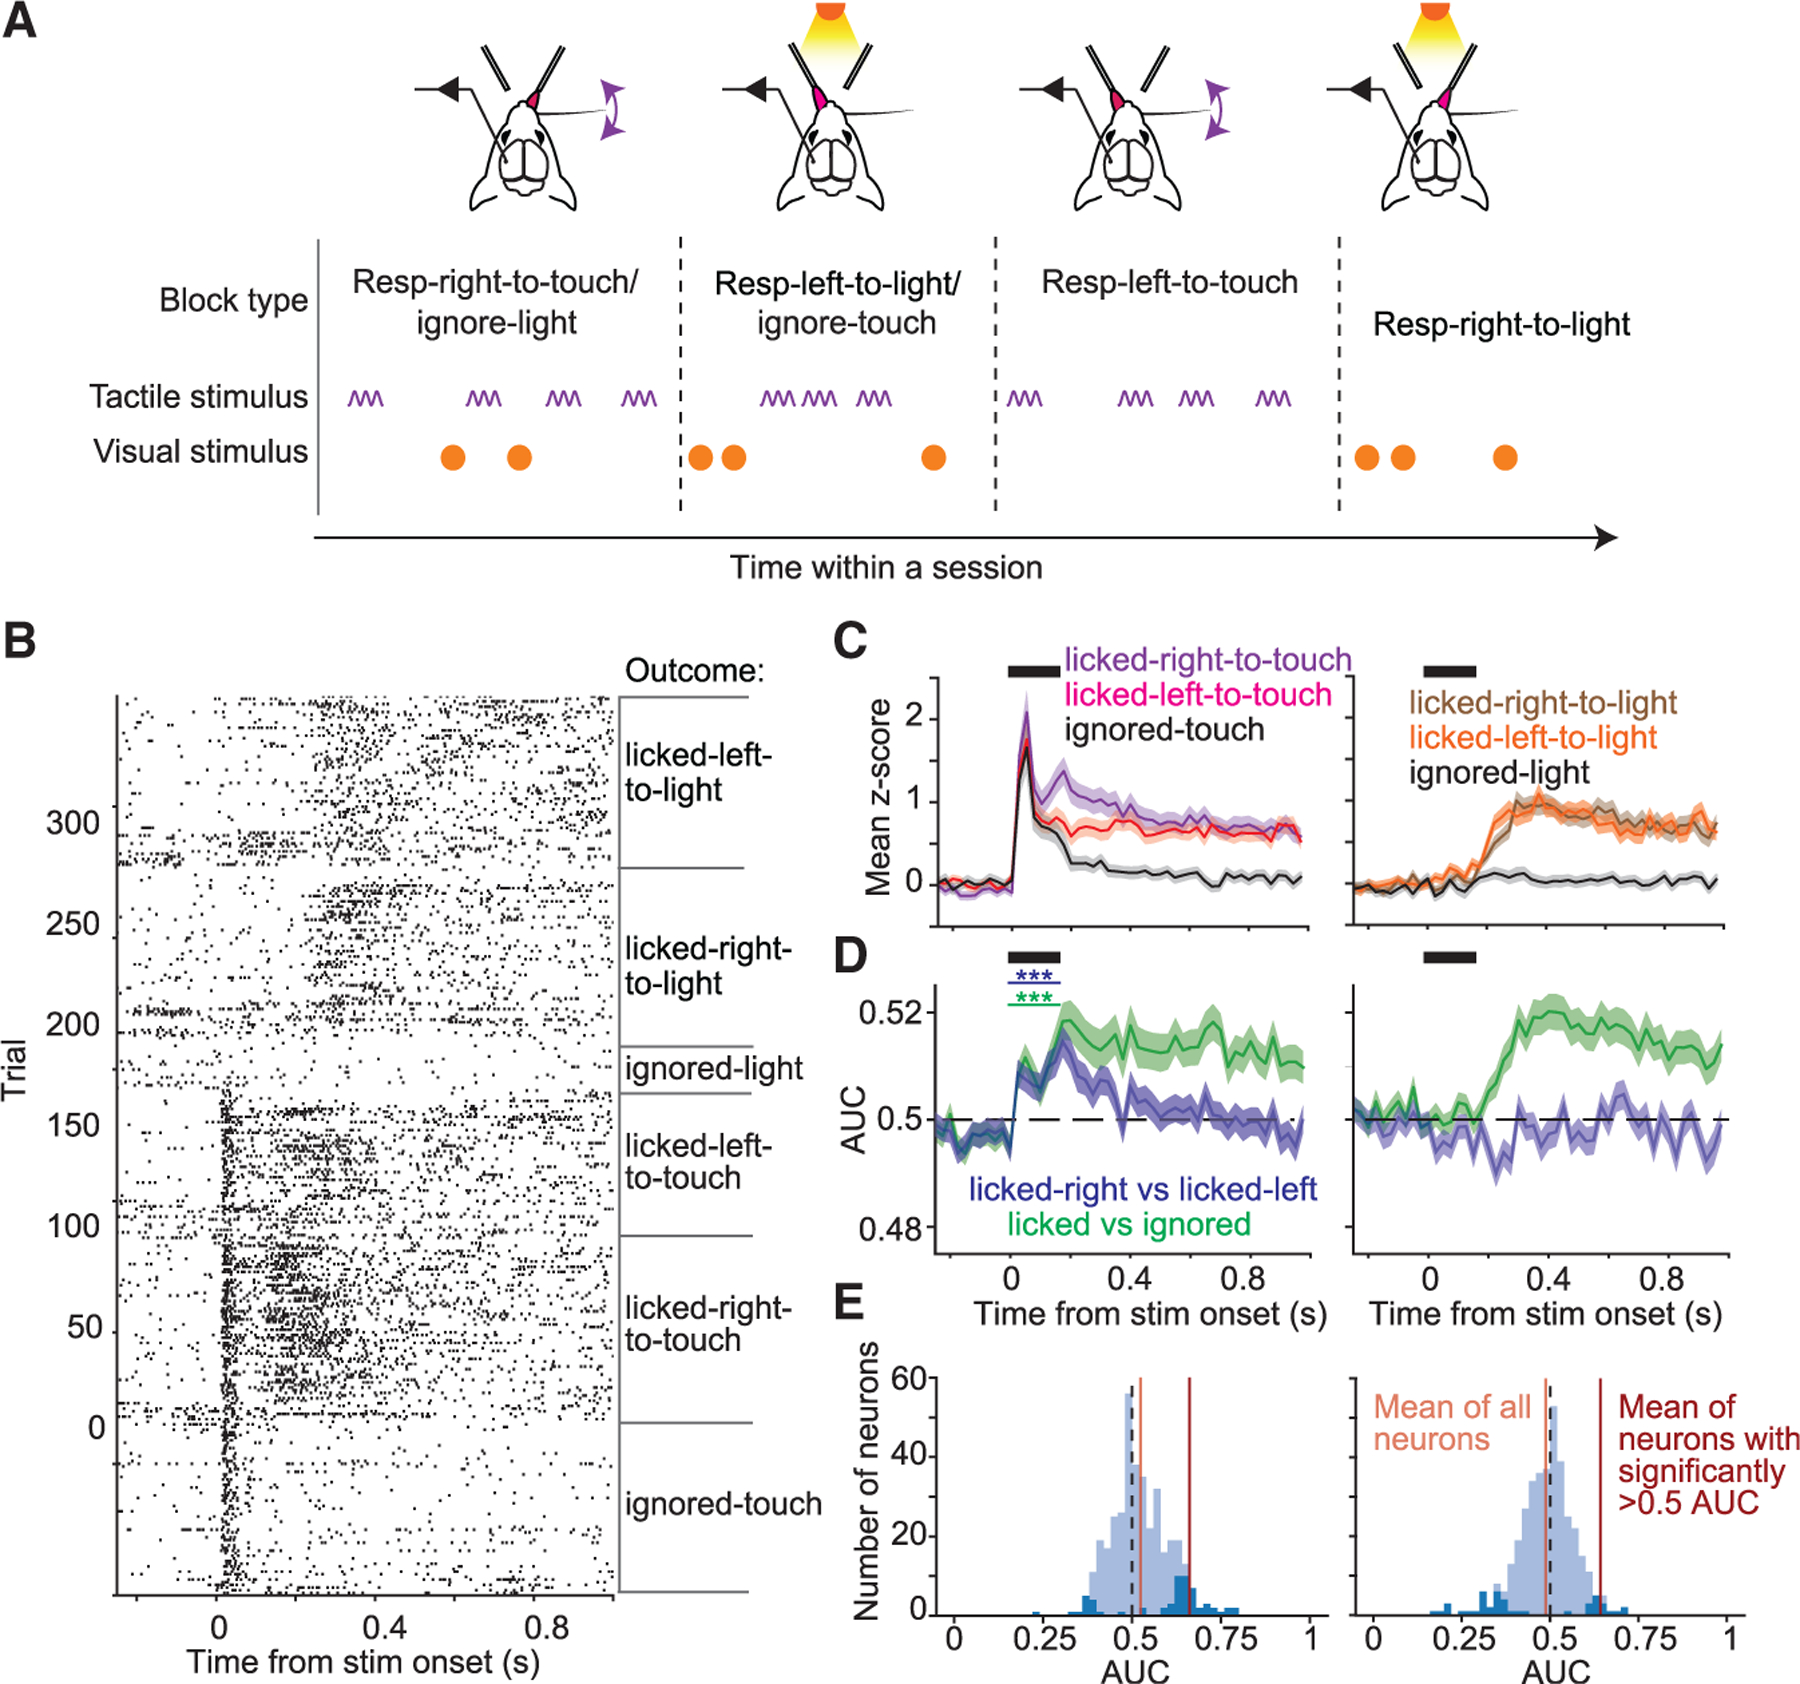
The brain receives constant tactile input, but only a subset guides ongoing behavior. Actions associated with tactile stimuli thus endow them with behavioral relevance. It remains unclear how the relevance of tactile stimuli affects processing in the somatosensory (S1) cortex. We developed a cross-modal selection task in which head-fixed mice switched between responding to tactile stimuli in the presence of visual distractors or to visual stimuli in the presence of tactile distractors using licking movements to the left or right side in different blocks of trials. S1 spiking encoded tactile stimuli, licking actions, and direction of licking in response to tactile but not visual stimuli. Bidirectional optogenetic manipulations showed that sensory-motor activity in S1 guided behavior when touch but not vision was relevant. Our results show that S1 activity and its impact on behavior depend on the actions associated with a tactile stimulus.

Keywords: CP: Neuroscience; S1; behavioral context; sensorimotor; sensory processing; somatosensory cortex.


Conflict of interest statement

Declaration of interests The authors declare no competing interests.

Figures

Figure 1.
Figure 1.. A cross-modal selection task for head-fixed mice
(A) Tactile and visual stimuli were randomly interleaved throughout a behavioral session, grouped into respond-to-touch and respond-to-light blocks of trials that alternated (3–5 per session, ~80 trials each). Mice were rewarded with a drop of water for licking a reward port located to the right of the mouse after a tactile stimulus in a respond-to-touch block, or for licking a reward port located to the left of the mouse after a visual stimulus in a respond-to-light block. No reward was given for licking either port after a tactile stimulus in a respond-to-light block or after a visual stimulus in a respond-to-touch block. (B) Behavioral performance in an early training session (5th session; top), in a session in the middle of training (14th session; middle), and after training (2nd test session; bottom). Colored ticks represent the occurrence of the four types of trial outcome over the course of a session. (C) Performance of three example mice during training and testing periods. Overall performance is indicated by black traces, performance in respond-to-touch blocks by purple traces, and performance in respond-to-light blocks by orange traces. After training, an additional ~17 test sessions with the same task design were given; test sessions where performance fell below criterion were excluded and not used in later analyses (red arrows mark sessions in B). (D) Time to criterion performance (70% correct for 2 days) across mice (median 19). (E) Fractions of trial outcomes were similar across respond-to-touch and respond-to-light blocks (error bars denote ± SEM). (F) Performance was similar across all stimulus types for all mice. (G) Reaction-time distributions across the different stimulus types. Black vertical lines indicate medians, boxes indicate interquartile range (IQR), whiskers indicate 1.53 IQR, and circles indicate outliers.
Figure 2.
Figure 2.. Relevance-dependent tactile and motor activity in S1
(A) Extracellular single-unit activity was recorded in whisker S1 (barrel) cortex using 32-channel tetrode microdrives. (B) Raster plots (top) and peristimulus spike time histograms (PSTHs, bottom; 25-ms bins, mean ± SEM) for an example unit. Rasters and PSTHs are aligned to the onset of either the long tactile stimuli (left, ‘‘tactile trials’’) or the long visual stimuli (right, ‘‘visual trials’’) and sorted by block and trial outcome. Thick black bars indicate period of stimulus delivery. (C) Mean population responses to the tactile stimulus were larger when the stimulus occurred in a respond-to-touch block and resulted in the mouse correctly making a lick response (tactile hits; blue curve) compared with when the stimulus occurred in a respond-to-light block and the mouse correctly withheld licking (tactile correct rejections; red curve). This difference in activity was evident as soon as 25 ms after stimulus onset. Error shading denotes ±SEM. Gray bar indicates time bins where p < 0.05 from tests performed in Figure S1. Schematics of the two trial types are shown in panels on the right. (D) Normalized activity across the population of recorded neurons (n = 1,539 units from 11 mice). Trials are grouped by block type, stimulus type, and trial outcome and sorted by mean activity during a 500-ms window after stimulus onset in tactile hits. White dashed lines indicate the onset and offset of the long tactile or visual stimuli. (E) Mean PSTHs across all 1,539 neurons for each of the four types of trial outcome (Hit, FA, CR, Miss) for both stimulus types (tactile, visual). Error shading denotes ± SEM.
Figure 3.
Figure 3.. Trial-by-trial encoding of touch and lick actions
(A) Raster plots and PSTHs (mean ± SEM, 25-ms bins) for an example neuron separately for long (150 ms; top row) and short (50 ms; bottom row) tactile (left column) and visual (right column) stimuli. Trials are grouped by whether the mouse licked. Increased activity is evident in association with the tactile stimulus, licking after the tactile stimulus, and licking after the visual stimulus, but not with the visual stimulus. (B) Mean normalized activity (±SEM, 25-ms bins) of all neurons recorded (n = 1,539 units from 11 mice) across stimulus trials with a lick response. Horizontal black bars indicate periods of short and long stimulus delivery. (C) Stimulus probability (SP) for the example neuron in (A) (mean ± 95% confidence interval [CI], 25-ms bins). Significant (95% CI > 0.5) SP was prolonged for long (dark purple) relative to short (light purple) tactile stimulus trials, and not evident for either long (dark orange) or short (light orange) visual stimulus trials. (D) Detect probability (DP) for the example neuron in (A) (mean ± 95% CI, 25-ms bins). Significant (95% CI > 0.5) DP was detected for long and short tactile and visual stimulus trials. Vertical colored lines indicate onset of significant DP for the different trial types. (E) Three example neurons illustrating range of DP responses (mean ± 95% CI, 25-ms bins). Neurons could show significant DP for both tactile and visual trials (top), for only tactile lick trials (middle), or for only visual lick trials (bottom). (F) Overlap of neurons with significant values (95% CI does not include 0.5 for two consecutive bins after stimulus onset) of DP in tactile trials, DP in visual trials, or SP in tactile trials. (G) Fractions of neurons with significant positive-going (green), negative-going (red), or no (gray) significant DP and SP (n = 1,539 units from 11 mice). (H) Mean tactile vs. visual DP values for each unit with significant values of both. Symbols show mean over the first 500 ms following onset of significant DP. Colored symbols indicate example neurons in (E). (I) Distribution of modality preference index for units with significant values of both tactile and visual DP. Box plot indicates median, IQR, and 1.5× IQR (whiskers). (J) Cumulative distributions of the time of DP onset with respect to stimulus onset for tactile (purple) and visual (orange) trials.
Figure 4.
Figure 4.. Sensory-motor integration in S1
(A) Cross-modal selection task with added blocks of trials to control for lick direction. Two additional block types were added to test sessions for mice trained on the cross-modal selection task, one in which mice were given only tactile stimuli and rewarded for licking left (‘‘respond-left-to-touch’’ trials) and one in which mice were given only visual stimuli and rewarded for licking right (‘‘respond-right-to-light’’ trials). (B) Raster plot for an example neuron sorted by stimulus type and trial outcome. (C) Mean normalized PSTHs (±SEM) for tactile (left) and visual (right) trials, grouped by lick outcome (ignore, lick-left, or lick-right). (D) Left: mean area under the ROC curve (AUC) (±SEM) for discriminating respond-to-touch vs. ignore trials (green traces, p <1 3 10−3, one-sided one-sample t test on first 150-ms bin, n = 375 neurons) or licked-right vs. licked-left trials (blue traces, p < 1 3 10−3). Right: same as left but for respond-to-light trials. (E) Distributions of AUC for individual neurons. Dark-blue bars indicate neurons with significant AUC values. Left: mean AUC values (over first 150 ms after stimulus onset) for licked-right-to-touch vs. licked-left-to-touch comparison. Right: similar to left but for licked-right-to-light vs. licked-left-to-light.
Figure 5.
Figure 5.. Motor activity in S1 cannot be explained by whisker motion
(A) Example high-speed video frame showing the stimulated whisker (threaded into the stimulator pipette) and a ‘‘surrogate’’ whisker used to monitor whisking. Other whiskers were trimmed. Points on the whiskers (colored circles) were tracked to quantify whisker position and motion. (B) ‘‘Whisker detect probability’’ (mean ± 95% CI) for the stimulated whisker. (C) Reaction time for each trial plotted against that session’s surrogate whisker DP onset time for tactile hit (left) and visual hit (right) trials. Median reaction time for each session is indicated, color coded by mouse. Pearson correlation coefficients and corresponding p values are indicated. (D) Cumulative histograms of whisker DP onset times for each session (black and gray curves), plotted for comparison with cumulative histograms of the earliest neural DP onsets for each session, for tactile (left, purple curves) and visual (right, orange curves) stimuli. The different neural DP curves (shades of purple and orange) show results based on defining the ‘‘earliest’’ DP onsets as including only that of the single earliest neuron, as including the two earliest neurons, three earliest, and so on. The total number of neurons included in each histogram is indicated in parentheses.
Figure 6.
Figure 6.. S1 excitation promotes lick responses during respond-to-touch but not respond-to-light blocks
(A) Direct optogenetic excitation of S1 replaced either tactile or visual stimuli in 20% of test-session trials in the cross-modal selection task. (B) Probability that mice licked for each trial type during respond-to-touch (left) and respond-to-light (right) blocks. Brackets indicate comparisons shown in (C) and (D). Error bars denote ± SEM. (C) Left: difference in p(lick) after direct excitation of S1 vs. after tactile stimuli in respond-to-touch blocks (groups indicated by leftmost bracket in B) for four mice. Sham trials are from days in which mice underwent the same experiment as in (A) but with laser illumination of S1 obstructed. Right: similar to left panel but comparing p(lick) after direct excitation of S1 vs. after visual stimuli in respond-to-light blocks. Shaded regions indicate 95% CI for the mean ∆p(lick). Excitation of S1 elicited licking at comparable levels to tactile stimuli in respond-to-touch blocks but did not elicit licking at comparable levels to visual stimuli in respond-to-light blocks. (D) Similar to (C) but comparing p(lick) after direct excitation of S1 in respond-to-touch blocks vs. respond-to-light blocks (groups indicated by topmost bracket in B). Excitation of S1 during respond-to-touch blocks elicited licking at a higher level than in respond-to-light blocks. (E) Box plots depicting reaction times for correct lick responses to tactile or visual stimuli as well as for lick responses to direct optogenetic stimulation of S1 in respond-to-touch blocks or respond-to-light blocks. Vertical lines indicate medians, boxes indicate IQR, whiskers indicate 1.5× IQR, and circles indicate outliers. Reaction times to direct excitation of S1 are more similar to reaction times to tactile stimulation in respond-to-touch blocks than in respond-to-light blocks.
Figure 7.
Figure 7.. Inhibiting S1 activity selectively impairs tactile detection
(A) Optogenetic inhibition (lightning bolts) occurred in 30% of test-session trials, beginning simultaneously or with a 50-ms delay relative to the onset of the tactile or visual stimulus. (B) Raster plots and PSTHs (mean ± SEM) for an example neuron during inhibition trials or normal tactile and visual trials (blue highlight indicates periods of inhibition). (C) Heatmap of Z-scored activity across all neurons (n = 261 from four mice). (D) Change in spike rate relative to baseline for neurons with a significant positive-going (>0.5) SP in respond-to-touch blocks. The effect of inhibition was delayed in the ‘‘50 ms delay’’ condition relative to the ‘‘no delay’’ condition (p values are from sign tests; horizontal lines, medians; boxes, IQR; whiskers, 1.5× IQR; outliers not depicted for clarity). (E) Behavioral effects of S1 inhibition for different trial types in respond-to-touch (left) or respond-to-light (right) blocks. ‘‘Catch’’ trials are those with inhibition but no tactile or visual stimulus. Brackets indicate conditions compared in (F). Inhibition of S1 during tactile stimuli in respond-to-touch blocks led to a decrease in the probability of licking. Inhibition of S1 during a visual stimulus in respond-to-light blocks did not lead to an obvious change in the probability of licking. Error bars denote ±SEM. (F) Left: difference in p(lick) after tactile + inhibition trials vs. tactile (no laser) trials (data indicated by brackets from left panel in E). Sham trials are from days in which mice underwent the same experiment as in (A) but with laser illumination of S1 obstructed. Middle: similar to left panel but comparing p(lick) after visual + inhibition trials vs. visual (no laser) trials (data indicated by brackets from right panel in E). Right: similar to left panel but for tactile/visual + no delay inhibition vs. tactile/visual +50 ms delay inhibition. Shaded regions indicate 95% CI on ∆p(lick). (G) Schematic of V1 inhibition experiment. (H) Similar to (E) but showing effects of inhibition of V1. (I) Similar to left and middle panels of (F) but for V1 inhibition.

References

    1. Norman DA, and Shallice T (1986). Attention to Action: Willed and Automatic Control of Behavior. In Consciousness and Self-Regulation: Advances in Research and Theory, Davidson RJ, Schwartz GE, and Shapiro D, eds. (Springer Science+Business Media), pp. 1–18.
    1. Moore T, and Zirnsak M (2017). Neural Mechanisms of Selective Visual Attention. Annu. Rev. Psychol. 68, 47–72. 10.1146/annurev-psych-122414-033400. - DOI - PubMed
    1. Rizzolatti G, Riggio L, Dascola I, and Umiltá C (1987). Reorienting attention across the horizontal and vertical meridians: evidence in favor of a premotor theory of attention. Neuropsychologia 25, 31–40. 10.1016/0028-3932(87)90041-8. - DOI - PubMed
    1. Moore T, and Armstrong KM (2003). Selective gating of visual signals by microstimulation of frontal cortex. Nature 421, 370–373. 10.1038/nature01341. - DOI - PubMed
    1. Moore T, and Fallah M (2001). Control of eye movements and spatial attention. Proc. Natl. Acad. Sci. USA 98, 1273–1276. 10.1073/pnas.021549498. - DOI - PMC - PubMed

Publication types

LinkOut - more resources