

Identification of PPARG as key gene to link coronary atherosclerosis disease and rheumatoid arthritis via microarray data analysis
- PMID: 38573982
- PMCID: PMC10994321
- DOI: 10.1371/journal.pone.0300022
Identification of PPARG as key gene to link coronary atherosclerosis disease and rheumatoid arthritis via microarray data analysis
Abstract
Background: Inflammation is the common pathogenesis of coronary atherosclerosis disease (CAD) and rheumatoid arthritis (RA). Although it is established that RA increases the risk of CAD, the underlining mechanism remained indefinite. This study seeks to explore the molecular mechanisms of RA linked CAD and identify potential target gene for early prediction of CAD in RA patients.
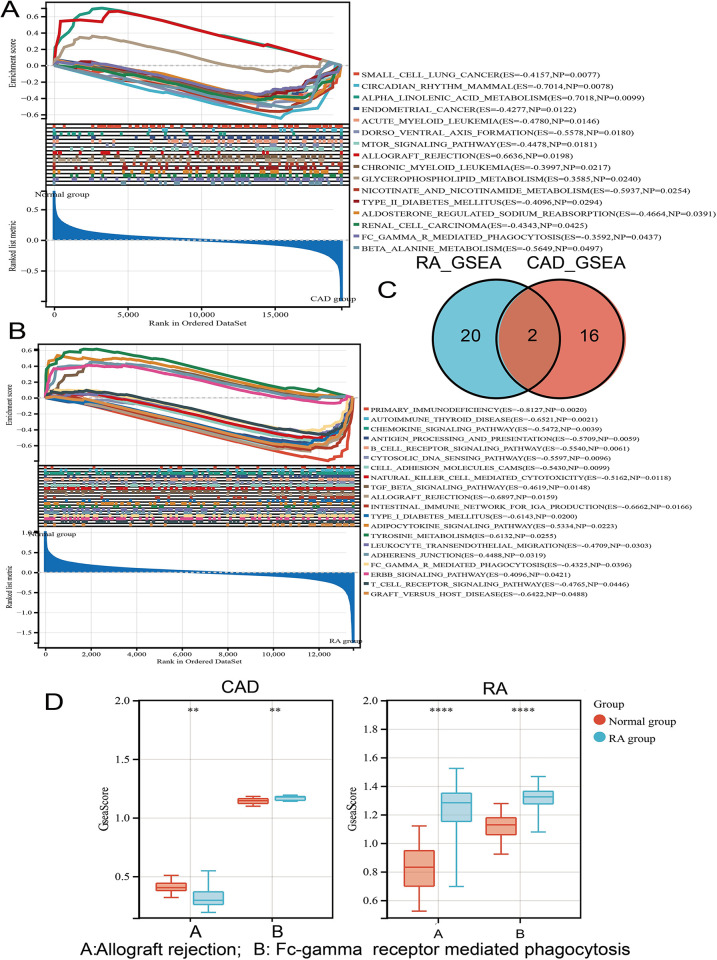
Materials and methods: The study utilized five raw datasets: GSE55235, GSE55457, GSE12021 for RA patients, and GSE42148 and GSE20680 for CAD patients. Gene Set Enrichment Analysis (GSEA) was used to investigate common signaling pathways associated with RA and CAD. Then, weighted gene co-expression network analysis (WGCNA) was performed on RA and CAD training datasets to identify gene modules related to single-sample GSEA (ssGSEA) scores. Overlapping module genes and differentially expressed genes (DEGs) were considered as co-susceptible genes for both diseases. Three hub genes were screened using a protein-protein interaction (PPI) network analysis via Cytoscape plug-ins. The signaling pathways, immune infiltration, and transcription factors associated with these hub genes were analyzed to explore the underlying mechanism connecting both diseases. Immunohistochemistry and qRT-PCR were conducted to validate the expression of the key candidate gene, PPARG, in macrophages of synovial tissue and arterial walls from RA and CAD patients.
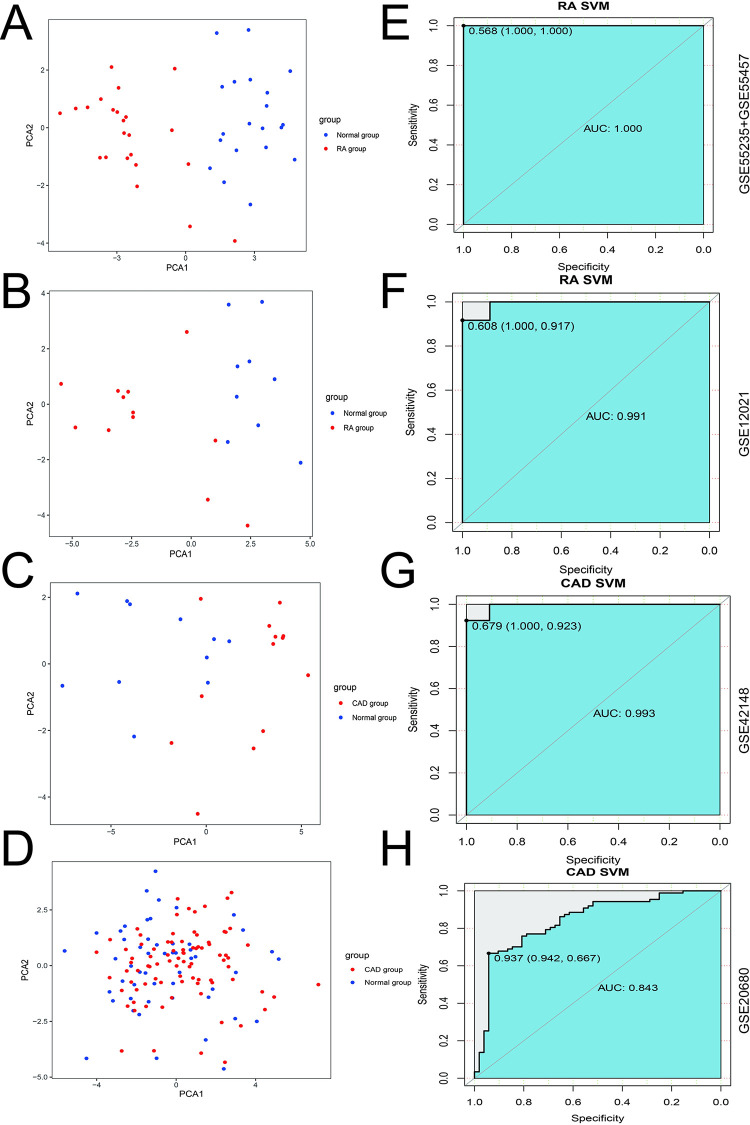
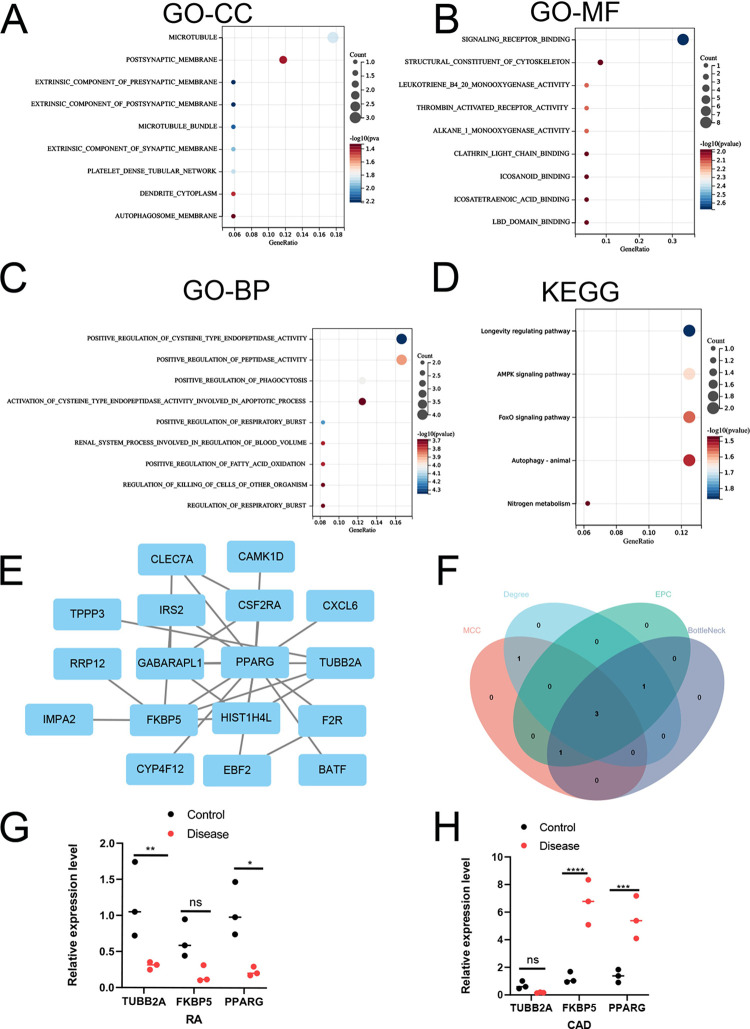
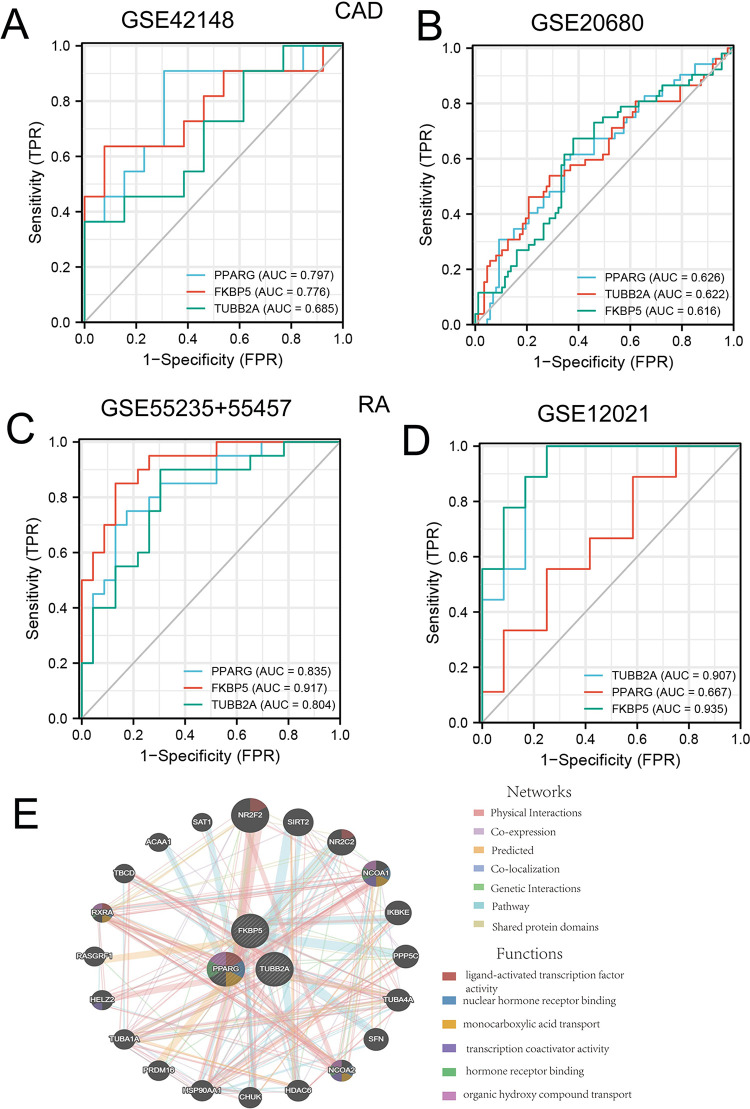
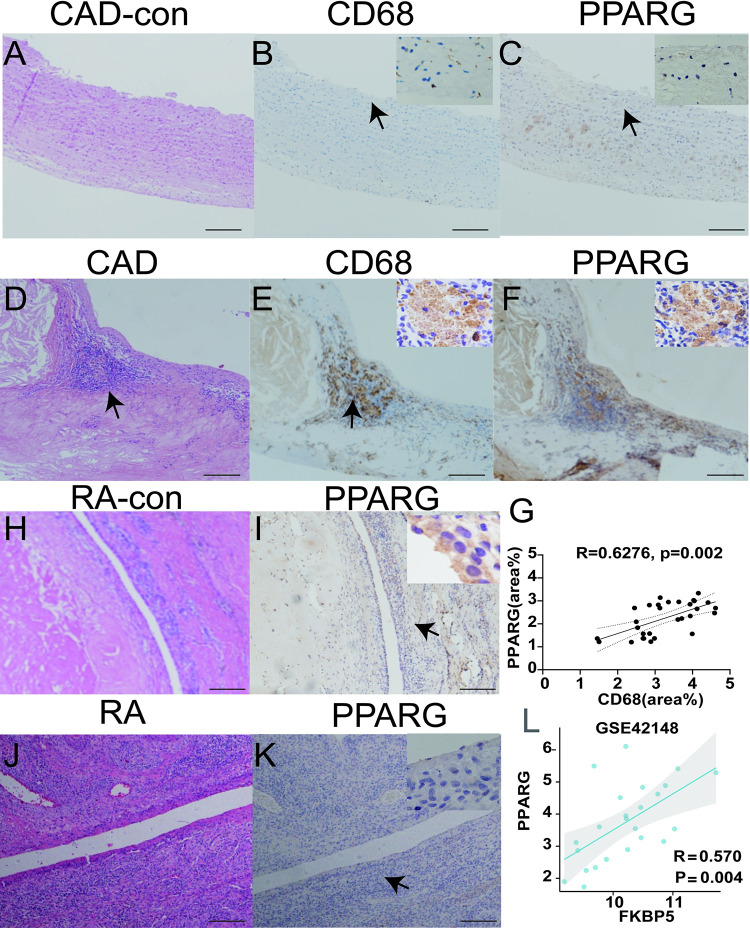
Results: The study found that Fc-gamma receptor-mediated endocytosis is a common signaling pathway for both RA and CAD. A total of 25 genes were screened by WGCNA and DEGs, which are involved in inflammation-related ligand-receptor interactions, cytoskeleton, and endocytosis signaling pathways. The principal component analysis(PCA) and support vector machine (SVM) and receiver-operator characteristic (ROC) analysis demonstrate that 25 DEGs can effectively distinguish RA and CAD groups from normal groups. Three hub genes TUBB2A, FKBP5, and PPARG were further identified by the Cytoscape software. Both FKBP5 and PPARG were downregulated in synovial tissue of RA and upregulated in the peripheral blood of CAD patients and differential mRNAexpreesion between normal and disease groups in both diseases were validated by qRT-PCR.Association of PPARG with monocyte was demonstrated across both training and validation datasets in CAD. PPARG expression is observed in control synovial epithelial cells and foamy macrophages of arterial walls, but was decreased in synovial epithelium of RA patients. Its expression in foamy macrophages of atherosclerotic vascular walls exhibits a positive correlation (r = 0.6276, p = 0.0002) with CD68.
Conclusion: Our findings suggest that PPARG may serve as a potentially predictive marker for CAD in RA patients, which provides new insights into the molecular mechanism underling RA linked CAD.
Copyright: © 2024 Zhang et al. This is an open access article distributed under the terms of the Creative Commons Attribution License, which permits unrestricted use, distribution, and reproduction in any medium, provided the original author and source are credited.
Conflict of interest statement
The authors have declared that no competing interests exist.
Figures


Similar articles
-
Screening and identification of potential hub genes and immune cell infiltration in the synovial tissue of rheumatoid arthritis by bioinformatic approach.Heliyon. 2023 Jan 10;9(1):e12799. doi: 10.1016/j.heliyon.2023.e12799. eCollection 2023 Jan. Heliyon. 2023. PMID: 36699262 Free PMC article.
-
Analysis of common differential gene expression in synovial cells of osteoarthritis and rheumatoid arthritis.PLoS One. 2024 May 21;19(5):e0303506. doi: 10.1371/journal.pone.0303506. eCollection 2024. PLoS One. 2024. PMID: 38771826 Free PMC article.
-
Exploration and Identification of Potential Biomarkers and Immune Cell Infiltration Analysis in Synovial Tissue of Rheumatoid Arthritis.Int J Rheum Dis. 2025 Feb;28(2):e70137. doi: 10.1111/1756-185X.70137. Int J Rheum Dis. 2025. PMID: 39953769
-
Bioinformatics and machine learning approaches reveal key genes and underlying molecular mechanisms of atherosclerosis: A review.Medicine (Baltimore). 2024 Aug 2;103(31):e38744. doi: 10.1097/MD.0000000000038744. Medicine (Baltimore). 2024. PMID: 39093811 Free PMC article. Review.
-
Gene expression profiling in rheumatoid arthritis: current concepts and future directions.Ann Rheum Dis. 2008 Dec;67(12):1663-9. doi: 10.1136/ard.2007.076588. Epub 2008 Feb 4. Ann Rheum Dis. 2008. PMID: 18250114 Review.
Cited by
-
Analysis of risk factors and the predictive value of a nomogram model for coronary heart disease in patients with rheumatoid arthritis.Front Cardiovasc Med. 2025 Jun 9;12:1558012. doi: 10.3389/fcvm.2025.1558012. eCollection 2025. Front Cardiovasc Med. 2025. PMID: 40552192 Free PMC article.
References
-
- Hollan I, Ronda N, Dessein P, Agewall S, Karpouzas G, Tamargo J, et al.. Lipid management in rheumatoid arthritis: a position paper of the Working Group on Cardiovascular Pharmacotherapy of the European Society of Cardiology. Eur Heart J Cardiovasc Pharmacother. 2020;6(2):104–114. doi: 10.1093/ehjcvp/pvz033 - DOI - PubMed
-
- Agca R, Blanken AB, van Sijl AM, Smulders YM, Voskuyl AE, van der Laken C, et al.. Arterial wall inflammation is increased in rheumatoid arthritis compared with osteoarthritis, as a marker of early atherosclerosis. Rheumatology (Oxford). 2021;60(7):3360–3368. doi: 10.1093/rheumatology/keaa789 - DOI - PMC - PubMed
-
- Navarro-Millán I, Yang S, DuVall SL, Chen L, Baddley J, Cannon GW, et al.. Association of hyperlipidaemia, inflammation and serological status and coronary heart disease among patients with rheumatoid arthritis: data from the National Veterans Health Administration. Ann Rheum Dis. 2016;75(2):341–347. doi: 10.1136/annrheumdis-2013-204987 - DOI - PMC - PubMed
MeSH terms
Substances
LinkOut - more resources
Full Text Sources
Medical
Miscellaneous
