

Aflatoxin B1 and Epstein-Barr virus-induced CCL22 expression stimulates B cell infection
- PMID: 38574017
- PMCID: PMC11032484
- DOI: 10.1073/pnas.2314426121
Aflatoxin B1 and Epstein-Barr virus-induced CCL22 expression stimulates B cell infection
Abstract
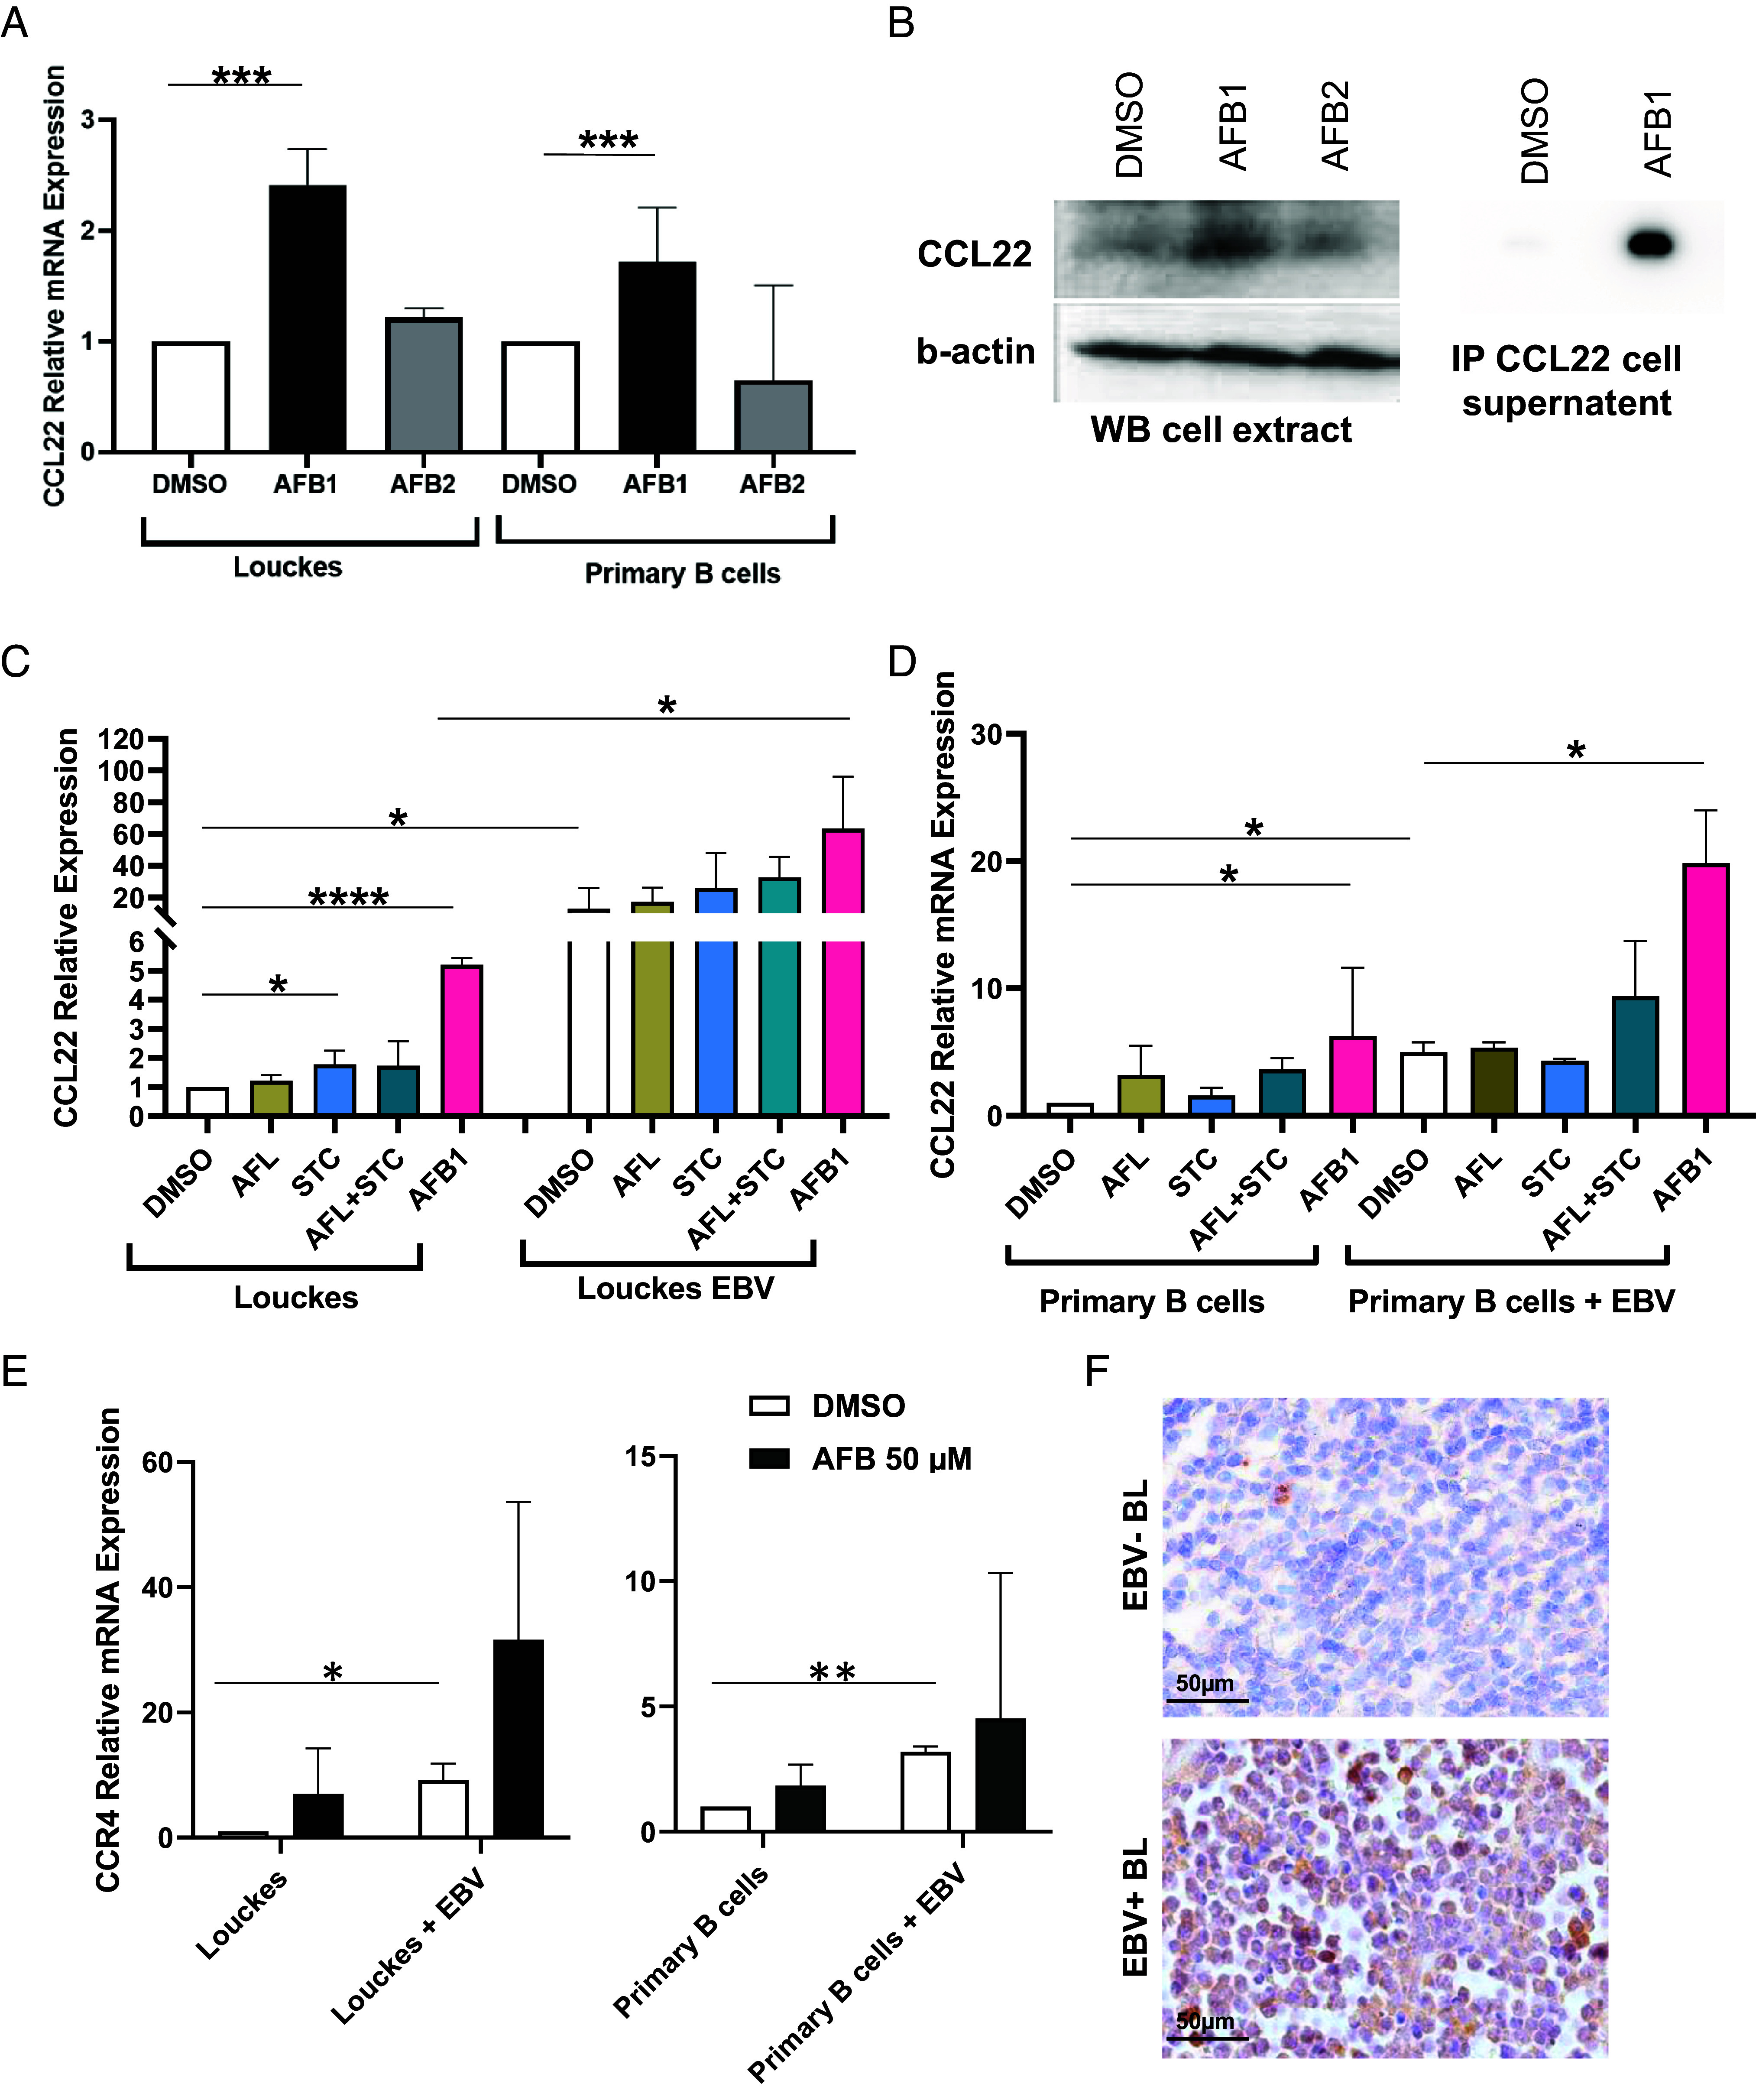
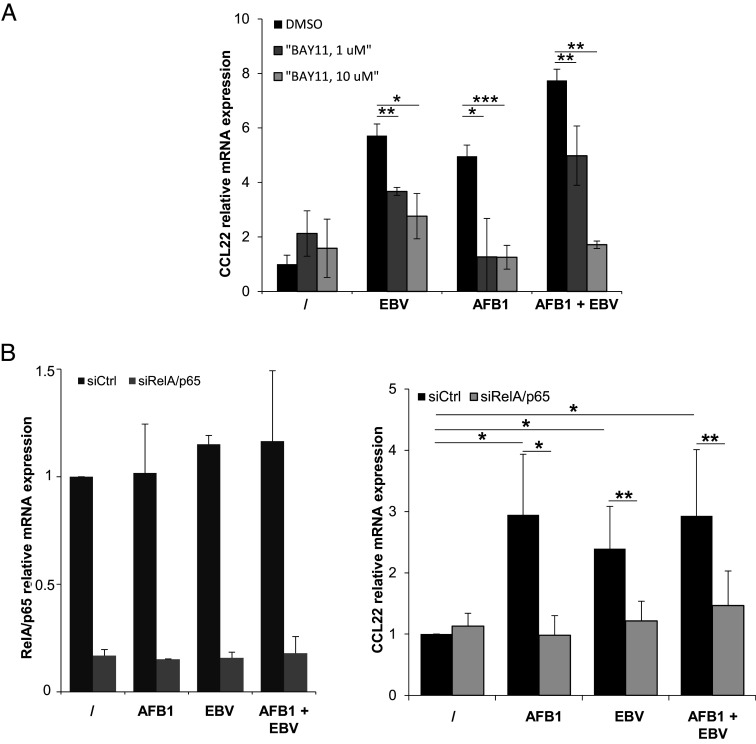
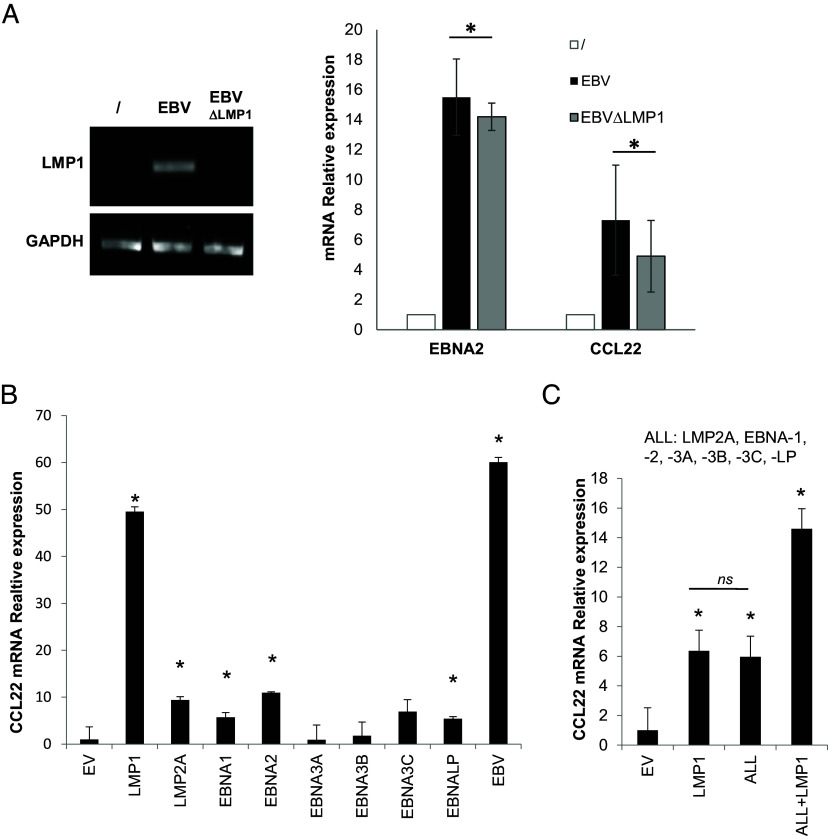
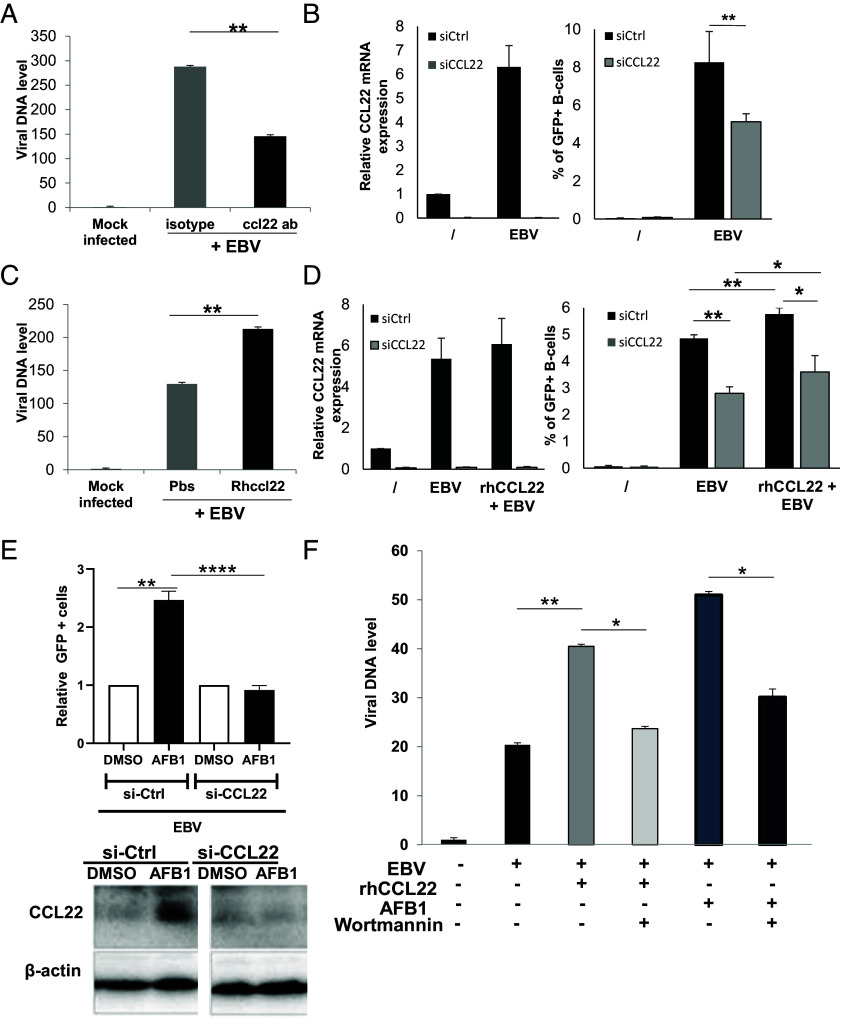
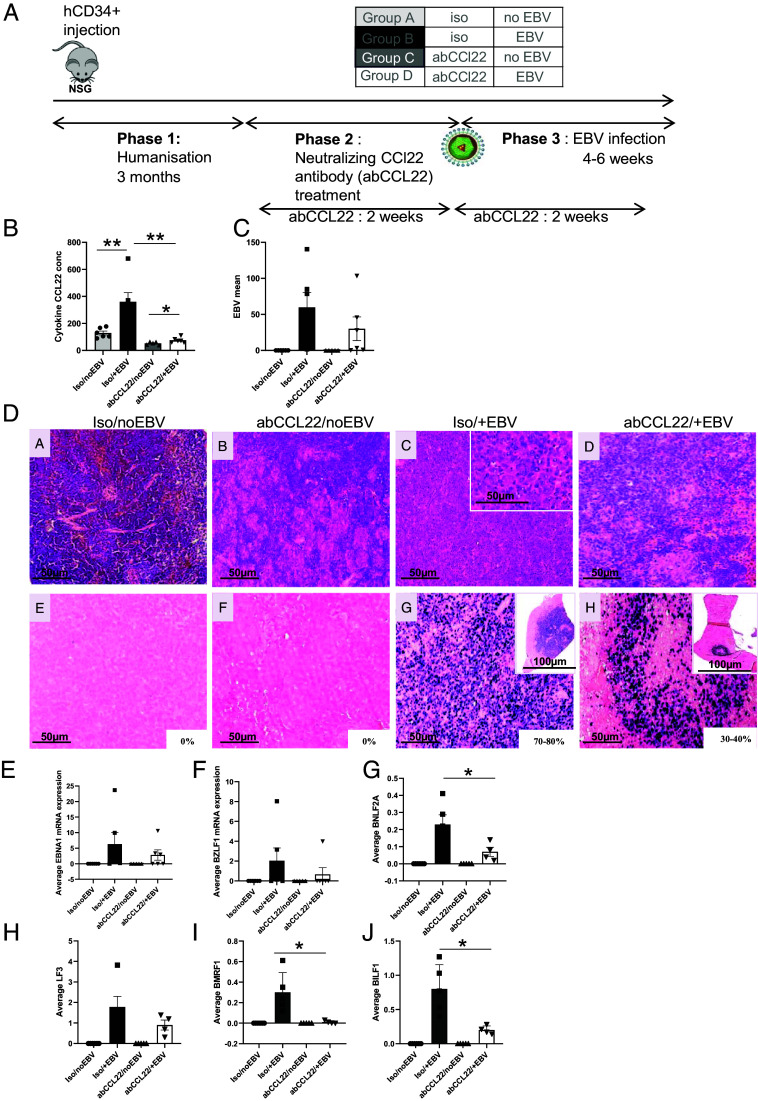
Epstein-Barr Virus (EBV) infects more than 90% of the adult population worldwide. EBV infection is associated with Burkitt lymphoma (BL) though alone is not sufficient to induce carcinogenesis implying the involvement of co-factors. BL is endemic in African regions faced with mycotoxins exposure. Exposure to mycotoxins and oncogenic viruses has been shown to increase cancer risks partly through the deregulation of the immune response. A recent transcriptome profiling of B cells exposed to aflatoxin B1 (AFB1) revealed an upregulation of the Chemokine ligand 22 (CCL22) expression although the underlying mechanisms were not investigated. Here, we tested whether mycotoxins and EBV exposure may together contribute to endemic BL (eBL) carcinogenesis via immunomodulatory mechanisms involving CCL22. Our results revealed that B cells exposure to AFB1 and EBV synergistically stimulated CCL22 secretion via the activation of Nuclear Factor-kappa B pathway. By expressing EBV latent genes in B cells, we revealed that elevated levels of CCL22 result not only from the expression of the latent membrane protein LMP1 as previously reported but also from the expression of other viral latent genes. Importantly, CCL22 overexpression resulting from AFB1-exposure in vitro increased EBV infection through the activation of phosphoinositide-3-kinase pathway. Moreover, inhibiting CCL22 in vitro and in humanized mice in vivo limited EBV infection and decreased viral genes expression, supporting the notion that CCL22 overexpression plays an important role in B cell infection. These findings unravel new mechanisms that may underpin eBL development and identify novel pathways that can be targeted in drug development.
Keywords: CCL22; Epstein–Barr virus; carcinogenesis; endemic Burkitt lymphoma; mycotoxins.
Conflict of interest statement
Competing interests statement:The authors declare no competing interest.
Figures
Similar articles
-
The mycotoxin aflatoxin B1 stimulates Epstein-Barr virus-induced B-cell transformation in in vitro and in vivo experimental models.Carcinogenesis. 2015 Nov;36(11):1440-51. doi: 10.1093/carcin/bgv142. Epub 2015 Sep 30. Carcinogenesis. 2015. PMID: 26424750
-
Latent Epstein-Barr virus infection collaborates with Myc over-expression in normal human B cells to induce Burkitt-like Lymphomas in mice.PLoS Pathog. 2024 Apr 15;20(4):e1012132. doi: 10.1371/journal.ppat.1012132. eCollection 2024 Apr. PLoS Pathog. 2024. PMID: 38620028 Free PMC article.
-
Interplay between the Epigenetic Enzyme Lysine (K)-Specific Demethylase 2B and Epstein-Barr Virus Infection.J Virol. 2019 Jun 14;93(13):e00273-19. doi: 10.1128/JVI.00273-19. Print 2019 Jul 1. J Virol. 2019. PMID: 30996097 Free PMC article.
-
Endemic Burkitt's lymphoma as a polymicrobial disease: new insights on the interaction between Plasmodium falciparum and Epstein-Barr virus.Semin Cancer Biol. 2009 Dec;19(6):411-20. doi: 10.1016/j.semcancer.2009.10.002. Epub 2009 Nov 6. Semin Cancer Biol. 2009. PMID: 19897039 Review.
-
The company malaria keeps: how co-infection with Epstein-Barr virus leads to endemic Burkitt lymphoma.Curr Opin Infect Dis. 2011 Oct;24(5):435-41. doi: 10.1097/QCO.0b013e328349ac4f. Curr Opin Infect Dis. 2011. PMID: 21885920 Free PMC article. Review.
Cited by
-
Tumor microenvironment of Burkitt lymphoma: different immune signatures with different clinical behavior.Blood Adv. 2024 Aug 27;8(16):4330-4343. doi: 10.1182/bloodadvances.2023011506. Blood Adv. 2024. PMID: 38861355 Free PMC article.
-
Viral oncogenesis in cancer: from mechanisms to therapeutics.Signal Transduct Target Ther. 2025 May 12;10(1):151. doi: 10.1038/s41392-025-02197-9. Signal Transduct Target Ther. 2025. PMID: 40350456 Free PMC article. Review.
-
The Functional Interaction Between Epstein-Barr Virus and MYC in the Pathogenesis of Burkitt Lymphoma.Cancers (Basel). 2024 Dec 18;16(24):4212. doi: 10.3390/cancers16244212. Cancers (Basel). 2024. PMID: 39766110 Free PMC article. Review.
References
-
- Thorley-Lawson D. A., Allday M. J., The curious case of the tumour virus: 50 years of Burkitt’s lymphoma. Nat. Rev. Microbiol. 6, 913–924 (2008). - PubMed
MeSH terms
Substances
Grants and funding
- PlanCancer ITMO/Institut National de la Santé et de la Recherche Médicale (Inserm)
- OPP1061062/Bill and Melinda Gates Foundation (GF)
- G085921N/Fonds Wetenschappelijk Onderzoek (FWO)
- INCA_15670/Institut National Du Cancer (INCa)
- 896422/EC | Horizon Europe | Excellent Science | HORIZON EUROPE Marie Sklodowska-Curie Actions (MSCA)
LinkOut - more resources
Full Text Sources
