. 2024 Apr 12;384(6692):eadk6200.
doi: 10.1126/science.adk6200. Epub 2024 Apr 12.

Sexual dimorphism in skin immunity is mediated by an androgen-ILC2-dendritic cell axis

Affiliations

Sexual dimorphism in skin immunity is mediated by an androgen-ILC2-dendritic cell axis

Liang Chi et al. Science. .

Abstract

Males and females exhibit profound differences in immune responses and disease susceptibility. However, the factors responsible for sex differences in tissue immunity remain poorly understood. Here, we uncovered a dominant role for type 2 innate lymphoid cells (ILC2s) in shaping sexual immune dimorphism within the skin. Mechanistically, negative regulation of ILC2s by androgens leads to a reduction in dendritic cell accumulation and activation in males, along with reduced tissue immunity. Collectively, our results reveal a role for the androgen-ILC2-dendritic cell axis in controlling sexual immune dimorphism. Moreover, this work proposes that tissue immune set points are defined by the dual action of sex hormones and the microbiota, with sex hormones controlling the strength of local immunity and microbiota calibrating its tone.


Conflict of interest statement

Competing interests: The authors declare that they have no competing interests.

Figures

Fig. 1.
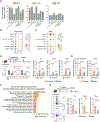
Fig. 1.. Females have higher T cell accumulation in the skin at steady state and in response to the microbiota and pathogen.
(A) Fold changes in absolute numbers of various lymphocyte cell populations, including Th17, Tc17, IL-17A± γδTCRlow, Th1, Tc1, GATA3± Treg and RORγt± Treg, in the ear skin, lung, and small intestine of female adult mice compared to males. (B) Fold changes in absolute numbers (represented by the size of the circles) and p value (represented by the color of the circles) of lymphocyte subsets in various tissues of germ-free females compared to males. (C) Fold changes in absolute numbers (represented by the size of the circles) and p value (represented by the color of the circles) of lymphocyte subsets n the skin of germ-free mice (GF), conventionalized germ-free mice (CV) and wildling mice (Wildling). (D-F) Adult females and males were topically associated with Staphylococcus epidermidis (S. epi) or left unassociated (Ctrl). (D) Left: Representative contour plots showing frequencies of CD8β+ T cells (gating at live CD45+ CD90.2+ TCRβ+ Foxp3) in S. epidermidis-associated females and males. Right: Bar graphs show absolute numbers of total CD8β+ T cells (Tc), IL-17A-producing (Tc17) or IFN-γ-producing CD8β+ T cells (Tc1) in the skin of per ear pinnae in unassociated and S. epidermidis-associated females and males. (E) Bar graphs show absolute number of IL-17A+ ©TCRlow cells and Th17 in unassociated and S. epidermidis-associated females and males. (F) Bulk RNA-seq of keratinocytes sorted from the skin of S. epidermidis-associated females and males. Bar graph represents the top 15 pathways by GO enrichment analysis enriched in keratinocytes from S. epidermidis-associated females compared to S. epidermidis-associated males. (G) Representative contour plots (left) showing frequencies of live CD45+ CD90.2+ TCRβ+ Foxp3 IL-17A-producing (Th17) or IFN-γ-producing (Th1) CD4+ T cells in females and males infected intradermally with Staphylococcus aureus (S. aureus). Bar graphs (right) show absolute numbers per ear pinnae of Th, Th17, and Th1 in S. aureus-infected females and males. (A-E and G) Data are representative of at least two independent experiments. Each dot represents an individual mouse (n=10–40 for A per sex, n=10 for D and E per sex, n=5–8 for B, C, F and G per sex). Numbers in representative flow plots indicate mean ± SD. * p < 0.05; ** p < 0.01; *** p < 0.001; **** p < 0.0001; ns, not significant (two-tailed unpaired Student’s t test for (A-C, G), two-way ANOVA for (D-E). See also fig. S1.
Fig. 2.
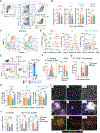
Fig. 2.. Sex immune differences within the skin are imposed by sex hormones.
(A) Fold changes in absolute numbers of lymphocyte subsets in the ear skin from 3- to 4- week-old mice (pre-mature) and 8- to 10-week-old (mature) mice. (B-C) 3-week-old females and males were castrated/ ovariectomized or had a sham surgery as control. Skin immune cells were analyzed at 8-weeks of age. Bar graphs show fold changes in absolute numbers of lymphocyte subsets in the skin of adult ovariectomized females (B) and adult castrated males (C) compared with adult control mice (sham surgery). (D) 3-week-old females and males were castrated or underwent sham surgery as control. S. epidermidis association was performed at 8-week-old and then immune reponses were analyzed at 10-week-old. (Left) Representative contour plots showing frequencies of CD8β+ T cells (gating at live CD45+ CD90.2+ TCRβ+ Foxp3) in adult females, males and castrated males (cas-♂) topically associated with S. epidermidis. (Right) Bar graphs show absolute numbers of total CD8+ T cells (Tc) and IL-17A-producing (Tc17) or IFN-γ-producing CD8+ T cells (Tc1) in S. epidermidis-associated females, males and castrated males (cas-Male). (E) Bar graphs show absolute numbers of IL-17A+ ©TCRlow cells and Th17 in S. epidermidis-associated females and males. Data are representative of at least two independent experiments. Each dot represents an individual mouse (n=15–30 per sex for A, n=3 per sex for B and C, and n=4–5 per sex for D and E). Numbers in representative flow plots indicate mean ± SD. * p < 0.05; ** p < 0.01; *** p < 0.001; **** p < 0.0001; ns, not significant (two-way ANOVA for (A), two-tailed unpaired Student’s t test for (B-C), one-way ANOVA for (D-E)).
Fig. 3.
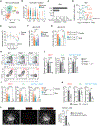
Fig. 3.. Dendritic cell homeostasis is regulated by sex hormones.
(A-D) Dendritic cell populations in the skin of adult females and males were analyzed by flow cytometry and scRNA-seq. (A) Representative contour plots of dendritic cell subsets within the skin of adult females and males. (B) Absolute numbers of DC subsets in adult females and males (see Fig S3A for gating strategy). LC = Langerhans cells. (C) UMAP projection plots show skin DC clusters analyzed by scRNA-seq (cell number: female: 5287; male: 5067). (D) Volcano plots display differentially expressed genes in cDC1, Langerhans cells (LC), and CD11blow cDC2 between adult females and males. Highly expressed genes in females are denoted in orange and highly expressed genes in males are denoted in teal. (E) (Left) Representative contour plots of FITC+ dendritic cells (DCs) within the skin-draining lymph nodes of adult females and males 2-day post FITC application. (Right) Bar graph shows absolute numbers of FITC+ DC subsets in adult females and males. LC = Langerhans cells. (F) (Left) Histogram plot shows the expression level of CD83 in FITC+ DCs. (Right) Bar graph shows MFI of CD83 in FITC+ DCs in females and males. (G) Bar graph shows frequencies of CD69+ OVA-specific CD8+ T cells after 18 hours of priming with skin OVA peptide-loaded cDC1 from females and males. (H) Fold change in absolute number of DC subsets in the skin of adult ovariectomized females (ova-Female), castrated males (cas-Male) and males (sham surgery) compared to females (sham surgery). (I) (Top) Representative confocal images of whole-mount ear pinnae of females, males, and castrated males (cas-♂) stained for CD11c. Scale bars: 30 μm. (Middle) Representative confocal images of whole-mount ear pinnae from females, males, and castrated males (cas-♂) shows dermal DC clusters stained for DAPI, CD11c, CD24, CD103, and CD11b. Scale bars: 200 μm. (Bottom) Representative confocal images of whole-mount ear pinnae from females, males, and castrated males (cas-♂) shows cDC1 stained for CD24 and CD103. Scale bars: 20 μm. Arrows point to cells co-expressing CD24 and CD103 (cDC1). (J) Surface area of CD11c+ DC clusters (left) and percentage of scanned area occupied by CD11c+ DC clusters (right). Data are representative of at least two independent experiments. Each dot represents an individual mouse except G in which each dot presents a vial of cells (n=10 per sex for B, n=5 per sex for C-F, and n=3–4 per sex for H-J). Numbers in representative flow plots indicate mean ± SD. * p < 0.05; ** p < 0.01; *** p < 0.001; **** p < 0.0001; ns, not significant (two-tailed unpaired Student’s t test for (B), one-way ANOVA for (E-F) and (I)).
Fig. 4.
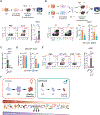
Fig. 4.. AR signaling in ILC2 regulates the homeostasis of skin dendritic cell network.
(A-D) Live CD45+ CD90.2+ γδTCRhi- cells from the skin of adult females and males were analyzed by scRNA-seq. (A) UMAP projection plot shows the major skin lymphoid cell subsets (cell number: 11797). (B) Expression levels of androgen receptor gene (Ar) in the major skin lymphoid cell subsets. (C) Number of differentially expressed genes in skin lymphoid cell populations between females and males with adjusted p value cutoff of 0.05. (D) Differentially expressed genes in skin ILCs between females and males. Highly expressed genes in females are denoted in orange and highly expressed genes in males are denoted in teal. (E-G) Flow cytometry analysis of ILC2 (live CD45+ CD90.2+ γδTCR TCRβNK1.1 GATA3+). (E) Absolute numbers of skin ILCs at various ages in females and males. (F) Absolute numbers of skin ILC2 in adult females, males (sham surgery) and castrated males (cas-Male). (G) Absolute numbers of skin ILC2 in Il7rcreArwt/Y, Il7rcreArfl/Y, Il7rcreArfl/wt and Il7rcreArfl/fl adult mice. (H) Representative contour plots showing frequencies of live CD45+ Lineage Ly6C CD64 CD11c+ MHC-II+ dendritic cell subsets within the skin of WT, Rag1−/−, and Rag2−/−γc−/− mice. (I) Absolute numbers of cDC1, Langerhans cells (LC), and CD11blow cDC2 within the skin of WT, Rag1−/−, and Rag2−/−γc−/−. (J) Absolute numbers of cDC1, Langerhans cells (LC), and CD11blow cDC2 within the skin of WT and Rag2−/−γc−/− females and males. (K) Absolute numbers cDC1, Langerhans cells (LC), and CD11blow cDC2 in the skin of anti-Thy1.2-treated mice and untreated control mice. (L) Left: Representative confocal images of whole-mount ear pinnae from Red5 females stained for CD11c. TdTom represents cells expressing IL-5. Scale bars: 50 μm. Right: Bar graph shows cell density of tdTomato+ cells within the DC cluster area and outside the DC cluster areas. Data are representative of at least two independent experiments. For bar graphs, each dot represents an individual mouse (n=5 for A-D and I, n=8 per sex for E-F, n=3–10 per sex for G, n=5–10 for J, n=3–5 for K, n=3 for L). Numbers in representative flow plots indicate mean ± SD. * p < 0.05; ** p < 0.01; *** p < 0.001; **** p < 0.0001; ns, not significant (two-tailed unpaired Student’s t test for (E) and (K-L), one-way ANOVA for (F) and (I), two-way ANOVA for (G) and (J)).
Fig. 5.
Fig. 5.. ILC2 control cDC1 in a GM-CSF-dependent manner.
(A) Skin ILC2 were sorted, expanded in vitro and intradermally injected in adult Rag2−/−γc−/− females. Control mice received PBS. Skin DC subsets were analyzed at day 7 post injection. Representative contour plots show cDC1 within the skin of PBS- and ILC2-injected Rag2−/−γc−/− females. Bar graphs show absolute numbers of cDC1. (B) Cultured ILC2 sorted from the skin of adult females and males were equally mixed and intradermally injected into adult Rag2−/−γc−/− females and males. Skin cDC1 were then analyzed by flow cytometry. Representative contour plots show cDC1 within the skin of Rag2−/−γc−/− females and males after injection of ILC2. Bar graph shows the frequencies and absolute numbers of live CD45+ Lineage Ly6C CD64 CD11c+ MHC-II+ CD24+ CD11blow CD103+ cDC1 in the skin. (C) Absolute numbers of skin ILC2 in WT, Csf2ra−/− and Csf2−/− mice. (D) Frequencies and absolute numbers of skin GM-CSF+ ILC2 (gating at live CD45+ CD90.2+ γδTCR TCRβ NK1.1 GATA3+ tdTomato+) in adult Csf2flox-tdTomato females and males. (E) Left: representative contour plots of skin cDC1 in adult Rag2−/−γc−/− females injected with PBS, ILC2 from WT females or ILC2 from Csf2−/− females. Right: Absolute numbers of skin cDC1 in Rag2−/−γc−/− females injected with PBS, ILC2 from WT females or ILC2 from Csf2−/− females. (F) Model of the role of androgen-DC-ILC2 axis in shaping sex dimorphism of skin immunity. Data are representative of at least two independent experiments. Each dot represents an individual mouse (n=5–7 for A, n=3–5 for B, n=5–10 for C, n=4–8 for D, and n=3–4 for E). Numbers in flow plots indicate mean ± SD. * p < 0.05; ** p < 0.01; *** p < 0.001; **** p < 0.0001; ns, not significant (two-tailed unpaired Student’s t test for (A-B) and (D), one-way ANOVA for (C) and (E)).

Comment in

  • Sex differences in tissue immunity.
    Puttur F, Lloyd CM. Puttur F, et al. Science. 2024 Apr 12;384(6692):159-160. doi: 10.1126/science.ado8542. Epub 2024 Apr 4. Science. 2024. PMID: 38574173

References

    1. Klein SL, Flanagan KL, Sex differences in immune responses. Nature Reviews Immunology 16, 626–638 (2016). - PubMed
    1. Scully EP, Haverfield J, Ursin RL, Tannenbaum C, Klein SL, Considering how biological sex impacts immune responses and COVID-19 outcomes. Nature Reviews Immunology 20, 442–447 (2020). - PMC - PubMed
    1. Chen W, Mempel M, Traidl-Hofmann C, Al Khusaei S, Ring J, Gender aspects in skin diseases. J. Eur. Acad. Dermatol. Venereol 24, 1378–1385 (2010). - PubMed
    1. Fink AL, Engle K, Ursin RL, Tang W-Y, Klein SL, Biological sex affects vaccine efficacy and protection against influenza in mice. Proceedings of the National Academy of Sciences 115, 12477–12482 (2018). - PMC - PubMed
    1. Mohammad I et al., Estrogen receptor α contributes to T cell–mediated autoimmune inflammation by promoting T cell activation and proliferation. Science signaling 11, eaap9415 (2018). - PubMed

Publication types