. 2024 May 15;112(10):1657-1675.e10.
doi: 10.1016/j.neuron.2024.03.007. Epub 2024 Apr 3.

Astrocyte-secreted neurocan controls inhibitory synapse formation and function

Affiliations

Astrocyte-secreted neurocan controls inhibitory synapse formation and function

Dolores Irala et al. Neuron. .

Abstract

Astrocytes strongly promote the formation and maturation of synapses by secreted proteins. Several astrocyte-secreted synaptogenic proteins controlling excitatory synapse development were identified; however, those that induce inhibitory synaptogenesis remain elusive. Here, we identify neurocan as an astrocyte-secreted inhibitory synaptogenic protein. After secretion from astrocytes, neurocan is cleaved into N- and C-terminal fragments. We found that these fragments have distinct localizations in the extracellular matrix. The neurocan C-terminal fragment localizes to synapses and controls cortical inhibitory synapse formation and function. Neurocan knockout mice lacking the whole protein or only its C-terminal synaptogenic domain have reduced inhibitory synapse numbers and function. Through super-resolution microscopy, in vivo proximity labeling by secreted TurboID, and astrocyte-specific rescue approaches, we discovered that the synaptogenic domain of neurocan localizes to somatostatin-positive inhibitory synapses and strongly regulates their formation. Together, our results unveil a mechanism through which astrocytes control circuit-specific inhibitory synapse development in the mammalian brain.

Keywords: astrocytes; chondroitin sulfate proteoglycans; extracellular matrix; inhibitory synaptogenesis; interneurons; in vivo TurboID; lecticans; neurocan; perineuronal nets; somatostatin.


Conflict of interest statement

Declaration of interests The authors declare no competing interests.

Figures

Figure 1:
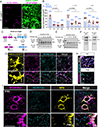
Figure 1:. NCAN induces inhibitory synaptogenesis in glia-free neuronal cultures.
(A) Neuronal culture assay and feeding schedule. (B) GABAergic interneurons labeled with VGAT. Scale bar, 50 μm. (C) Percentage of VGluT1+, VGAT+, GFAP+ cell types in glia-free neuronal cultures. Data are mean ± s.e.m. 20 images/condition/experiment. n=3 independent experiments. (D) Inhibitory synapses marked with Bassoon, VGAT, and Gephyrin. Scale bar, 15 μm. Insert scale bar: 2 μm. (E) Dose-response curve of ACM. Bassoon and Gephyrin mark inhibitory synapses. Scale bar: 20 μm. Insert scale bar: 5 μm. (F) Quantification of inhibitory synapses in E. Data are mean ± s.e.m. n=3 independent experiments, 20 cells/condition/experiment. One-way ANOVA, Dunnett’s post-test. (G) Dose-response curve of NCAN recombinant protein. Bassoon and Gephyrin mark inhibitory synapses. Scale bar: 25 μm. Insert scale bar: 5 μm. (H) Quantification of inhibitory synapses in G. Data are mean ± s.e.m. n=3 independent experiments, 20 cells/condition/experiment. One-way ANOVA, Dunnett’s post-test. (I) Dose-response curve of NCAN recombinant protein. Bassoon and Homer1 mark excitatory synapses. Scale bar: 25 μm. Insert scale bar: 5 μm. (J) Quantification of excitatory synapses in I. Data are mean ± s.e.m. n=3 independent experiments, 20 cells/condition/experiment. One-way ANOVA, Dunnett’s post-test.
Figure 2:
Figure 2:. NCAN is expressed by astrocytes and is processed into N- and C-terminal fragments.
(A) Detection of Ncan in cortical astrocytes. Scale bar 30 μm. (B) Quantification of Ncan total and astrocytic abundance at P7, P14, P21, and P30, in L1, L2–3, and L5 of the ACC. 6 images/layer/mice. 3 mice for each time point. Data are mean ± s.e.m. One-way ANOVA, Dunnett’s post-test. (C) Schematic of NCAN full-length and N-terminal and C-terminal fragments. Antibody epitopes are marked for each fragment. (D-E) Western blot of NCAN N- and C-terminal expression in cortical lysates. (F) Western blot of NCAN N- and C-terminal expression in ACM. (G) Staining of NCAN N- and C-terminal in the ACC of P7 Aldh1L1-GFP mice. Scale bar: 30 μm. Insert scale bar: 5 μm. (H) Staining of NCAN N- and C-terminal in the ECM at P7 and P30. Scale Bar: 15 μm. (I) STED image of NCAN N-terminal and C-terminal at PNNs marked with WFA. Scale bar: 15 μm. Insert scale bar: 10 μm.
Figure 3:
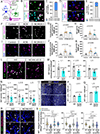
Figure 3:. NCAN loss impairs inhibitory synapse formation and function in vivo.
(A) Strategy to delete exons 3–4 in Ncan. (B) NCAN N- and C-terminal staining in P10 ACC of NCAN WT and KO mice. Scale bar: 30 μm. (C and D) Western blot of NCAN in cortical lysates from P10 NCAN WT and KO mice. (E) Schematic of L1, 2–3, and 5 in the ACC. (F) Excitatory synapses in ACC L5 of NCAN WT and KO mice. White arrows indicate excitatory synapses. Scale bar, 10 μm. (G, H, and I) Quantification of excitatory synapse numbers in NCAN WT and KO, normalized to the mean of WT. 5 images/section, 3 sections/mouse, 6 sex-matched littermate pairs. Data points represent mouse averages. Bars are mean ± s.e.m. Unpaired two-tailed t-test. (J) Inhibitory synapses in L2–3 of NCAN WT and KO mice. Scale bar, 10 μm. (K, L, M) Quantification of inhibitory synapse numbers in NCAN WT and KO, normalized to the mean of WT. 5 images/section, 3 sections/mouse, 6 sex-matched littermate pairs. Data points represent mouse averages. Bars are mean ± s.e.m. Unpaired two-tailed t-test. (N) EM images from NCAN WT and KO mice. Scale Bar: 2 μm. (O) Quantification of inhibitory synapses in NCAN WT and KO mice. 10 images/mouse, 3 sex-matched littermate pairs. Bars are mean ± s.e.m. Unpaired two-tailed t-test. (P) Scheme of electrophysiology recordings in the ACC. (Q) mIPSC traces from NCAN WT and KO mice. (R) Quantification of frequency average and cumulative probability of mIPSC from NCAN WT and KO neurons. n = 13 WT and 12 KO neurons. 4 mice/genotype. Kolmogorov-Smirnov test. Unpaired Two-tailed t-test. (S) Quantification of amplitude and cumulative probability from NCAN WT and KO neurons. n = 13 WT and 12 KO neurons. 4 mice/genotype. Kolmogorov-Smirnov test. Unpaired t-test. Data are presented as mean ± s.e.m.
Figure 4:
Figure 4:. NCAN C-terminal is synaptogenic in vitro.
(A) Scheme of NCAN full-length (FL), N-terminal-IL (IL) and C-terminal-ELS (ELS) recombinant proteins. SS: secretion signal. (B-C) Western blot of NCAN-FL, IL and ELS recombinant proteins. (D) Dose-response curve of NCAN-IL. Bassoon and Gephyrin mark inhibitory synapses. Scale bar: 15 μm. Insert scale bar: 5 μm. (E) Quantification of inhibitory synapses in D. Data are mean ± s.e.m. n=4 independent experiments, 20 cells/condition/experiment. One-way ANOVA, Dunnett’s post-test. (F) Dose-response curve of NCAN-ELS. Bassoon and Gephyrin mark inhibitory synapses. Scale bar: 15 μm. Insert scale bar: 5 μm. (G) Quantification of inhibitory synapses in F. Data are mean ± s.e.m. n=4 independent experiments, 20 cells/condition/experiment. One-way ANOVA, Dunnett’s post-test. (H) Western blot of NCAN N- and C-terminal in NCAN WT and KO ACM. (I) Rescue experiment with NCAN WT ACM, KO ACM, and recombinant proteins. Bassoon and Gephyrin mark inhibitory synapses. Scale bar: 15 μm. Insert scale bar: 5 μm. (J) Quantification of inhibitory synapses in I. Data are mean ± s.e.m. n=3 independent experiments, 20 cells/condition/experiment. One-way ANOVA, Dunnett’s post-test.
Figure 5:
Figure 5:. Inhibitory synaptogenesis is impaired in NCAN ΔELS mutant mice.
(A) Strategy to delete exons 9–14 from Ncan. (B) Scheme of NCAN WT protein and NCAN ΔELS mutant. (C) Excitatory synapses in ACC L5 of NCAN WT and ΔELS mice. Scale bar, 10 μm. (D) Quantification of excitatory synapse in NCAN WT and ΔELS mutants, normalized to the mean of WT in L1, L2–3, and L5. 5 images/section, 3 sections/mouse, 6 sex-matched littermate pairs. Data points represent mouse averages. Bars are mean ± s.e.m. Unpaired two-tailed t-test. (E) Inhibitory synapses in ACC L1 of NCAN WT and ΔELS mice. Scale bar, 10 μm. (F) Quantification of inhibitory synapse numbers in NCAN WT and ΔELS, normalized to the mean of WT in L1, L2–3, and L5. 5 images/section, 3 sections/mouse, 6 sex-matched littermate pairs. Bars are mean ± s.e.m. Unpaired two-tailed t-test. (G) Strategy used for rescue experiment in vivo. Scale bar: 150 μm. (H) Inhibitory synapses inside astrocyte territory. Scale bar: 40 μm. (I) Inhibitory synapses within astrocyte territory in L1 of NCAN WT and KO mice transduced with AAV-Control or AAV-NCAN-ELS. Scale bar, 10 μm. (J) Quantification of the density of inhibitory synapses in I. 5 astrocytes/mouse, 4 mice for each condition. Bars are mean ± s.e.m. One-way ANOVA, Tukey’s post-test.
Figure 6:
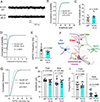
Figure 6:. NCAN ELS domain interactome contains proteins enriched at excitatory and inhibitory synapses.
(A) STED image of NCAN C-terminal, VGAT, and Gephyrin in P30 WT mice, ACC L2–3. Scale bar: 1 μm. (B) Percentage of NCAN C-terminal at inhibitory synapses. 3 sections/mouse, 3 WT mice. Bars are mean ± s.e.m. (C) STED image of NCAN C-terminal together, VGluT1, and Homer1 in P30 WT mice, ACC L2–3. Scale bar: 1 μm. (D) Percentage of NCAN C-terminal at excitatory synapses. 3 sections/mouse, 3 WT mice. Bars are mean ± s.e.m. (E) TurboID constructs. IgK leader: secretion signal. (F) TurboID approach. (G) Venn diagram of NCAN-IL and ELS extracellular proteome. (H) NCAN-ELS-TurboID extracellular proteome.
Figure 7:
Figure 7:. NCAN C-terminal fragment controls SST synaptogenesis.
(A) Scheme of SST+ and PV Syt2+ targeting glutamatergic neurons. (B) STED image of NCAN C-terminal, SST, and Gephyrin in P30 WT mice, ACC L2–3. Scale bar: 1 μm. (C) Percentage of NCAN C-terminal at SST+ synapses. 3 sections/mouse, 3 WT mice. Bars are mean ± s.e.m. (D) STED image of NCAN C-terminal, Syt2, and Gephyrin in P30 WT mice, L2–3. Scale bar: 1 μm. (E) Percentage of NCAN C-terminal at Syt2+ synapses. 3 sections/mouse, 3 WT mice. Bars are mean ± s.e.m. (F) SST+ synapses neuronal cultures treated with control, ACM, or ELS recombinant protein. Scale bar: 5μm. (G) Quantification of SST+ synapses from F. Data are mean ± s.e.m. n=3 independent experiments, 20 cells/condition/experiment. One-way ANOVA, Dunnett’s post-test. (H) Quantification of SST puncta from F. Data are mean ± s.e.m. n=3 independent experiments, 20 cells/condition/experiment. One-way ANOVA, Dunnett’s post-test. (I) Images of Syt2+ synapses in neuronal cultures treated with control, ACM, or ELS recombinant protein. Scale bar: 5μm. (J) Quantification of Syt2+ synapses from I. Data are mean ± s.e.m. n=3 independent experiments, 20 cells/condition/experiment. One-way ANOVA, Dunnett’s post-test. (K) Quantification of Syt2 puncta from F. Data are mean ± s.e.m. n=3 independent experiments, 20 cells/condition/experiment. One-way ANOVA, Dunnett’s post-test. (L) SST+ synapses in ACC L1 of NCAN WT and ΔELS mice. Scale bar, 10 μm. (M) Quantification of SST+ synapse density in NCAN WT and ΔELS, ACC L1, L2–3, and L5. 5 images/section, 3 sections/mouse, 6 sex-matched littermate pairs. Bars are mean ± s.e.m. Unpaired two-tailed t-test. (N) Quantification of SST puncta in NCAN WT and ΔELS, ACC L1, L2–3, and L5. 5 images/section, 3 sections/mouse, 6 sex-matched littermate pairs. Bars are mean ± s.e.m. Unpaired two-tailed t-test. (O) SST+ neurons in the ACC of NCAN WT and ΔELS mice. Scale bar: 150 μm. (P and Q) Quantification of SST numbers in L2–3 and L5 in NCAN WT and ΔELS mice. 1 image/section, 3 sections/mouse, 3 mice. Bars are mean ± s.e.m. Unpaired two-tailed t-test. (R) SST+ synapses within astrocyte territory in L1 of NCAN WT and KO mice transduced with AAV-Control or AAV-NCAN ELS. Scale bar, 10 μm. (S) Quantification of the density of SST+ synapses from R. 5 astrocytes/mouse, 4 mice for each condition. Bars are mean ± s.e.m. One-way ANOVA, Tukey’s post-test.
Figure 8:
Figure 8:. NCAN C-terminal controls inhibitory synaptic function.
(A) mIPSC traces from NCAN WT and ΔELS mice. (B and C) Quantification of amplitude and cumulative probability from NCAN WT and ΔELS mice pyramidal neurons. n = 10 WT and 10 ΔELS neurons. 3 mice/genotype. Kolmogorov-Smirnov test. Unpaired t-test. (D and E) Quantification of mIPSC frequency average and cumulative probability from NCAN WT and ΔELS mice pyramidal neurons. n = 10 WT and 10 ΔELS neurons. 3 mice/genotype. Kolmogorov-Smirnov test. Unpaired Two-tailed t-test. (F) Schematic of somatic and dendritic synaptic inputs on pyramidal neurons. (G) Quantification of cumulative frequency of mIPSC rise time in P30–35 NCAN WT and ΔELS littermates. n = 10 WT and 10 ΔELS neurons. 3 mice/genotype. Kolmogorov-Smirnov test. (H) Quantification of somatic and dendritic amplitude in P30–35 NCAN WT and ΔELS littermates. n = 10 WT and 10 ΔELS neurons. 3 mice/genotype. Unpaired Two-tailed t-test Data are mean ± s.e.m. (I) Frequency of somatic and dendritic events from NCAN WT and ΔELS mutant mice. n = 10 WT and 10 KO neurons. 3 mice/genotype. Unpaired Two-tailed t-test. Data are mean ± s.e.m.

Update of

References

    1. Froemke RC (2015). Plasticity of cortical excitatory-inhibitory balance. Annu Rev Neurosci 38, 195–219. 10.1146/annurev-neuro-071714-034002. - DOI - PMC - PubMed
    1. Lim L, Mi D, Llorca A, and Marin O (2018). Development and Functional Diversification of Cortical Interneurons. Neuron 100, 294–313. 10.1016/j.neuron.2018.10.009. - DOI - PMC - PubMed
    1. Favuzzi E, and Rico B (2018). Molecular diversity underlying cortical excitatory and inhibitory synapse development. Curr Opin Neurobiol 53, 8–15. 10.1016/j.conb.2018.03.011. - DOI - PubMed
    1. Bartolini G, Ciceri G, and Marin O (2013). Integration of GABAergic interneurons into cortical cell assemblies: lessons from embryos and adults. Neuron 79, 849–864. 10.1016/j.neuron.2013.08.014. - DOI - PubMed
    1. Kepecs A, and Fishell G (2014). Interneuron cell types are fit to function. Nature 505, 318–326. 10.1038/nature12983. - DOI - PMC - PubMed

LinkOut - more resources