. 2024 Apr 16;5(4):101490.
doi: 10.1016/j.xcrm.2024.101490. Epub 2024 Apr 3.

Synaptic injury in the inner plexiform layer of the retina is associated with progression in multiple sclerosis

Collaborators, Affiliations

Synaptic injury in the inner plexiform layer of the retina is associated with progression in multiple sclerosis

Christian Cordano et al. Cell Rep Med. .

Abstract

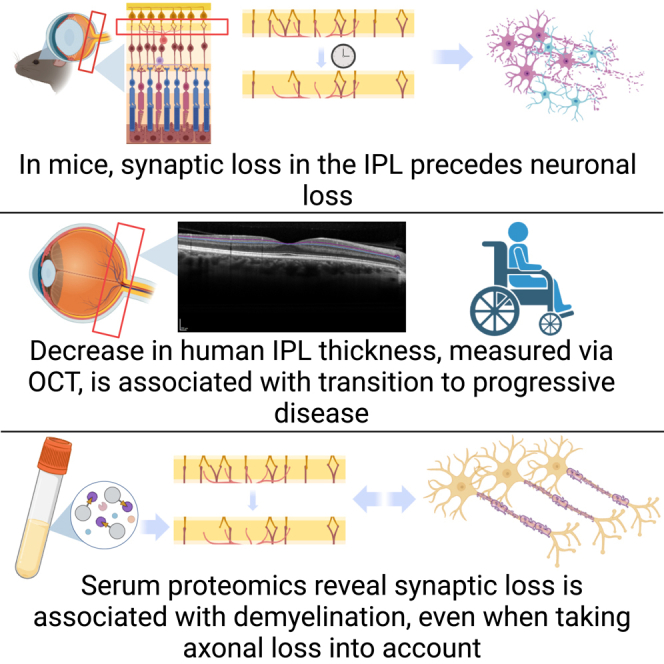
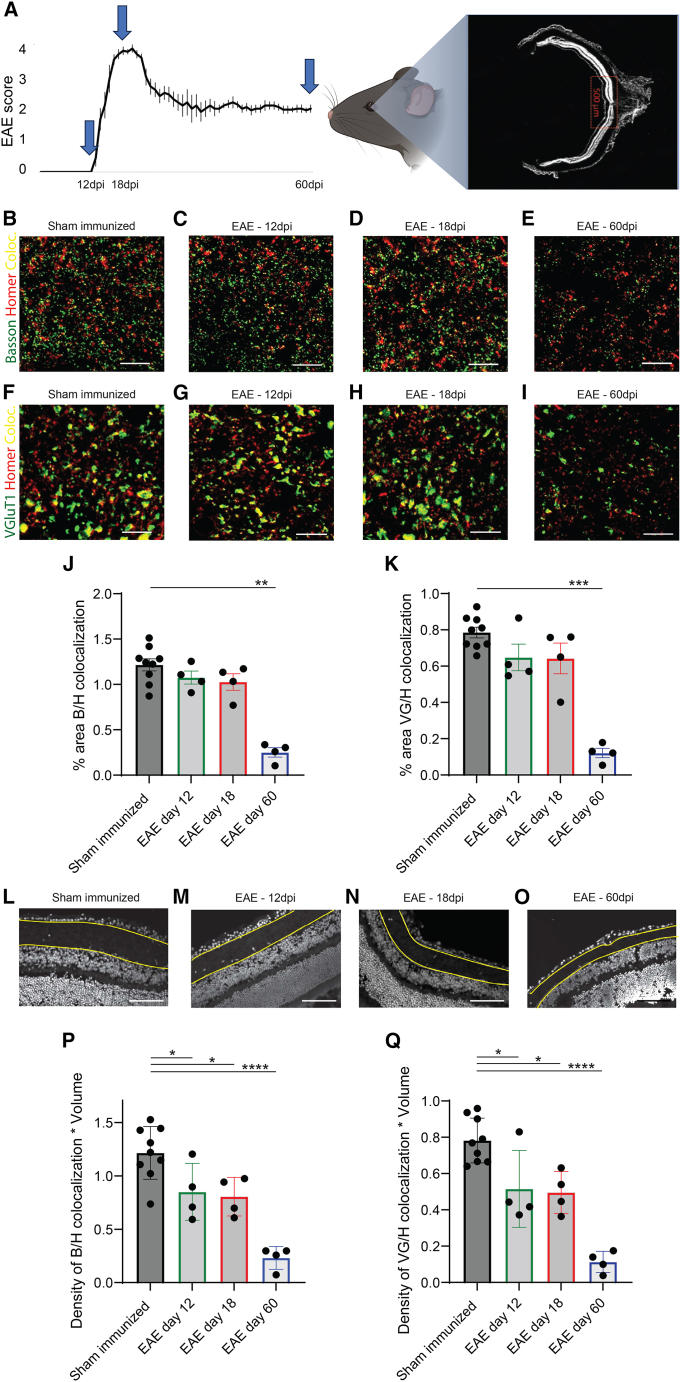
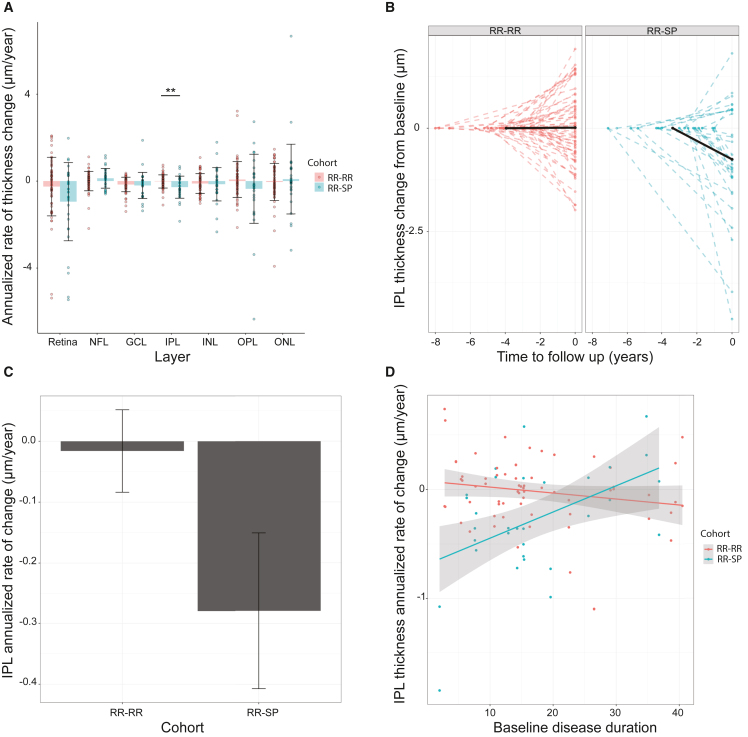
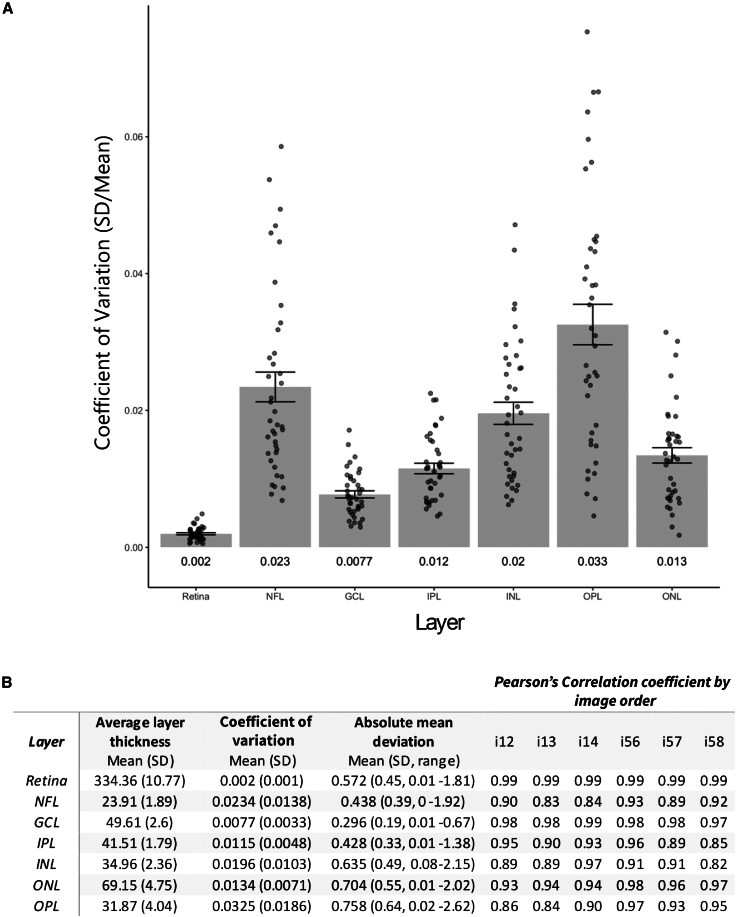
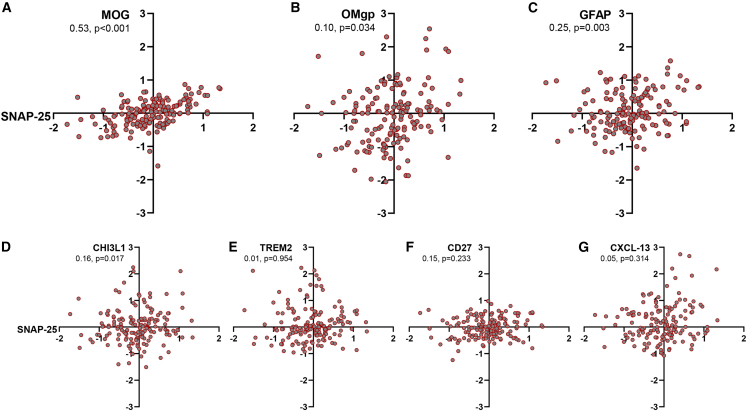
While neurodegeneration underlies the pathological basis for permanent disability in multiple sclerosis (MS), predictive biomarkers for progression are lacking. Using an animal model of chronic MS, we find that synaptic injury precedes neuronal loss and identify thinning of the inner plexiform layer (IPL) as an early feature of inflammatory demyelination-prior to symptom onset. As neuronal domains are anatomically segregated in the retina and can be monitored longitudinally, we hypothesize that thinning of the IPL could represent a biomarker for progression in MS. Leveraging our dataset with over 800 participants enrolled for more than 12 years, we find that IPL atrophy directly precedes progression and propose that synaptic loss is predictive of functional decline. Using a blood proteome-wide analysis, we demonstrate a strong correlation between demyelination, glial activation, and synapse loss independent of neuroaxonal injury. In summary, monitoring synaptic injury is a biologically relevant approach that reflects a potential driver of progression.

Keywords: EAE; blood biomarkers; demyelination; experimental autoimmune encephalomyelitis; optical coherence tomography; retina; serum proteomics; synaptic injury.


Conflict of interest statement

Declaration of interests The authors declare no competing interests.

Figures

None
Graphical abstract
Figure 1
Figure 1
IPL synaptic density/volume is decreased 12 dpi (A) Representation of an EAE score graph in a 60-day experiment (arrows indicate the timing of tissue collection). Synaptic density was calculated by analyzing the area in proximity of the optic nerve head for 12 EAE female mice and 9 sham-immunized mice at onset (12 dpi, four EAE mice and three sham-immunized mice), peak of disease (18 dpi, four EAE mice and three sham-immunized mice), and at a chronic stage (60 dpi, four EAE mice and three sham-immunized mice). (B–I) Staining for presynaptic inputs (Bassoon and VGluT1, green) and postsynaptic compartments (Homer 1, red) and colocalization of pre-and postsynaptic terminals (yellow) in sham-immunized mice (B and F), at 12 dpi (C and G), 18 dpi (D and H), and 60 dpi (E and I). Scale bar: 10 um. (J–K) Synaptic counts per area showed a trend toward reduction on day 12 and day 18 and on day 60 showed statistically significant synaptic loss. (L–O) Examples of retinal IPL segmentation from DAPI images: sham-immunized mice (L), 12 dpi (M), 18 dpi (N), and 60 dpi (O). Scale bar: 100 um. (P and Q) Quantification of the number of functional synapses per IPL volume, given by colocalization of both Bassoon/Homer (P) and VGlut1/Homer (Q) per IPL volume. ∗p < 0.05, ∗∗p < 0.01, ∗∗∗p < 0.001, ∗∗∗∗p < 0.0001. Technical replicates: for each animal, 3–4 stained retinal cross-sections at the level of the optic disc containing the central retina.
Figure 2
Figure 2
IPL change from baseline of the primary cohort (A) Annualized retinal layer percentage change for the primary cohort in percent per year. Bars represent mean, whiskers represent standard deviation, and points represent data from individual eyes. Red indicates patients with a stable relapsing-remitting disease course (RR-RR), while blue indicates patients who transitioned to secondary progressive disease on the study (RR-SP). Retina, full retinal thickness; NFL, nerve fiber layer; GCL, ganglion cell layer; IPL, inner plexiform layer; INL, inner nuclear layer; OPL = outer plexiform layer; ONL, outer nuclear layer. The p values were derived from a linear mixed-effects model adjusted for the random effect of patients. ∗∗p < 0.01. (B) IPL thickness change in total microns from the baseline exam, plotted against time to follow up in years. Negative values on the y axis represent loss of IPL thickness compared with baseline measurement, while positive values represent gain. Values on the y axis represent time in years preceding follow-up exam, with the follow-up exam date set at 0. Patients with RR-RR disease are depicted in red on the left side of the plot, while patients who transitioned to secondary progressive disease (RR-SP) on the study are represented in blue on the right. Dashed lines represent single-eye data points, while solid black lines represent average cohort values. (C) Rate of annualized (IPL) thickness change in total microns per year from the baseline exam of the primary analysis cohort (excluding patients treated with fingolimod), by disease cohort. Bars represent mean, while whiskers represent standard error (SE). (D) Rate of annualized (IPL) thickness change in total microns per year from the baseline exam of the primary analysis cohort, by disease duration at baseline. Red represents patients with RR-RR disease, while blue represents patients who transitioned to RR-SP disease in the study. Points represent single-eye data, while lines represent general linear models. Gray borders represent the SE of the linear model fit.
Figure 3
Figure 3
Retinal segmentation: CV by retinal layer (A) Coefficient of variance (CV), defined as the intra-eye standard deviation (SD) divided by the intra-eye mean, by retinal sublayer. Bars represent mean CV; whiskers represent SE of the CV, and points represent eye-level data. Numeric text under each bar displays the mean CV for each layer. (B) Group average thickness and intra-eye coefficient of variance, mean deviation, and Pearson’s correlations of the segmentation repeatability imaging cohort for each retinal sublayer. Average cohort layer thickness, intra-eye CVs (SD/mean) and absolute mean deviations, and Pearson’s correlation coefficients by image order for four images were acquired in sequence in each eye of 20 healthy controls in sequence. i12, comparison of the first and second image acquired; i13, first and third; i14 first and fourth; and so on. Images 1–4 were acquired in the right eye and 5–8 in the left.
Figure 4
Figure 4
Hypothesis-driven analysis from a proteome-wide measurement performed on 166 samples from PwMS enrolled in the ReBUILD trial (Olink, Uppsala, Sweden). Relative protein concentration is reported as normalized protein expression (NPX) on a log-2 scale for each protein. Mixed models were corrected for longitudinal sampling, age at screening, and sex. Synaptosome-associated protein of 25 kDa (SNAP-25) NPX showed a strong positive association with myelin oligodendrocyte glycoprotein (MOG) (A), oligodendrocyte glycoprotein (OMgp) (B), glial fibrillary acidic protein (GFAP) (C), and chitinase 3-like 1 (CHI3L1) (D). False discovery rate (FDR)-adjusted p values remained significant for MOG (0.005), GFAP (0.013), and CHI3L1 (0.023). Soluble triggering receptor expressed on myeloid cells 2 (sTREM2) (E), CD27 (F), and chemokine ligand 13 (CXCL-13) (G) did not correlate with SNAP-25 levels.

References

    1. Kappos L., Wolinsky J.S., Giovannoni G., Arnold D.L., Wang Q., Bernasconi C., Model F., Koendgen H., Manfrini M., Belachew S., Hauser S.L. Contribution of Relapse-Independent Progression vs Relapse-Associated Worsening to Overall Confirmed Disability Accumulation in Typical Relapsing Multiple Sclerosis in a Pooled Analysis of 2 Randomized Clinical Trials. JAMA Neurol. 2020;77:1132–1140. doi: 10.1001/jamaneurol.2020.1568. - DOI - PMC - PubMed
    1. Lublin F.D., Häring D.A., Ganjgahi H., Ocampo A., Hatami F., Čuklina J., Aarden P., Dahlke F., Arnold D.L., Wiendl H., et al. How patients with multiple sclerosis acquire disability. Brain. 2022;145:3147–3161. doi: 10.1093/brain/awac016. - DOI - PMC - PubMed
    1. Abdelhak A., Benkert P., Schaedelin S., Boscardin W.J., Cordano C., Oechtering J., Ananth K., Granziera C., Melie-Garcia L., Montes S.C., et al. MS EPIC, and the SMSC Study Teams Neurofilament Light Chain Elevation and Disability Progression in Multiple Sclerosis. JAMA Neurol. 2023;80:1317–1325. doi: 10.1001/jamaneurol.2023.3997. - DOI - PMC - PubMed
    1. Lassmann H. Multiple Sclerosis Pathology. Cold Spring Harb. Perspect. Med. 2018;8 doi: 10.1101/cshperspect.a028936. - DOI - PMC - PubMed
    1. Cree B.A.C., Arnold D.L., Chataway J., Chitnis T., Fox R.J., Pozo Ramajo A., Murphy N., Lassmann H. Secondary Progressive Multiple Sclerosis: New Insights. Neurology. 2021;97:378–388. doi: 10.1212/WNL.0000000000012323. - DOI - PMC - PubMed