. 2024 Jun 1:195:106492.
doi: 10.1016/j.nbd.2024.106492. Epub 2024 Apr 2.

Phenotypical, genotypical and pathological characterization of the moonwalker mouse, a model of ataxia

Affiliations

Phenotypical, genotypical and pathological characterization of the moonwalker mouse, a model of ataxia

Gabriella Sekerková et al. Neurobiol Dis. .

Abstract

We performed a comprehensive study of the morphological, functional, and genetic features of moonwalker (MWK) mice, a mouse model of spinocerebellar ataxia caused by a gain of function of the TRPC3 channel. These mice show numerous behavioral symptoms including tremor, altered gait, circling behavior, impaired motor coordination, impaired motor learning and decreased limb strength. Cerebellar pathology is characterized by early and almost complete loss of unipolar brush cells as well as slowly progressive, moderate loss of Purkinje cell (PCs). Structural damage also includes loss of synaptic contacts from parallel fibers, swollen ER structures, and degenerating axons. Interestingly, no obvious correlation was observed between PC loss and severity of the symptoms, as the phenotype stabilizes around 2 months of age, while the cerebellar pathology is progressive. This is probably due to the fact that PC function is severely impaired much earlier than the appearance of PC loss. Indeed, PC firing is already impaired in 3 weeks old mice. An interesting feature of the MWK pathology that still remains to be explained consists in a strong lobule selectivity of the PC loss, which is puzzling considering that TRPC is expressed in every PC. Intriguingly, genetic analysis of MWK cerebella shows, among other alterations, changes in the expression of both apoptosis inducing and resistance factors possibly suggesting that damaged PCs initiate specific cellular pathways that protect them from overt cell loss.

Keywords: Apoptosis; Calcium; Cerebellum; Endoplasmic reticulum; Neurodegeneration; Purkinje cells; Spinocerebellar ataxia; TRPC3; Unipolar brush cell.


Conflict of interest statement

Declaration of competing interest The authors declare no competing financial interest.

Figures
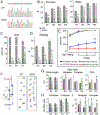
Fig. 1.
Fig. 1.. Motor deficits in MWK mice.
A) Heterozygous MWK mice were identified by A1903G transition (arrow) in the TRPC3 locus using DNA sequence analysis. B) MWK mice are ~50% lighter than the WT at 1 month of age. At later age points the weight difference between the WT and MWK decreases to ~20%. These differences are similar in female and male mice. C) In grip strength test the MWK mice fell off from a wire top within seconds after inversion. Young WT mice clung to the inverted wire top for the whole duration of the test (3 min). 3-month-old WT mice performed slightly worse than the younger WT, possibly because of their increasing body weight (see panel B). D) Rearing count assessed in a cylinder during 3 min testing showed that MWK mice rearing ability is severely impaired at all age points tested. E) Accelerating rotarod test of 2- and 3- month-old MWK and WT mice. MWK mice underperformed at every time point when compared to WT mice. However, 2-month-old MWK mice show a slight motor learning ability on the 3rd day of the testing. F—I) Footprint analysis of 2- and 3- month-old MWK and WT mice. F) The left schematic illustrates the measured parameters: a, stride length; b, step width; c, print length; d, contralateral paw placement distance measured at the ipsilateral stride length. The right panel shows representative paw prints of a WT and a MWK mouse. Hind- are fore-limbs are shown in blue and orange, respectively. G) MWK mice have shorter stride length, wider step width and longer print length in comparison to WT mice. H) Stride Length/Step Width (SL/SW) ratio is significantly reduced in MWK mice in comparison to WT. I) Contralateral paw placement (“d” in panel F schematic) expressed as absolute deviation from the expected “50%” placement along the ipsilateral step (exact middle of the ipsilateral stride length; distance “a” in schematic). MWK mice have a wider range of contralateral paw placements compared to WT. Asterisks in B-E and G-H represent p < 0.05 obtained by One-Way-ANOVA and Tukey’s post hoc analysis. The exact p values are provided in Supplementary Table 1.
Fig. 2.
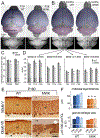
Fig. 2.. Cerebellar size is reduced in MWK mice.
A-B) Whole-mount images of the whole brain illustrate the reduction of the cerebellar size in P18 and 3-month-old MWK mice. In the top panels the cortex (purple) and the cerebellum (pink) are pseudo-colored to highlight these structures. C) The cerebellum to cortex ratio is significantly decreased in MWK in comparison to WT. This ratio is the same for female and male mice. D) Measurements in 4 different sagittal sections sampled along the medio-lateral axis show consistent reduction of the MWK cerebellar areas at every studied age. The dashed lines in B (bottom row) represent the approximate locations of the 4 sections. E) Representative images of the MWK and WT mice molecular layers (ml) in lobule V and VII at 6 months of age. CaB immunolabeling. Arrowheads point to PC somata. On the MWK images, lobules VI and VIII are artificially masked in Photoshop to keep lobules V and VII in visual focus. F) Top panel: The molecular layer of the MWK mice is significantly thinner compared with WT. The thickness of the molecular layer in MWK mice does not change with age. Bottom panel: The granule cell layer area is slightly but not significantly decreased in MWK mice. Asterisks in C-E represent p < 0.05 obtained by One-Way-ANOVA and Tukey’s post hoc analysis. The exact p values are shown in Supplementary Table 1.
Fig. 3.
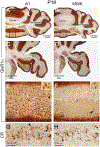
Fig. 3.. The cerebellum of a P18 MWK mouse lacks UBCs.
A-F) mGluR1α immunolabeling of coronal cerebellar sections shows even immunostaining (brown labeling) of PC dendrites in the molecular layer of WT and MWK mice. WT cerebella contain high densities of mGluR1α-positive type II UBCs in lobule X (A,E), ventral lobule IX (A), flocculus (Fl; C), and ventral paraflocculus (PFl; C). Type II UBCs are rare in MWK cerebellum (B,D,F). G,H) Calretinin (CR) immunolabeling of coronal cerebellar sections illustrates the reduction of the calretinin-positive type I UBCs in the MWK lobule X. Arrowheads in E-H point to UBCs that are enlarged in the insets of the same image.
Fig. 4.
Fig. 4.. In MWK cerebellum, UBCs, but not PCs, undergo apoptosis in early postnatal development.
A) cCasp3 (red) and CaB (green) immunolabeling in P18 MWK cerebellum. The granule cell layer (gcl) of lobule X and ventral lobule IX contains numerous apoptotic UBCs (arrowheads). Apoptosis was not detected in the PCs at this age. B) A rare apoptotic PC labeled with cCasp3 (red) and CaB (green) in lobule V of a P150 MWK mouse. C—F) cCasp3 (brown; C,D) and TUNEL labeling (green; E,F) in the cerebellar lobule X of P18 WT (C,E) and MWK (D,F) mice. Several apoptotic cells (arrowheads) are present in the MWK granule cell layer (gcl; D,F) but not in the WT (C,E). G) Few apoptotic cells (arrowheads; red) are still present in P26 MWK lobule X. H) Apoptotic cells are not detectable in P150 MWK lobule X. Sections used for images in panels B and H are from the same animal, ml, molecular layer; Pcl, Purkinje cell layer.
Fig. 5.
Fig. 5.. PC loss in the MWK cerebellum is lobule-specific and progressive.
CaB immunolabeling of WT (A,E) and MWK cerebella (B—D, F-G) illustrates the gradual PC loss in cerebellar lobules. A-D) Lobules VI-VIII in sagittal sections. At P40 the density of the PCs (arrowheads) in MWK cerebella (B) is similar to WT (A). At P120 the PC loss is clearly noticeable in lobule VII (C) and becomes prominent at P180 in lobules VII and VIII (D). gcl, granule cell layer; ml, molecular layer; wm, white matter. E-F) Coronal sections illustrating flocculus (Fl), paraflocculus (PFl), and crus I (CI). PC loss is more prominent in the PFL than in the other lobules (F,G). CN, cerebellar nuclei. H) Coronal section from a P100 MWK illustrates overt PC loss in Copula (Cop) and Crus II/Paramedian lobule (CII/PM). PC loss is not obvious in the other lobules shown in the image; lobules, IV/V, VI, X, Simplex (Sim), and Crus I (CI). CN, cerebellar nuclei.
Fig. 6.
Fig. 6.. Quantitative assessment of PC loss in MWK mice.
A) At P40, PC density is similar in WT and MWK mice. At P120 and P180 PC density is significantly reduced in the posterior, but not in the anterior, lobules and in lobule X. The anterior lobules show minor PC density decrease at P180. This pattern in PC density changes is observed in both vermal and hemispheral regions. We grouped lobule simplex with anterior lobules (Ant+Sim) as they both show similar PC density. Asterisks represent p < 0.05 obtained by One-Way-ANOVA and Tukey’s post hoc analysis. The exact p values are shown in Supplementary Table 1. B) Heatmap of PC densities illustrates PC loss in cerebellar lobules. The colour code represents PC loss using dark blue (0 PC loss) to red (100% PC loss). The exact PC density values in individual lobules are provided in Supplementary Fig. 3. Roman numerals I-X, cerebellar lobules; A, anterior; CI, crus I; CII, crus II; Cop, Copula; PM, Paramedian lobule; S, Simplex; S + C, Simplex and Crus.
Fig. 7.
Fig. 7.. PC axonal swellings (torpedoes) in MWK cerebellum.
A) Number of the torpedoes increases with the age of MWK mice. Asterisks represent p < 0.05 obtained by One-Way-ANOVA and Tukey’s post hoc analysis. Exact p values are shown in Supplementary Table 1. B,C) CaB immunostaining in WT (B) and MWK (C) cerebella reveals the PC axonal torpedoes in the granule cell layer of lobule VII. In WT (B) PC axons are thin (arrows) with occasional small developmental torpedoes (inset in B) at P40. In contrast, PC axons appear swollen in MWK cerebella (C), especially at P180, when only a few PC axons are still thin (arrow in image MWK-P180). At P40, PC torpedoes (arrowheads) in MWK are more prominent (inset in C) than the developmental torpedoes in the age-matched WT. The torpedoes increase in size with the increasing age of the animal. D) Graphs illustrating the correlation between the occurrence of torpedoes (blue) and PC loss (orange). The grey shaded area represents posterior cerebellum. Roman numeral I-X; cerebellar lobules; A, anterior; CI, crus I; CII, crus II; Cop, Copula; PM, Paramedian lobule; S, Simplex; S + C, Simplex and Crus.
Fig. 8.
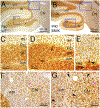
Fig. 8.. Silver impregnation reveals degenerating neurons in MWK but not in the WT cerebella.
A,B) Low magnification images of lobule X, IX and cerebellar nuclei (CN) from WT (A) and MWK (B) mice at P40. C-G) Higher magnification images from the boxed areas in panels A and B (C,D,F,G) and from lobule III (E). In WT cerebella (C,F) only non-specific, fine silver precipitates (bluish staining; magenta arrows in F) are detectable, mostly over cerebellar nuclei (CN) neurons (F). This precipitate is also observed in MWK (magenta arrows in G) cerebella and is considered as a staining artefact. In MWK cerebella the granule cell layer (gcl) in lobule X (D) contains multiple degenerating cells (black staining; arrows). A degenerating PC (arrowhead) in MWK cerebellum (E). The remnants of the degenerating PC arbor are still recognizable in the molecular layer (ml). The MWK cerebellar white matter (wm) and cerebellar nuclei (CN) contain several degenerating fibers (bluish-black staining; arrowheads in G). ml, molecular layer; Pcl, Purkinje cell layer.
Fig. 9.
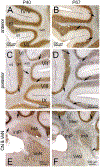
Fig. 9.. PC axonal degeneration increases with MWK mice age.
A,B) In the anterior lobules I-V the degenerating fibers in the white matter (wm) are not detectable until P67 (bluish-black staining; arrows in B). C,D) The white matter of the posterior lobules VI-IX contained multiple degenerating fibers (arrows in C) already at P40. The number of the degenerating fibers (arrows in D) visibly increased at P67. E,F) At P40, the degenerating fibers are present in the white matter of the posterior cerebellar lobules (arrows in E) as well as in the cerebellar and vestibular nuclei (VeN). The anterior interposed cerebellar nucleus (IntA) contained the least of the degenerating fibers (E). At P67 the degeneration was massive and present in the white matter of all lobules (arrows in F). The degenerating fibers appear to be evenly distributed in all cerebellar nuclei (F). A thin band of posterior interposed cerebellar nucleus; Med, medial cerebellar nucleus; ml, molecular layer; wm, white matter.
Fig. 10.
Fig. 10.. TRPC3 MWK mutation impairs PC firing.
A) Cell-attached recordings from acute slices reveal 3 types of electrophysiological activity in PCs from MWK mice. B) The relative frequency of occurrence of these firing patterns in MWK slices is age dependent. In contrast, all WT PCs show spontaneous regular firing. C) The average firing frequency in WT cells was 26.9 ± 5.0 Hz (6 cells). At P19, 7 of 11 MWK PCs were silent; the 4 (of 11) that were spontaneously active, fired at a frequency similar to WT cells. At P90 MWK PCs showed either no spontaneous activity (12 of 15 cells) or fired at higher frequency (63.5 ± 4.7 Hz; 3 of 15 cells). D) All silent MWK PCs could fire in response to depolarizing current injections when held at hyperpolarized membrane potential with injection of bias current.
Fig. 11.
Fig. 11.. Altered gene expression in MWK mouse cerebellum.
A) Volcano plot showing the genes up- and downregulated in MWK compared with WT cerebellum. Mutation or lack of the genes depicted on the plot were reported to cause motor dysfunction/ataxia in several human SCA, in SCA mouse models, and ataxic mutant rodents. Many genes are also differentially regulated in SCA models (SCA1 and SCA2) and P18 laser captured MWK PC (e.g. Opn3, Svc2, Stk17b, Dgkh, Fgf7 and Doc2b; Dulneva et al., 2015). Magenta and green dots represent PCs and granule cells, respectively. B,C) Top 15 affected biological processes and cellular component identified using DAVID (Database Annotation Visualization Integrated Discovery) enrichment analysis of genes differentially expressed in MWK cerebellum. Additional terms for both enrichment categories and the exact p values are shown in Supplementary Tables 3 and 4.
Fig. 12.
Fig. 12.. PC dendritic spine pathology in MWK cerebella.
A-D) TEM images from lobules X (A,B) and VII (C,D) molecular layer (middle region) in P40 (A,B) and P85 (C,D) WT (A,C) and MWK (B,D) mice. PC dendrites (D) and dendritic spines are highlighted in blue colour, and parallel fiber terminals are highlighted in green. Typical WT fields enriched in dendritic processes (A,C) show multiple spines in contact with parallel fiber terminals. In contrast, similar fields from MWK mice show decreased synaptic connection between dendritic spines and parallel fiber terminals (B,D). The depict areas also show unusually high density of dendritic processes (B,D). Some dendritic processes in the MWK mouse are also unusually shaped (B), some resembling filopodia rather than dendritic spines. Additionally, the ER in the MWK PC dendritic trunks as well as the dendritic processes are swollen (arrowheads in B,D). Some ER in WT mice also appears more rounded (arrows in A, C). We counted these as “swollen” ER as it is hard to distinguish these physiological ER structures from the pathological ER swellings without 3D reconstruction. E,F) Quantification of PC spine pathology shows a significant decrease in PC-parallel fiber synapses (E, left panel) and significant increase of swollen ER (F, left panel). Right panels in E and F illustrate the distribution of the PC-parallel fiber synapses and swollen ER in 54 MWK (from 3 mice) and 36 WT (from 2 mice) fields (y axis) analyzed from lobule VII at P85. For each field we counted the percentage (x axis) of the spines with parallel fiber synapses and swollen ER. Unpaired t-test; p = 0.02 (asterisk in E), p = 0.014 (asterisk in F).
Fig. 13.
Fig. 13.. Timeline of the behavioral (blue, top) and pathological (green, bottom) changes in MWK mouse.
*, the minor improvement in ataxic phenotype refers to decreased tremor and increased rearing ability. ML, molecular layer.

Similar articles

References

    1. Ageta-Ishihara N., et al., 2015. A CDC42EP4/septin-based perisynaptic glial scaffold facilitates glutamate clearance. Nat. Commun 6, 10090. - PMC - PubMed
    1. Amaral MD, Pozzo-Miller L, 2007. TRPC3 channels are necessary for brain-derived neurotrophic factor to activate a nonselective cationic current and to induce dendritic spine formation. J. Neurosci 27, 5179–5189. - PMC - PubMed
    1. Anders S, et al., 2015. HTSeq–a Python framework to work with high-throughput sequencing data. Bioinformatics 31, 166–169. - PMC - PubMed
    1. Anzilotti S., et al., 2015. Genetic ablation of homeodomain-interacting protein kinase 2 selectively induces apoptosis of cerebellar Purkinje cells during adulthood and generates an ataxic-like phenotype. Cell Death Dis. 6, e2004. - PMC - PubMed
    1. Arsović A., et al., 2020. Mouse Ataxin-2 expansion downregulates CamKII and other calcium signaling factors, impairing granule-Purkinje neuron synaptic strength. Int. J. Mol. Sci 21. - PMC - PubMed

Publication types