. 2024 May 8;44(19):e1544232024.
doi: 10.1523/JNEUROSCI.1544-23.2024.

The Intellectual Disability Risk Gene Kdm5b Regulates Long-Term Memory Consolidation in the Hippocampus

Affiliations

The Intellectual Disability Risk Gene Kdm5b Regulates Long-Term Memory Consolidation in the Hippocampus

Leticia Pérez-Sisqués et al. J Neurosci. .

Abstract

The histone lysine demethylase KDM5B is implicated in recessive intellectual disability disorders, and heterozygous, protein-truncating variants in KDM5B are associated with reduced cognitive function in the population. The KDM5 family of lysine demethylases has developmental and homeostatic functions in the brain, some of which appear to be independent of lysine demethylase activity. To determine the functions of KDM5B in hippocampus-dependent learning and memory, we first studied male and female mice homozygous for a Kdm5b Δ ARID allele that lacks demethylase activity. Kdm5b Δ ARID/ Δ ARID mice exhibited hyperactivity and long-term memory deficits in hippocampus-dependent learning tasks. The expression of immediate early, activity-dependent genes was downregulated in these mice and hyperactivated upon a learning stimulus compared with wild-type (WT) mice. A number of other learning-associated genes were also significantly dysregulated in the Kdm5b Δ ARID/ Δ ARID hippocampus. Next, we knocked down Kdm5b specifically in the adult, WT mouse hippocampus with shRNA. Kdm5b knockdown resulted in spontaneous seizures, hyperactivity, and hippocampus-dependent long-term memory and long-term potentiation deficits. These findings identify KDM5B as a critical regulator of gene expression and synaptic plasticity in the adult hippocampus and suggest that at least some of the cognitive phenotypes associated with KDM5B gene variants are caused by direct effects on memory consolidation mechanisms.

Keywords: KDM5B; chromatin; hippocampus; histone lysine demethylase; learning; memory; mouse.


Conflict of interest statement

The authors declare no competing financial interests.

Figures
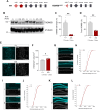
Figure 1.
Figure 1.
Kdm5bΔ/Δ mice express reduced total KDM5B levels and show increased number of H3K4me3-positive cells in the hippocampus. A, Schematics of WT and KDM5BΔARID protein domains. The mutant allele results in a truncated carboxyl end of the JmJN domain (JmjN-T) together with a deletion of the entire ARID domain. B, Representative Western blot images from WT (+/+) and homozygous (Δ/Δ) mutant mice postnatal Day 5 hippocampal samples showing the lack of full-length KDM5B protein in cortical samples from Δ/Δ mice. α-Tubulin was used as a loading control. Full-length KDM5B (arrowhead) and truncated ΔARID (asterisk) protein bands are indicated. See Extended Data Figure 1-1 for uncropped blot. MW markers in kDa are shown on the left. Female (squares) and male (diamonds) samples are included, although no sex differences were observed. C,D, Quantification of full-length and total (full-length and truncated) KDM5B protein from B. E,F, Quantification of the density of H3K4me3+ (cyan) cells in the hippocampus of 8-week-old WT and mutant mice. Nuclei were counterstained with DAPI (gray). Scale bar, 50 µm. Female (squares) and male (diamonds) samples are included, although no sex effect was observed. H,J,L, Cumulative frequencies of H3K4me3-positive cells as a function of their staining intensity. Cumulative probability was calculated including all the detected cells (CA1, 406–903 cells; CA3, 236–925 cells; DG, 925–2,491 cells; 4 animals/genotype). G,I,K, Representative H3K4me3 (cyan) immunostaining of hippocampal sections in 8-week-old control and mutant mice. Sections were counterstained with DAPI (gray). Scale bar, 200 µm. Data in C,D,F is shown as mean ± SEM and is analyzed with Student's t test. *p < 0.05, **p < 0.01.
Figure 2.
Figure 2.
Kdm5bΔ/Δ homozygous mice are viable but exhibit growth retardation and increased brain:body weight. A, Homozygous mutants are viable and present at expected Mendelian ratios at P21; n = 128; chi2, p = 0.9207. Similar Mendelian rates are observed when analyzing males and females separately (males: 25.38% +/+, 51.52% Δ/Δ, 23.11% Δ/Δ; females: 27.96% +/+, 47.67% Δ/Δ, 24.37% Δ/Δ). B, Preweaning body weight (g) measurements show decreased body weight in mutant animals. C–F, Body and brain weight, and brain:body and liver:body weight ratios are shown for +/+ (n = 11) and Δ/Δ (n = 13) P21 mice. G, Representative images of brains from WT and homozygous mutant mice indicating similar sizes. H, General cortical brain architecture is not affected in homozygous animals. Representative images of cortical brain sections, where nuclei visualized with Hoechst3332 are shown. Scale bar, 50 µm; n = 13 +/+ and n = 14 Δ/Δ animals. I, Layer thickness was measured in the somatosensory cortex. J, Golgi-cox–stained proximal basal and apical dendrites of CA1 pyramidal neurons and apical dendrites of DG granule cells in the dorsal hippocampus were analyzed. Graphs depict the average spine density per animal (10–20 dendrites/hippocampal region). Images show representative Golgi-Cox–stained dendrites. Scale bar, 2.5 µm. N = 6 mice/genotype. Data is shown as mean ± SEM, including female and male mice. Data was analyzed with two-way ANOVA (B,I) or Student's t test or Mann–Whitney test when appropriate (C–F,J). *p < 0.05, **p < 0.01.
Figure 3.
Figure 3.
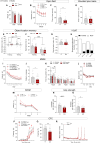
Kdm5bΔ/Δ homozygous mice exhibit hyperlocomotion and learning deficits. A, Body weight differences in 2-month-old mice before the start of the behavioral tests. Two-way ANOVA genotype effect, ****p < 0.0001; sex effect, ***p < 0.001. B, Distance moved (cm) in the outer zone of the open-field arena. Two-way ANOVA genotype effect: ***p = 0.0005. Three-way ANOVA sex effect: p = 0.33. C, The amount of time (s) in the inner zone of the open field is shown. Two-way ANOVA genotype effect, **p = 0.0087; sex effect, *p = 0.0107. D, Time (%) spent in the open arms in the EPM, indicative of reduced anxiety. Two-way ANOVA genotype effect, p = 0.8675; sex effect, p = 0.4664. E, DI during the training and test (24 h) phases in the OLM test to analyze long-term spatial memory. Note significant learning in WT mice compared with training, but no significant learning in Kdm5bΔ/Δ mutants, and the reduced DI on testing session between the two genotypes. Two-way ANOVA interaction effect: **p = 0.0057. Two-way ANOVA sex effect: p = 0.6317 (training) and p = 0.9086 (testing). F, There are no genotype differences in total exploration time (s) during training nor testing session in the OLM test. Two-way ANOVA genotype effect, p = 0.2105 (training) and p = 0.5919 (testing), and sex effect, p = 7,506 (training) and p = 0.2431 (testing). G, DI during the testing session of the Y-SAT, performed 1 h after training to assess short-term spatial memory. Two-way ANOVA sex effect: p = 0.0768. H, Spontaneous alternation rate in the Y-SAT shows no differences between genotypes. I, Latency (s) to reach the hidden platform during the training phase of the MWM. Data represents the mean of the four trials/day. Two-way ANOVA genotype effect: ***p = 0.0001. Three-way ANOVA sex effect: p = 0.0019. J,K, Graphs show the number of platform crossings (J) and time spent (%) in the different quadrants (K) during the probe trial performed on Day 8. Chance, 25%, is depicted with a dashed line. Two-way ANOVA sex effect in J: p = 0.3413. L, Swimming speed (cm/s) was similar between genotypes during the training phase of the MWM. Three-way ANOVA sex effect, p = 0.0757; genotype effect, p = 0.1008. M, Latency (s) to find the platform during the visible phase of the MWM. Three-way ANOVA genotype effect, *p = 0.0220; sex effect, p = 0.1982. N,O, Front- and hindlimb grip strength (gm) was tested three times and the average is shown. Two-way ANOVA sex effect: p = 0.1118 (N) and p = 0.1924 (O). P, Freezing behavior was assessed during CFC training, when three shocks were administered. Three-way ANOVA sex effect, p = 0.07; genotype effect, ****p < 0.0001. Q, Freezing percentages in the context testing session, 24 h later. Two-way ANOVA sex effect: p = 0.1489. R, Mean speed was higher in mutant mice, in line with their reduced freezing behavior during training (two-way ANOVA genotype effect: **p = 0.0053). However, no differences were observed between genotypes during the 2-s-long foot shocks [Tukey's post hoc test: p = 0.9943 (shock 1); p > 0.9999 (shock 2); p = 0.9998 (shock 3)], thus discarding differences in sensitivity and responses to shocks as a contributing factor. Data was analyzed with two-way ANOVA (A,E,F) or repeated measures two-way ANOVA (B,I,L,M,P,R) followed by Tukey's post hoc test. Data in C,J,K,N,O,Q was analyzed with Student's t test, or Mann–Whitney test when appropriate. *p < 0.05, **p < 0.01, ***p < 0.001, ****p < 0.0001. A one-sample t test was used (K) to analyze whether time spent in the target quadrant was above chance. ##p < 0.01, ###p < 0.001, ####p < 0.0001. For all experiments, n = 17 +/+ male, n = 14 +/+ female, n = 17 Δ/Δ male, and n = 13 Δ/Δ female mice. Female (squares) and male (diamonds) samples are included.
Figure 4.
Figure 4.
Altered gene expression in Kdm5bΔ/Δ mice. Hippocampi were dissected from naive animals and RNAseq analyses were performed (n = 4 animals/genotype). A, Heatmaps show DEGs in WT control (+/+) and mutant (Δ/Δ) mice. Yellow, upregulated, and blue, downregulated in mutants. See Extended Data Table 4-1 for detailed RNA-sequencing data information. B, Volcano plot displaying baseline gene expression changes between WT and Kdm5bΔ/Δ homozygous mutant mice. Red and blue dots depict differentially up- and downregulated genes, respectively. Differentially expressed immediate early genes are labeled. C, Immediate early gene expression in the dorsal hippocampus from WT and Kdm5bΔ/Δ mice was analyzed by qPCR; n = 9 animals/genotype. Two-way ANOVA genotype effect, ***p = 0.0001. D, Immunostaining of sections from DG and CA3 with an Npas4-specific antibody (magenta), counterstained with DAPI (gray), is shown. White arrowheads indicate positive nuclei. E, The number of Npas4-positive cells (arrowheads) was quantified in mm2 areas of the CA3 and DG. Scale bar, 200 µm, 100 µm for higher magnification images; n = 10 mice/genotype. Data is shown as mean ± SEM, including both female and male mice. Data was analyzed with Student's t test (C,E): *p < 0.05, **p < 0.01.
Figure 5.
Figure 5.
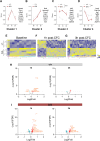
Learning-associated gene expression changes in Kdm5bΔ/Δ mice. WT (+/+) and Kdm5bΔ/Δ (Δ/Δ) mice were trained in the fear-conditioning chamber and culled 1 or 3 h later. Home cage, test-naive mice were used as controls. The dorsal hippocampus was dissected and RNAseq analyses were performed. n = 3 males and 3 females per genotype and timepoint. A–D, DEGs were clustered by their expression trajectories with k-means clustering (k = 4). Selected genes within each cluster are shown on the right. E–G, Heatmaps show DEGs in control and mutant mice at baseline levels (E) or 1 h (F) and 3 h (G) after fear conditioning. Yellow, upregulated, and blue, downregulated. H,I, Volcano plots display gene expression changes after conditioning. Red and blue dots depict differentially up- and downregulated genes, respectively, at 1 or 3 h compared with control animals for each genotype. Differentially expressed activity-regulated genes are labeled in orange. Data is shown as mean ± SEM, including female and male mice. Data was analyzed with repeated measures two-way ANOVA (A–D): ***p < 0.001, ****p < 0.0001. See Extended Data Figure 5-1, Table 5-1, and Table 5-2.
Figure 6.
Figure 6.
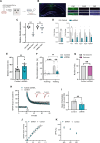
Kdm5b knockdown in the dorsal hippocampus (CA1) of adult mice abrogates hippocampus-dependent memory consolidation and diminishes LTP. A, Diagram of experimental workflow. Approximately 3 weeks after stereotactic viral delivery into CA1, mice were habituated and tested in the OLM task. Upon completion of behavioral tests, synaptic plasticity was assessed in acute brain slices from these mice. B, Representative immunostaining of the dorsal hippocampus transduced with GFP-expressing AAV1, 11 d after surgery. Scale bar, 200 µm. Panels display representative CA1, CA3, and DG inset images with GFP (green) and DAPI (blue) labeling. Scale bar, 50 µm. C, qRT-PCR analysis of Kdm5b expression, relative to Hprt, from the total RNA extracted from the dorsal hippocampus at indicated times (3 and 7 weeks after viral delivery). N = 3–5 mice/group. D, qRT-PCR analysis of Kdm5b and immediate early gene expression, relative to Hprt, from the total RNA extracted from the dorsal hippocampus, 11 d post-transduction. Two-way ANOVA shRNA effect for IEGs: **p = 0.0016. N = 3 mice/group. E, Distance moved (cm) in the test arena (open field) on the first day of habituation as a measure of general activity (n = 10 control and n = 10 shRNA females). F, DIs in the OLM task for control and shRNA mice during training and 24 h long-term memory tests are shown. Note significant learning in control mice compared with training, but no significant learning in shRNA mice compared with controls (n = 9 control and n = 9 shRNA female mice). Two-way ANOVA interaction effect: *p = 0.0257. G, Number of mice of each group (n = 10 each) showing spontaneous seizures during handling (pink) compared with no seizures (gray). Fisher's exact test: **p = 0.0031. H, Short- and long-term plasticity changes measured from hippocampal area CA1b apical dendrites in acute hippocampal slices (n = 8 slices from each group; n = 4 mice/group). Following a 20 min stable baseline recording, TBS (arrow) was delivered to induce LTP, and recordings were followed for an additional 1 h. The fEPSP slope measured from Kdm5b shRNA slices was noticeably lower relative to controls by the end of the recording period. Inset: representative traces collected during baseline (black line) and 60 min post-TBS (red line). Scale, 1 mV/5 ms. I, The mean potentiation 50–60 min post-TBS was significantly reduced in slices from Kdm5b shRNA mice relative to controls (**p = 0.0056; n = 8 each). J,K, Short-term plasticity measures in slices from Kdm5b shRNA mice including the (J) i/o curve and (K) paired-pulse facilitation did not reveal any significant differences from shScramble controls. Data are shown as mean ± SEM, analyzed with Student's t test (C,D,E,I), two-way ANOVA (F), and Fisher's exact test (G). *p < 0.05, **p < 0.01, ***p < 0.001. Control, shScramble; shRNA, shKdm5b.

References

    1. Aguilar-Valles A, Vaissiere T, Griggs EM, Mikaelsson MA, Takacs IF, Young EJ, Rumbaugh G, Miller CA (2014) Methamphetamine-associated memory is regulated by a writer and an eraser of permissive histone methylation. Biol Psychiatry 76:57–65. 10.1016/j.biopsych.2013.09.014 - DOI - PMC - PubMed
    1. Albert M, Schmitz SU, Kooistra SM, Malatesta M, Morales Torres C, Rekling JC, Johansen JV, Abarrategui I, Helin K (2013) The histone demethylase Jarid1b ensures faithful mouse development by protecting developmental genes from aberrant H3K4me3. PLoS Genet 9:e1003461. 10.1371/journal.pgen.1003461 - DOI - PMC - PubMed
    1. Bankhead P, et al. (2017) QuPath: open source software for digital pathology image analysis. Sci Rep 7:16878. 10.1038/s41598-017-17204-5 - DOI - PMC - PubMed
    1. Barrett RM, Malvaez M, Kramar E, Matheos DP, Arrizon A, Cabrera SM, Lynch G, Greene RW, Wood MA (2011) Hippocampal focal knockout of CBP affects specific histone modifications, long-term potentiation, and long-term memory. Neuropsychopharmacology 36:1545–1556. 10.1038/npp.2011.61 - DOI - PMC - PubMed
    1. Belalcazar HM, Hendricks EL, Zamurrad S, Liebl FLW, Secombe J (2021) The histone demethylase KDM5 is required for synaptic structure and function at the Drosophila neuromuscular junction. Cell Rep 34:108753. 10.1016/j.celrep.2021.108753 - DOI - PMC - PubMed

Publication types

MeSH terms

Substances