. 2024 Apr 22;11(4):ENEURO.0317-23.2024.
doi: 10.1523/ENEURO.0317-23.2024. Print 2024 Apr.

Transient Seizure Clusters and Epileptiform Activity Following Widespread Bilateral Hippocampal Interneuron Ablation

Affiliations

Transient Seizure Clusters and Epileptiform Activity Following Widespread Bilateral Hippocampal Interneuron Ablation

Mary R Dusing et al. eNeuro. .

Abstract

Interneuron loss is a prominent feature of temporal lobe epilepsy in both animals and humans and is hypothesized to be critical for epileptogenesis. As loss occurs concurrently with numerous other potentially proepileptogenic changes, however, the impact of interneuron loss in isolation remains unclear. For the present study, we developed an intersectional genetic approach to induce bilateral diphtheria toxin-mediated deletion of Vgat-expressing interneurons from dorsal and ventral hippocampus. In a separate group of mice, the same population was targeted for transient neuronal silencing with DREADDs. Interneuron ablation produced dramatic seizure clusters and persistent epileptiform activity. Surprisingly, after 1 week seizure activity declined precipitously and persistent epileptiform activity disappeared. Occasional seizures (≈1/day) persisted to the end of the experiment at 4 weeks. In contrast to the dramatic impact of interneuron ablation, transient silencing produced large numbers of interictal spikes, a significant but modest increase in seizure occurrence and changes in EEG frequency band power. Taken together, findings suggest that the hippocampus regains relative homeostasis-with occasional breakthrough seizures-in the face of an extensive and abrupt loss of interneurons.

Keywords: DREADDs; Vgat; diphtheria toxin; epileptogenesis; neuropeptide Y; parvalbumin.


Conflict of interest statement

The authors declare no competing financial interests.

Figures

Figure 1.
Figure 1.
A, Plasmid map for the FlpO-dependent (frt) mCherry reporter. B, Plasmid map for the frt-DTr expression vector. C, Plasmid map for the frt-hM4Di/HA (DREADD) expression vector. D, The specificity of Vgat-FlpO mice was tested by injecting animals with AAV9-frt-mCherry (red), immunostaining hippocampi with the GABAergic marker Gad67 (green), and counterstaining with DAPI (blue). mCherry and Gad67 are extensively colocalized in the dentate gyrus, with little to no labeling of excitatory granule cells. Scale bar, 200 µm. E, High resolution images show colocalization of mCherry in Gad67-immunoreactive hilar interneurons. Scale bar, 25 µm.
Figure 2.
Figure 2.
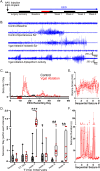
A, 24/7 video-EEG recording (blue line) began with a 1 week baseline, followed by 5 d of diphtheria toxin treatment (DT, red) and 4 weeks of post-treatment recording. B, EEG traces show background activity and a spontaneous seizure (Szr) observed during the period of diphtheria toxin treatment in a control animal (top two traces). An isolated seizure from a Vgat ablation mouse is shown in the middle trace. The bottom two traces show activity scored as persistent epileptiform activity in Vgat ablation mice, including a burst suppression-like pattern, and rapid sequences of convulsive seizures without recovery between events. C, Seizure number per recording day (mean ± SEM) showing seizure peaks in Vgat ablation mice in the first and third weeks after ablation. D, Box and whisker (min to max) plots showing seizure number per day during the six recording windows. Note the break in the y-axis. **p < 0.01; ***p < 0.001. E, Average behavioral seizure scores (mean ± SEM; modified Racine scale) by sequential seizure number for Vgat ablation mice. F, Average seizure duration (mean ± SEM) by sequential seizure number for Vgat ablation mice. Long duration events between seizure numbers ≈15–65 reflect periods of persistent epileptiform activity. Note the break in the y-axis.
Figure 3.
Figure 3.
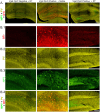
Dorsal–ventral series of coronal sections from two Vgat-FlpO–positive mice treated with saline. These mice express the DTr in the same pattern expected for Vgat ablation animals; however, since the mice were not treated with diphtheria toxin, the receptor is still present. The distribution of DTr expression is shown by immunostaining for the receptor (red). Strong expression is evident in the hippocampi of both animals. Scale bar, 1,000 µm. Additional details on the pattern of DTr expression are provided in Extended Data Figure 3-1.
Figure 4.
Figure 4.
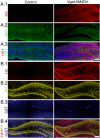
A, Confocal images of the hippocampal dentate gyrus showing DTr (red), parvalbumin (PV, yellow), and neuropeptide Y (NPY, green) immunostaining in control (Vgat-FlpO negative + DT, Vgat-FlpO positive + saline) and Vgat ablation mice (Vgat-FlpO positive + DT). Scale bar, 200 µm. B, Higher-resolution images of the dentate gyri shown in A. Scale bar, 100 µm. B.1, DTr immunoreactivity is absent in the FlpO-negative animal (left), while robust labeling is evident in the Vgat-FlpO–positive mouse treated with saline (middle). DTr immunoreactivity is largely absent from the Vgat ablation animal (right) after the death of expressing neurons. B.2, Small numbers of PV immunoreactive interneurons are evident in control mice (left, middle), while these neurons are absent following ablation (right). B.3, NPY immunoreactive hilar interneurons are present in large numbers in control mice (left, middle), while NPY immunoreactive cell bodies are absent after ablation. Increased NPY labeling in the hilus of the Vgat ablation mouse reflects upregulation of this peptide in granule cell mossy fiber axons. B.4, Merged channels show colocalization of DTr with PV and NPY immunoreactive interneurons in control mice (middle).
Figure 5.
Figure 5.
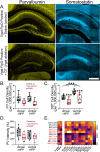
A, Parvalbumin (PV) and somatostatin (SST) immunostaining in the hippocampi of control and Vgat ablation mice. Reduced immunoreactivity is evident after ablation. Scale bar, 500 µm. B, Ablation significantly reduced the density of hippocampal PV neurons (p < 0.001, main effect of ablation). C, Ablation significantly reduced the density of hippocampal somatostatin (SST) neurons in both dorsal and ventral hippocampus. Cell counts also revealed an effect of level, with more SST cells present in ventral hippocampus. D, The intensity of PV immunostaining in dorsal and ventral hippocampus (HIPP), expressed as the percentage over PV signal intensity in corpus callosum, was significantly reduced after ablation. E, Heat map of PV immunostaining intensity (right y-axis, 0–600% over corpus callosum) for each Vgat ablation mouse (M1–M9) plotted against average data for controls (Con, top row). Numbers on the left y-axis give average seizures/day for each mouse. Red text indicates animals that developed persistent epileptiform activity. Columns give data for dorsal (D) and ventral (V) hippocampus (the same data plotted in B) and individual measures from left (L) and right (R) dentate gyrus (DG), CA3 and CA1. ***p < 0.001.
Figure 6.
Figure 6.
A, Parvalbumin (PV, yellow) and gephyrin (red) immunostaining shows perisomatic inhibitory inputs to granule cell somas (counterstained blue). Scale bar, 10 µm. B, C, The density of parvalbumin puncta surrounding granule cell somas, and the percentage of parvalbumin puncta apposed to gephyrin puncta (presumptive PV→granule cell synapses) is significantly reduced in Vgat ablation mice relative to controls. D, The density of gephyrin puncta, marking a postsynaptic component of inhibitory synapses, is preserved despite the dramatic loss of parvalbumin puncta. **p < 0.01.
Figure 7.
Figure 7.
A, Interneuron silencing protocol with saline (control) and CNO treatments interspersed by 2 and 5 d drug wash-out periods. B, EEG responses to CNO treatment from a control mouse, showing a normal EEG (top trace), and Vgat-hM4Di+ mice, showing ISs (middle trace), and a seizure (bottom trace) after CNO treatment. C, Box and whisker plots (interquartile range with minimum to maximum and individual animals plotted) show the dramatic increase in the frequency of ISs in Vgat-hM4Di+ mice treated with CNO (red triangles) relative to control animals (gray circles). Note the break in the y-axis. D, Box and whisker plots showing that CNO treatment significantly increased seizure occurrence in Vgat-hM4Di+ mice but had no effect in controls. E, The intensity of HA immunostaining in dorsal and ventral hippocampus (HIPP), expressed as the percentage over HA signal intensity in corpus callosum, was significantly increased in Vgat-hM4Di+ mice. F, Average seizure frequency following CNO treatment was significantly correlated with the intensity of HA immunostaining. *p < 0.05; **p < 0.01; ***p < 0.001.
Figure 8.
Figure 8.
A, Confocal images of the hippocampal dentate gyrus showing labeling for nuclear blue (blue), HA-tagged hM4Di+ receptors (A.1, red), and NPY (A.2, green) in control (Vgat-FlpO negative+ AAV9-hM4Di/HA) and Vgat-hM4Di+ mice (Vgat-FlpO–positive+ AAV9-hM4Di/HA). B, Confocal images from control and Vgat-hM4Di+ mice showing colocalization of HA (B.1, red) with parvalbumin (B.2, PV, yellow) and somatostatin (B.3, SST, blue). Scale bar, 100 µm.
Figure 9.
Figure 9.
A, Heat map of EEG power within delta, theta, alpha, beta, and gamma frequency bands from a single Vgat-hM4Di+ mouse during the 3 h period following saline (top) or CNO (bottom) treatment. The scale for each band is shown on the right. EEG recordings for the same period are in blue. B–F, Absolute (top) and relative (bottom) power for delta (B), theta (C), alpha (D), beta (E), and gamma (F) bands. Each line shows the data from a single animal during the four treatment periods (saline 1, CNO 1, saline 2, CNO 2). Control animals are depicted in black and Vgat-hM4Di+ animals in red. *p < 0.05. **p < 0.01.

References

    1. Antoine MW, Langberg T, Schnepel P, Feldman DE (2019) Increased excitation–inhibition ratio stabilizes synapse and circuit excitability in four autism mouse models. Neuron 101:648–661.e4. 10.1016/j.neuron.2018.12.026 - DOI - PMC - PubMed
    1. Bartos M, Vida I, Jonas P (2007) Synaptic mechanisms of synchronized gamma oscillations in inhibitory interneuron networks. Nat Rev Neurosci 8:45–56. 10.1038/nrn2044 - DOI - PubMed
    1. Bolneo E, Chau PYS, Noakes PG, Bellingham MC (2022) Investigating the role of GABA in neural development and disease using mice lacking GAD67 or VGAT genes. Int J Mol Sci 23:7965. 10.3390/ijms23147965 - DOI - PMC - PubMed
    1. Buch T, Heppner FL, Tertilt C, Heinen TJ, Kremer M, Wunderlich FT, Jung S, Waisman A (2005) A Cre-inducible diphtheria toxin receptor mediates cell lineage ablation after toxin administration. Nat Methods 2:419–426. 10.1038/nmeth762 - DOI - PubMed
    1. Buckmaster PS, Abrams E, Wen X (2017) Seizure frequency correlates with loss of dentate gyrus GABAergic neurons in a mouse model of temporal lobe epilepsy. J Comp Neurol 525:2592–2610. 10.1002/cne.24226 - DOI - PMC - PubMed

Substances