. 2024 Apr 4;15(4):247.
doi: 10.1038/s41419-024-06512-0.

Ovarian tumor cell-derived JAGGED2 promotes omental metastasis through stimulating the Notch signaling pathway in the mesothelial cells

Affiliations

Ovarian tumor cell-derived JAGGED2 promotes omental metastasis through stimulating the Notch signaling pathway in the mesothelial cells

Syed S Islam et al. Cell Death Dis. .

Abstract

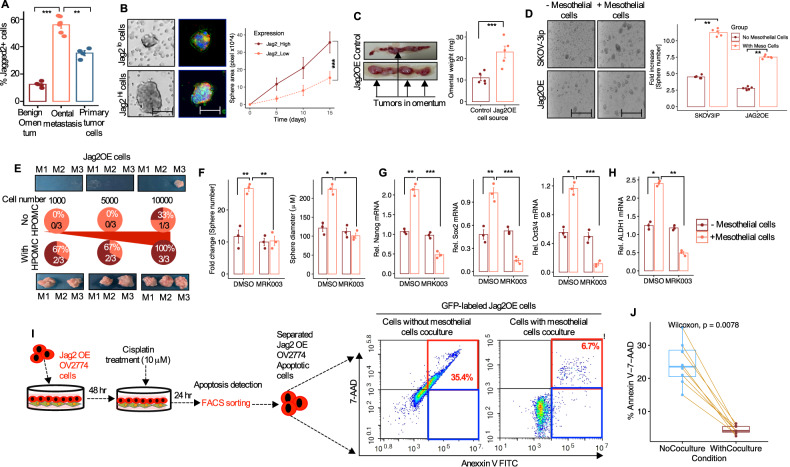
The primary site of metastasis for epithelial ovarian cancer (EOC) is the peritoneum, and it occurs through a multistep process that begins with adhesive contacts between cancer cells and mesothelial cells. Despite evidence that Notch signaling has a role in ovarian cancer, it is unclear how exactly it contributes to ovarian cancer omental metastasis, as well as the cellular dynamics and intrinsic pathways that drive this tropism. Here we show that tumor cells produced the Notch ligand Jagged2 is a clinically and functionally critical mediator of ovarian cancer omental metastasis by activating the Notch signaling in single-layered omental mesothelial cells. In turn, Jagged2 promotes tumor growth and therapeutic resistance by stimulating IL-6 release from mesothelial cells. Additionally, Jagged2 is a potent downstream mediator of the omental metastasis cytokine TGF-β that is released during omental destruction. Importantly, therapeutic inhibition of Jagged2-mediated omental metastasis was significantly improved by directly disrupting the Notch pathway in omental mesothelial cells. These findings highlight the key role of Jagged2 to the functional interplay between the TGF-β and the Notch signaling pathways during the metastatic process of ovarian cancer cells to the omentum and identify the Notch signaling molecule as a precision therapeutic target for ovarian cancer metastasis.


Conflict of interest statement

The authors declare no competing interests.

Figures

Fig. 1
Fig. 1. Mesothelial cells induce the growth of OvCa cells.
A A schematic model of OvCa cells cocultured with primary mesothelial cells in a transwell plate (co-culture, top) or cultured in mesothelial cells-conditioned media (CM) (bottom). B SKOV3 and OVCAR3 cells were co-cultured with mesothelial cells or incubated with mesothelial cell-derived conditioned medium (Meso-CM) in the co-culture transwell system for the indicated time periods followed by trypan blue staining and counting cells. SKOV3 and OVCAR3 cells alone served as control. Error bar represent Mean +/- SD; ns - not significant; *P < 0.05, **P < 0.01, ***P < 0.001 by ANOVA for repeated measures. C OvCa cells were cultured in the conditioned medium with a different ratio of culture medium and supernatants from mesothelial cells (ratios 1:1, 1:2, 1:4, 2:1, and total supernatants from the mesothelial cell culture, respectively) followed by quantitation of cells. Error bar represent Mean SD + /-, *P < 0.05 by repeated measures of ANOVA. D OVCAR3 and SKOV3 cells were used for immunofluorescence staining of Ki-67 on day 5 (post-culture) in the indicated three groups. The bar graph below shows the quantification of the proportion of Ki-67-positive cells in each group. Scale bar 100 μm, Error bar represent Mean +/- SD; *P < 0.05, **P < 0.01 by one-way ANOVA. E Matrigel invasion assay of SKOV3 and OVCAR3 cells in the indicated three groups. Scale bar 100 μm, n = 3. The graph below represents the quantification of the number of invaded cells per field, Error bar represents Mean +/- SD; *P < 0.05, **P < 0.01 by one-way ANOVA. F Assessment of the effect of Meso-CM or mesothelial cell co-culture on the sensitivity of SKOV3 and OVCAR3 cells to cisplatin. Cell viability is normalized to the untreated control group and statistical analysis was compared with SKOV3 and OVCAR3 monoculture group (n = 3), Error bar represents Mean +/- SD; ns= not significant, *P < 0.05, **P < 0.01 by one-way ANOVA. G SKOV3 and OVCAR3 cells were treated with the indicated concentrations of cisplatin for 48 hours and the proportion of apoptotic cells was determined by Annexin V-PI flow cytometry. Quantification of percentages of apoptotic cells in the indicated groups. Each group was statistically analyzed and compared to the untreated control group (n = 3), Error bar represents Mean +/- SD; *P < 0.05, **P < 0.01 by one-way ANOVA. H Effects of mesothelial cell co-culture on cisplatin treatment resistance of SKOV3 cells in vivo. SKOV3 cells were either cultured alone or were co-cultured with human mesothelial cells in vitro, and then were injected subcutaneously into immunocompromised mice. Once tumors were palpable, mice were treated with cisplatin (5 mg/kg body weight) or DMSO twice a week for 3 cycles. Representative of resected tumor images and tumor weight (bar graph) at the end point is shown (n = 1, 2, 3 mice per group). ns = not significant; ***P < 0.01 by two-way ANOVA. Data in the figure represent average and +/-SEM; P- values were determined using the Student’s t-test unless otherwise indicated.
Fig. 2
Fig. 2. OvCa cells induce Jagged2 expression early in metastasis to the omentum.
A Schematic diagram of SKOV3-ip cell injection in mouse peritoneum. B Locations of (i) ascites, (ii) omentum, (iii) primary ovary, and (iv) diaphragm tumor progression 3- weeks after i.p. injection (left panel). H & E staining of omentum without (top right panel) and with tumor (right bottom panel). C Endpoint analysis of malignant ascites and total number of tumor nodules in omentectomized mice 4 weeks after intraperitoneal cell injection of SKOV3-ip cells. Data are shown as Mean +/-SEM (n = 3). Statistical significance was calculated using Kruskal-Wallis one-way ANOVA followed by Dunn’s multiple comparison test. **P < 0.01, ****P < 0.0001. D–F Jagged2 protein and RNA expression in whole mouse omentum three weeks following in vivo i.p. injection of SKOV3-ip tumor cells. Immunofluorescence (D), Immunoblot (E), and qRT-PCR (F) analysis were performed using Jagged2 specific antibody and probe (**P < 0.01; Scale bars 100 μm). G Diagram of the mesothelium in 3D culture. Primary human omental fibroblasts are plated with human omental ECM and cultured for 6 hours. The fibroblasts are overlaid with human omental mesothelial cells and cultured for an additional 24 hours before OvCa cells are seeded. The purpose of the use of the 3D culture system was to investigate OvCa cells’ adhesion, invasion, and proliferation. H Ex-vivo human omentum adhesion, invasion, and proliferation assay with PHK25 labeled OvCa cells and the schematic of cell sorting by FACS. I Western blot analysis of Jagged2 protein in the surface cells of the human omentum in two culture conditions. Cells were cultured in human omentum without fluorescently labeled cells (unattached) or PHK25 labeled SKOV3-ip cells (attached) after FACS sorting. J qRT-PCR mRNA analysis of Jagged2 following the same methods described in H (**P < 0.01).
Fig. 3
Fig. 3. Notch ligand Jagged2 is associated with a high risk of omental metastasis.
A Heat map showing the qRT-PCR gene expression of the Notch pathway ligands and downstream targets in four ovarian cancer cell lines. B qRT-PCR analysis of the Jagged2 gene expression in ovarian cancer cell lines with distinct metastatic abilities. C Heat map showing the microarray data analysis [30] of the Jagged2 mRNA expression in ovarian cancer cell lines with metastatic ability. DF Kaplan-Meier progression-free survival curves of ovarian cancer patients from Gentric (GSE26193) [31], Denkert (GSE14764) [32], and TCGA [33] data sets representing high and low expression of Jagged2. G Western blot analysis of the Jagged2 protein in control and Jagged2 knockdown (KD) in OVCAR3 and SKOV3-ip cells. H (Top) Representative images of tumor nodules in mouse metastatic omentum (right) and tumors developed in the primary ovary (left). (Bottom) quantification of tumor area from each group. Scale bar 100 μm. ***P < 0.001. I–L Kaplan-Meier survival and omental metastasis- free curves of mice injected with control or Jagged2 knockdown (Jag2KD) OVCAR3 and SKOV3-ip cells (n = 5 mice per/group). M (Left panel) Representative immunohistochemical images of Ki-67 and H & E histological images of primary omentum from representative mice for each experimental group. (Right panel) quantification of Ki-67-positive cells in the Jag2KD cells compared with the control group. Scale bar 20 μm. P = 0.12 (OVACR3 cells) and 0.44 (SKOV3-ip cells). Data in the figure represent average and +/-SEM; P-values were determined using the Student’s t-test unless otherwise indicated.
Fig. 4
Fig. 4. Enforced expression of Jagged2 in ovarian cancer promotes omental metastasis.
A Western blot analysis showing Jagged2 protein expression in control and Jag2OE OV2774 cell line. B Mice inoculated with control and Jag2OE cells showed the absence (n = 5) and presence (n = 5) of omental tumor nodules with histological and Jagged2 immunofluorescence. Magnification of images are taken at 40x (scale bar = 200 μm). C Quantification of tumor area in the omentum from each mice group (P = 0 .0019). Error bar represent Mean +/- SD; ***P < 0.001. D Quantification of tumor weight (in grams) from each mice group from the day of inoculation (0 days) up to day 25. Error bar represent Mean +/- SD; ns - not significant; *P < 0.05; **P < 0.01 and ***P < 0.001, respectively. E Kaplan-Meier omental metastasis-free survival curve of mice inoculated with control (n = 5) or Jag2OE (n = 5) (Log-rank P < 0.012). F Representative images of freshly resected human omentum showing absence (no omental metastasis; n = 4) and presence (omental metastasis; n = 4) of omental tumors with histological analysis of both H & E and Jagged2 immunofluorescence. Scale bar 100 μm. G Immunofluorescence staining of Ki-67 from omental metastatic tumors from each group (left panel). The right panel illustrates the quantification of the percent of Ki-67-positive tumor cells. For the quantification analysis, 10 distinct regions were randomly selected from each group. *P < 0.05. H (Left panel) Representative images of invaded cells and (right panel) quantification of cells invasive capability of control and Jag2OE cells using two-chamber transwell Matrigel invasion assay. **P < 0.01. Scale bar 100 μm, I qRT-PCR mRNA expression analysis of the Notch target genes Hes1 (**P < 0.01), Hey1 (***P < 0.001), and the Notch receptor Jagged2 (**P < 0.01) in control and Jag2OE OV2774 mice omental metastatic site. Data in the figure represent average and +/-SEM; P-values were determined using the Student’s t-test unless otherwise indicated.
Fig. 5
Fig. 5. Jagged2 is functionally regulated by the TGF-β-Smad3 signaling pathway in ovarian cancer omental metastasis.
A Gene-set enrichment analysis (GSEA) of the TGF-β-responsive genes set in a ranked list of differentially expressed genes in primary ovary tumors versus omental metastatic tumor cells (GSE2109; P = 0.037). The bottom panel shows a corresponding heat map of core TGF-β gene sets with elevated expression in two groups. B Jagged2 mRNA expression in response to TGF-β treatment in ovarian cancer cell lines. **P < 0.01, ***P < 0.001. C Jagged2 mRNA expression in SKOV3-ip cells treated with either DMSO or TGF-β-receptor inhibitor (EMD616451) for 24 hours. ***P < 0.001. D Cell proliferation assay of SKOV3-ip cells treated with either DMSO or TGF-β-receptor inhibitor (EMD616451) for the indicated time. *P < 0.05, ***P < 0.001. E Jagged2 mRNA expression in ovarian cancer cells treated with either DMSO or Smad3 inhibitor (SIS3) for 24 hours. ***P < 0.001. F Number of invaded cells in the indicated cells with altered expression of Jagged2 and Smad3. **P < 0.01, ***P < 0.001. G Representative images of the omental region in mice from experimental groups on day 10. (left) Quantification of tumor numbers in each group of experimental mice. Data in the figure represent average +/- SEM, SD. **P < 0.01, ***P < 0.001. H Western blot analysis showing Jagged2, Smad3, and phospho-Smad3 expression in the indicated cells with altered Jagged2 and Smad3. I Western blot analysis of Jagged2, phospho-Smad3, and Smad3 protein levels in the control or Smad3 knockdown in Jag2OE cells with or without stimulation of TGF-β. J Western blot analysis showing Jagged2 protein expression in the control and Jag2KD SKOV3-ip cells with or without TGF-β treatment. Data in the figure represent average and +/-SEM; P-values were determined using the Student’s t-test unless otherwise indicated.
Fig. 6
Fig. 6. OvCa cells expressing Jagged2 have a growth advantage in the omental microenvironment via Notch-dependent cross-communication with mesothelial cells.
A Schematic diagram of a co-culture model between Jag2OE tumor cells and human primary mesothelial cells transfected with a Notch reporter. B Flow cytometry cells separation of mesothelial cells (P2) from GFP+ Jag2OE cells (P3). After flow cytometry cell separation, the bottom panel shows the quantification of the Jagged2 mRNA expression control and sorted co-culture cells from the indicated group (***P < 0.001). C Co-culture between control or Jag2OE tumor cells and mesothelial cells transfected with a Notch reporter and treated with DMSO or MRK-003 (1 and 5 μM). D qRT-PCR assessment of the mRNA levels of the indicated Notch target genes, TGF-β1 and fibronectin 1 (FN1) in mesothelial cells separated by FACS from co-culture in each experimental group. *P < 0.05, **P < 0.01, and ***P < 0.001. E qRT-PCR analysis of Jagged2 mRNA expression in primary human mesothelial cells with or without a conditioned medium (CM) from Jog2OE cells for the indicated time periods. *P < 0.05. F Representative images of co-cultures of Jag2OE and mesothelial cells from each experimental group (DMSO or MRK-003 [5 μM]). Scale bar, 200 μm. G Quantifying tumor cell proliferation of control and Jag2OE cells after co-culture with mesothelial cells from each experimental group by luciferase assay. **P < 0.01, ***P < 0.001. H Quantification of sphere growth efficiency of control and Jag2OE after co-cultures of each experimental treatment group. **P < 0.01, ***P < 0.001. I Quantification of tumor cell proliferation cultured alone (no co-culture) from each experimental group. Data in the figure represent average and +/-SEM; P-values were determined using the Student’s t-test unless otherwise indicated. ns = not significant. All experiments were run in triplicates.
Fig. 7
Fig. 7. Ectopic expression of Jagged2 in OvCa cells promotes cancer stem cell (CSCs) features and resistance to chemotherapy.
A Jagged2 expression was examined by fluorescent-activated cell sorting (FACS) in tissues from omentum (n = 4) sampled from patients treated for benign disease, OvCa primary tumors (n = 4), and omental metastasis (n = 4) collected from patients with serous OvCa. Metastatic tumors in the omentum (n = 4) had a higher percentage of Jagged2+ cells compared with patients who were either primary tumors or benign omentum (n = 4). **P < 0.01, ***P < 0.001 unpaired two-sided t-test. B Spheroids formation assay comparing cultured omental metastatic (Jag2High) and non-metastatic omentun (Jag2Low) cells. Cells were seeded in ultra-low adherence 96-well plates, and the formation of spheroids was assessed with a wide-filed microscope. (Mean SEM + /-). Scale bar 200 μm. Jagged2 protein immunofluorescently stained with Jagged2 specific primary antibody in cultured spheroids. (Mean SEM + /-). ***P < 0.001, unpaired two-sided t-test. C (Left)Representative images of tumor localization in mouse omentaum at day 10 after injection of control and Jag2OE cells. (Right) Analysis of tumor burden in omentum at day 10 after injection. Data are presented as mean +/-SD (n = 3) and a statistically significant difference was calculated using the Man-Whitney U test, ***P < 0.001. D Sphere-formation assay of SKOV3-ip and Jag2OE cells after mesothelial cell exposure. Representative sphere images and quantification of sphere numbers fold increase is shown (n = 3). Scale bar 200 μm. A statistically significant difference was calculated using the Man-Whitney U test, ***P < 0.001. E In vivo limiting dilution assay showing tumor formation rate of Jag2OE cells co-injected with mesothelial cells (n = 3 mouse/group). F Number of spheres and sphere diameter (n = 3) in the indicated treatment group. **P < 0.01, ***P < 0.001. G qRT-PCR analysis showing relative mRNA expression of the stemness markers, Sox2, Nanog, Oct3/4 in the indicated treatment group. One-way ANOVA test. *P < 0.05, **P < 0.01, ***P < 0.001. H ALDH1L1 mRNA in Jag2OE cells after coculture with mesothelial cells and in the indicated treatment groups as normalized to GAPDH mRNA (n = 3). *P < 0.05, **P < 0.01. I (right) Schematic presentation of the drug response assay designed to assess the proportion of apoptotic cells among the co-cultured OvCa and mesothelial cells. (left) GFP-labeled Jag2OE cells isolated from mesothelial cells were stained with Annexin-V and 7-AAD and the proportion of Annexin-V positive cells was determined by flow cytometry. J The percentage of Annexin-V-7AAD positive cells were presented from paired samples (n = 8, P = 0.0078). p-values were analyzed based on Wilcoxon test. Data in the figure represent average and +/-SEM; P-values were determined using the Student’s t-test unless otherwise indicated.
Fig. 8
Fig. 8. IL-6 secreted from omental mesothelial cells induce stemness in a Notch-Hes1 dependent fashion and stimulates the growth of Jagged2 expressing cells.
A A List of genes with an expression fold change between pleural malignant and peritoneal malignant mesothelial cells of more than 2-fold from the public dataset microarray GSE63966. B qRT-PCR mRNA analysis of the Notch target genes, and CTGF and FN1 from mesothelial cells, omental metastatic tumor cells, and primary ovary tumor cells resected from the patient. C (Left) Schematic model of the co-culture system of mesothelial and Jag2OE cells. (Right) qRT-PCR mRNA expression of the indicated genes in control and Jag2OE tumor cells cocultured with mesothelial cells. *P < 0.05, **P < 0.01, ***P < 0.001. D Heat map showing qRT-PCR mRNA expression levels of the indicated genes from mesothelial cells that were FACS separated from cocultures of each experimental/treatment group. E qRT-PCR analysis of Hes1 expression in mesothelial cells treated with scrambled or Hes1 siRNA and cultured in 24 well plates coated with either Fc or control or recombinant Jagged2 protein (n = 3). Data represent average +/- SD. **P < 0.01, ***P < 0.001. F Quantification of cell proliferation in mesothelial cells treated with control or Hes1 siRNA and cultured in 24 well plates coated with either Fc or control or recombinant Jagged2 protein by luciferase assay (n = 3). **P < 0.01, ***P < 0.001. G Quantification of IL-6 levels in the conditioned media of control or Jag2OE tumor cells cultured alone or cocultured with mesothelial cells in the presence of DMSO, MRK-003 (1μM) by ELISA (n = 3). **P < 0.01, ****P < 0.001. H Quantification of IL-6 levels in the conditioned media of the indicated tumor cells co-cultured with mesothelial cells after treatment with Hes1 siRNA by ELISA. ***P < 0.001. I Cell proliferation of the indicated tumor cells co-cultured with mesothelial cells from each experimental group by luciferase assay. Data represent average +/-SD, **P < 0.01, ***P < 0.001. J Cell proliferation of the indicated tumor cells cocultured with mesothelial cells after treatment with Hes1 siRNA by luciferase assay. **P < 0.01, ***P < 0.001. K Quantification of sphere formation capacity of the indicated tumor cells cocultured with mesothelial cells after treatment with Hes1 siRNA. **P < 0.01, ***P < 0.001. L Quantification of sphere formation capacity of indicated tumor cells cocultured with mesothelial cells after treatment with 1 μM MRK-003. **P < 0.01, ***P < 0.001. M Cell proliferation of indicated tumor cells cocultured with mesothelial cells and treatment with either IgG or 5.0 μg/mL of the anti-IL-6 antibody by luciferase assay. **P < 0.01, ***P < 0.001. N Cell proliferation of indicated tumor cells cocultured with mesothelial cells and treatment with either PBS, 5.0 μg/mL, or 10.0 μg/mL of anti-IL6 by luciferase assay. *P < 0.05, ***P < 0.001. Data in the figure represent average and +/-SEM; P-values were determined using the Student’s t-test unless otherwise indicated. All experiments were run in triplicates.
Fig. 9
Fig. 9. Disruption of the Notch signaling pathway with MRK-003 prevents the omental metastatic spread of ovarian cancer.
A, B OvCa cells were treated with vehicle and MRK-003 (5 μM), followed by the addition of fluorescently labeled SKOV3-ip and OVCAR3 cells and later detected by fluorescent reader. **P < 0.01, ***P < 0.001. C The experimental model of vehicle or MRK-003 (5 μM) treated and fluorescently labeled OvCa cells seeded in a piece of human omentum (72 hours). D–E Jagged2 inhibition by MRK-003 as described in (A and B). After scraping off the omentum surface cells of the omentum, Jagged2 (D) and CD44 (E) were quantified using qRT-PCR. *P < 0.05, ***P < 0.001. F Quantification of the number of cells after scrapping from the omentum. *P < 0.05, **P < 0.01. G-H qRT-PCR mRNA analysis of the Notch target genes and IL-6 from scraped-off cells from the omentum. *P < 0.05, **P < 0.01, ***P < 0.001. I Kaplan-Meier omental metastasis-free survival curve of mice from each experimental group. (Log-rank P = 0.018). J Representative images of tumor metastasis to omentum (top; highlighted with white circles) and primary ovary site (bottom) in female mice injected with SKOV3-ip cells and treated with vehicle or MRK-003. K–N Omental tumor weight (K), omental tumor number (L), ascites volume (M), and omental weight (N) at the endpoint of mice intraperitoneal inoculation. P = 0.006 and 0.009; *P < 0.05, ***P < 0.001. O qRT-PCR analysis of the Notch target genes and IL-6 in the tumor-stromal compartment of omental metastasis from vehicle or MRK-003 treated mice. *P < 0.05, **P < 0.01, ***P < 0.001. Data in the figure represent average and +/-SEM; P values were determined using the Student’s t-test unless otherwise indicated. All experiments were run in triplicates.
Fig. 10
Fig. 10. Inhibiting the Notch signaling pathway with MRK-003 reverses Jagged2-mediated omental metastasis.
A Schematic diagram of i.p. cell injection and treatment schedules. B Images of representative mice in each experimental group on day 40 after peritoneal injection. C Kaplan-Meier omental metastasis-free survival curve of mice from each experimental group. Log-rank P = 0.0032. D–F Omental tumor weight (D), omental tumor number (E), and ascites volume (F) of mice from each experimental group (mean +/- SEM, n = 5 for each experiment, **P < 0.01, ***P < 0.001, Students t- test). G A graphical presentation of tumor-mesothelial cell cross-talk of Jagged2-expressing ovarian tumor cells with the omental microenvironment. Data in the figures represent average and +/-SEM; P-values were determined using the Student’s t-test unless otherwise indicated. All experiments were run in triplicates.

References

    1. Lengyel E. Ovarian Cancer Development and Metastasis. Am J Pathol. 2010;177:1053. doi: 10.2353/ajpath.2010.100105. - DOI - PMC - PubMed
    1. Iwagoi Y, Motohara T, Hwang S, Fujimoto K, Ikeda T, Katabuchi H. Omental metastasis as a predictive risk factor for unfavorable prognosis in patients with stage III–IV epithelial ovarian cancer. Int J Clin Oncol. 2021;26:995. doi: 10.1007/s10147-021-01866-3. - DOI - PMC - PubMed
    1. Kenny HA, Chiang CY, White EA, Schryver EM, Habis M, Romero IL et al. Mesothelial cells promote early Ovarian cancer metastasis through fibronectin secretion. J Clin Invest. 2014. 10.1172/JCI74778. - PMC - PubMed
    1. Lee W, Ko SY, Mohamed MS, Kenny HA, Lengyel E, Naora H. Neutrophils facilitate ovarian cancer premetastatic niche formation in the omentum. J Exp Med. 2018;216:176–94. doi: 10.1084/jem.20181170. - DOI - PMC - PubMed
    1. Sodek KL, Murphy KJ, Brown TJ, Ringuette MJ. Cell–cell and cell–matrix dynamics in intraperitoneal cancer metastasis. Cancer Metast Rev. 2012;31:397. doi: 10.1007/s10555-012-9351-2. - DOI - PMC - PubMed

Substances