Review
. 2024 Apr 4;23(1):71.
doi: 10.1186/s12943-024-01977-1.

Crosstalk between metabolism and cell death in tumorigenesis

Affiliations
Review

Crosstalk between metabolism and cell death in tumorigenesis

Shichao Yang et al. Mol Cancer. .

Abstract

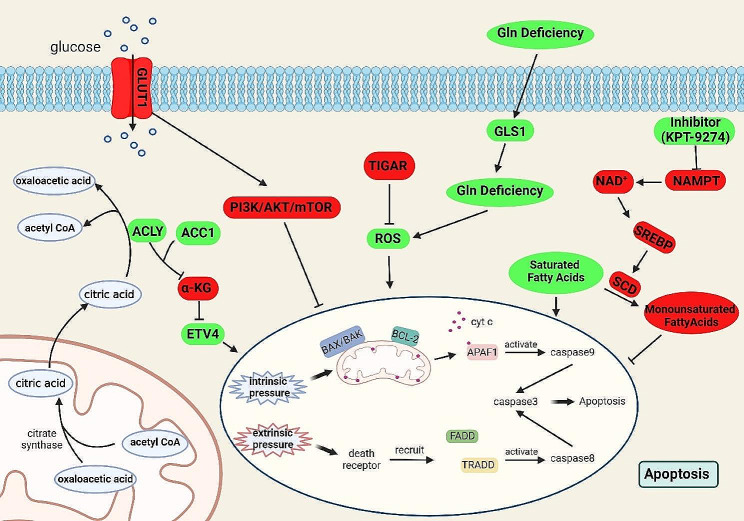
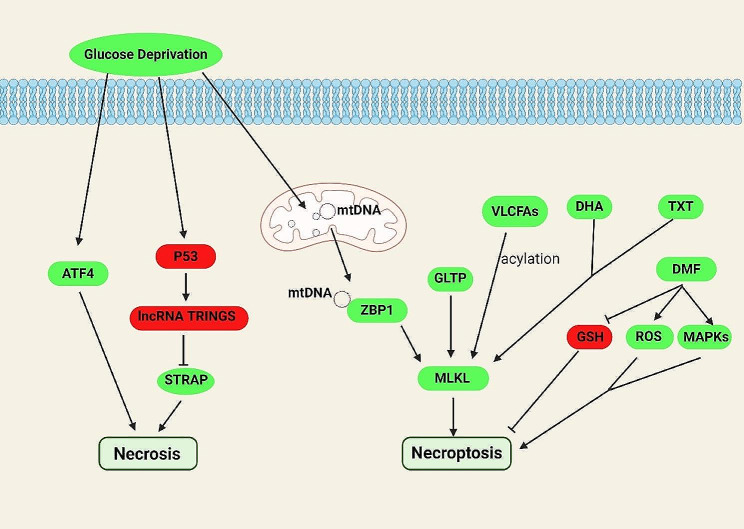
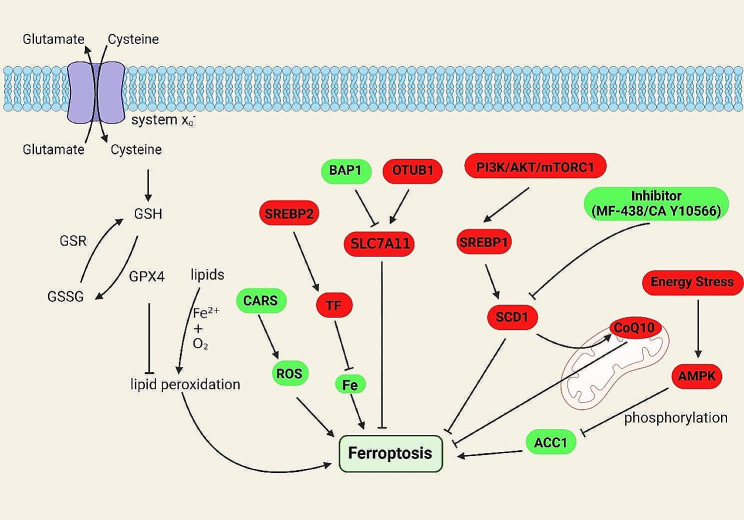
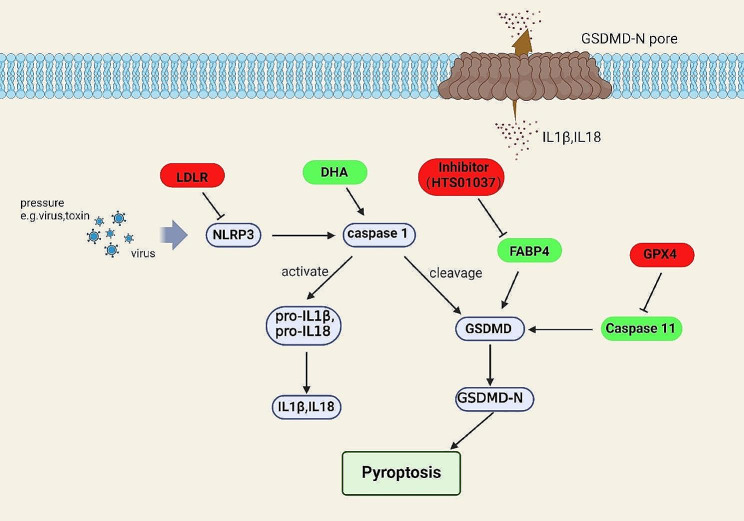
It is generally recognized that tumor cells proliferate more rapidly than normal cells. Due to such an abnormally rapid proliferation rate, cancer cells constantly encounter the limits of insufficient oxygen and nutrient supplies. To satisfy their growth needs and resist adverse environmental events, tumor cells modify the metabolic pathways to produce both extra energies and substances required for rapid growth. Realizing the metabolic characters special for tumor cells will be helpful for eliminating them during therapy. Cell death is a hot topic of long-term study and targeting cell death is one of the most effective ways to repress tumor growth. Many studies have successfully demonstrated that metabolism is inextricably linked to cell death of cancer cells. Here we summarize the recently identified metabolic characters that specifically impact on different types of cell deaths and discuss their roles in tumorigenesis.

Keywords: Apoptosis; Autophage; Cell death; Cuproptosis; Ferroptosis; Pyroptosis; Tumor metabolism; Tumor microenvironment.


Conflict of interest statement

The authors declare no competing interests.

Figures

Fig. 1
Fig. 1
Metabolites, metabolic pathways and related metabolic genes that play the roles in apoptosis. Deficiencies of various substances involved in metabolism affect the relevant metabolic pathways and apoptosis. Glycolysis can be inhibited in the presence of Glut1 deficiency, which promotes the development of apoptosis. ACLY, a key enzyme involved in the conversion of citric acid to oxaloacetate and acetyl CoA, works with ACC1, an important enzyme in the process of acetyl-CoA production, to regulate the content of α-KG and promote ETV4, which in turn promotes apoptosis. ROS usually promotes apoptosis. When TIGAR inhibits the important oxidative ROS, apoptosis can be suppressed. Gln deletion synergizes with GLS1 to promote ROS-related apoptosis. Inhibition of NAMPT prevents the conversion of saturated fatty acids to monounsaturated fatty acids and promotes apoptosis. The red boxes represent negative regulators and the green boxes represent positive regulators
Fig. 2
Fig. 2
Metabolites, metabolic pathways and related metabolic genes that take part in necrosis and necroptosis. Glucose starvation promotes necrosis through the transcription factor ATF4. In addition, it can act on p53, which regulates necroptosis by affecting the interaction between TRINGS and STRAP. Glucose deprivation also facilitates necroptosis by promoting the binding of mitochondrial DNA and ZBP1 to regulate MLKL, a key substance in the development of necroptosis. DHA supplementation with docetaxel (TXT) promotes necroptosis. As one of the key components of the necrosome that promotes the onset of necroptosis, MLKL function can be facilitated by GLTP. Very long chain saturated fatty acids participate in necroptosis by targeting MLKL. DMF promotes necroptosis by promoting the depletion of GSH, ROS generation and MAPK activation. The red boxes represent negative regulators and the green boxes represent positive regulators
Fig. 3
Fig. 3
Metabolites, metabolic pathways and related metabolic genes that play the roles in ferroptosis. Lipid oxidation is an important process in ferroptosis and requires the participation of iron. Upregulation of ROS levels by CARS promote ferroptosis, while downregulation of iron ion levels by SREBP2 and TF inhibit ferroptosis. Besides, PI3K/AKT/mTORC signaling pathway activates lipid synthesis-related SREBP1 and SCD1, then affect lipid synthesis to inhibit ferroptosis. While inhibition of SCD1 can influence CoQ10 which locate on the mitochondrial electron transport chain and promote ferroptosis. BAP1 promotes ferroptosis by inhibiting the cystine transport-related SLC7A11, while OTWB1 exerts the opposite effect. Energy stress regulates ACC1 via AMPK, reducing ACC1 activity and inhibiting ferroptosis. The red boxes represent negative regulators and the green boxes represent positive regulators
Fig. 4
Fig. 4
Metabolites, metabolic pathways and related metabolic genes that play the roles in pyroptosis. NLRP3 plays an important role in the process of pyroptosis, which inhibition of NLRP3 will lead to the downregulation of pyroptosis. LDLR inhibits pyroptosis by mediating NLRP3. DHA promotes pyroptosis through affecting caspase1, and FABP4 exert the same effect through activating GSDMD. GPX4 inhibit pyroptosis by affecting the processing of GSDMD by caspase11, respectively. The red boxes represent negative regulators and the green boxes represent positive regulators
Fig. 5
Fig. 5
The expression levels of cuproptosis genes in colorectal cancer and hepatocellular carcinoma. (A and B) The expression levels of cuproptosis genes in colorectal cancer (A) and hepatocellular carcinoma (B). The blue dot represents the genes that are down-regulated in cancer, the red dot means these genes are up-regulated in cancer (p < 0.05), and those with no significant difference compared with normal tissues are indicated in gray. Both mRNA Seq data and clinical data collected from TCGA database, including COAD, READ and LIHC reveal that the COAD and READ are merged into colorectal cancer based on gene names. In the mRNA differential expression analysis, the R package Deseq2 was used to differential expression analysis. The genes with a fold change (FC) > 0 and an adjusted P-value (FDR) > 0.05 were retained for further analysis
Fig. 6
Fig. 6
Survival analyses of cuproptosis-related genes in both colorectal cancer and hepatocellular carcinoma. (A and B) The survival analysis of cuproptosis-related genes in colorectal cancer (A) and hepatocellular carcinoma (B). The top part of the survival analysis for each gene shows the Kaplan-Meier survival curves for the genes obtained by the optimal division method, with the red and blue lines representing the high and low expression groups based on gene expression levels, and the horizontal coordinate (Time(years)) representing the survival time and the vertical coordinate (Survival probability) representing the survival rate. In the bottom part of the graph, the horizontal coordinate Time (years) represents the follow-up time, and the optimal division method divides all patients into high and low expression groups at the beginning of the follow-up period. The mRNA expression data of genes and corresponding clinical survival data across colorectal cancer and LIHC were merged for expression survival analysis. Tumor samples were divided into high and low groups according to median gene expression value. The R package survival was used to fit the survival time and survival status for the two groups. Differences in P value were examined in the survival outcomes of the groups according to Kaplan–Meier survival analysis
Fig. 7
Fig. 7
Metabolites, metabolic pathways and related metabolic genes that work in autophagy. mTORC is an important negative regulator of autophagy, and many factors promote autophagy by inhibiting mTORC. Rasfonin regulates autophagy both through AKT and mTORC. Amino acid deprivation inhibits mTORC through p27, its combination with LAMTOR in turn accelerates autophagy. Hexokinase II can inhibit mTORC, thus promoting autophagy. AMPK can also inhibit mTORC under the regulation of lncRNA DRAIC. Under low energy state stimulation of AMPK can promote autophagy. The STK11/LKB1-AMPK axis also exerts a pro-autophagic effect by affecting AMPK. Glucose deprivation promotes nuclear translocation of GAPDH and binding to SITR1 via AMPK, which in turn promotes autophagy. The red boxes represent negative regulators and the green boxes represent positive regulators

References

    1. DeBerardinis RJ, Thompson CB. Cellular metabolism and disease: what do metabolic outliers teach us? Cell. 2012 doi: 10.1016/j.cell.2012.02.032. - DOI - PMC - PubMed
    1. Musheshe N, et al. cAMP: from Long-Range Second Messenger to Nanodomain Signalling. Trends Pharmacol Sci. 2018 doi: 10.1016/j.tips.2017.11.006. - DOI - PubMed
    1. Hemmrich K, et al. Nitric oxide and downstream second messenger cGMP and cAMP enhance adipogenesis in primary human preadipocytes. Cytotherapy. 2010 doi: 10.3109/14653241003695042. - DOI - PubMed
    1. Choi HK, et al. Purine-rich foods, dairy and protein intake, and the risk of gout in men. N Engl J Med. 2004 doi: 10.1056/NEJMoa035700. - DOI - PubMed
    1. Dalbeth N, et al. Gout. Nat Rev Dis Primers. 2019 doi: 10.1038/s41572-019-0115-y. - DOI - PubMed