. 2024 Apr 4;23(1):70.
doi: 10.1186/s12943-024-01985-1.

Therapy-induced senescent tumor cell-derived extracellular vesicles promote colorectal cancer progression through SERPINE1-mediated NF-κB p65 nuclear translocation

Affiliations

Therapy-induced senescent tumor cell-derived extracellular vesicles promote colorectal cancer progression through SERPINE1-mediated NF-κB p65 nuclear translocation

Dan Zhang et al. Mol Cancer. .

Abstract

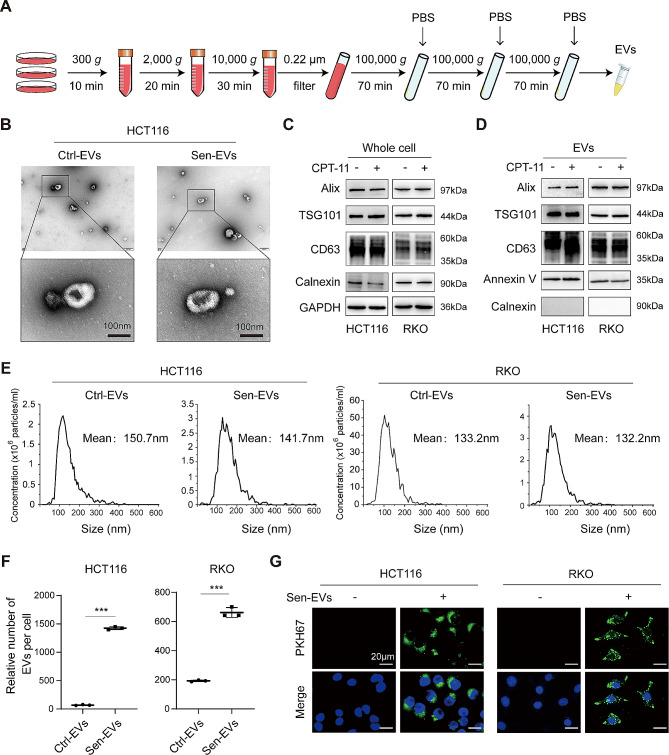
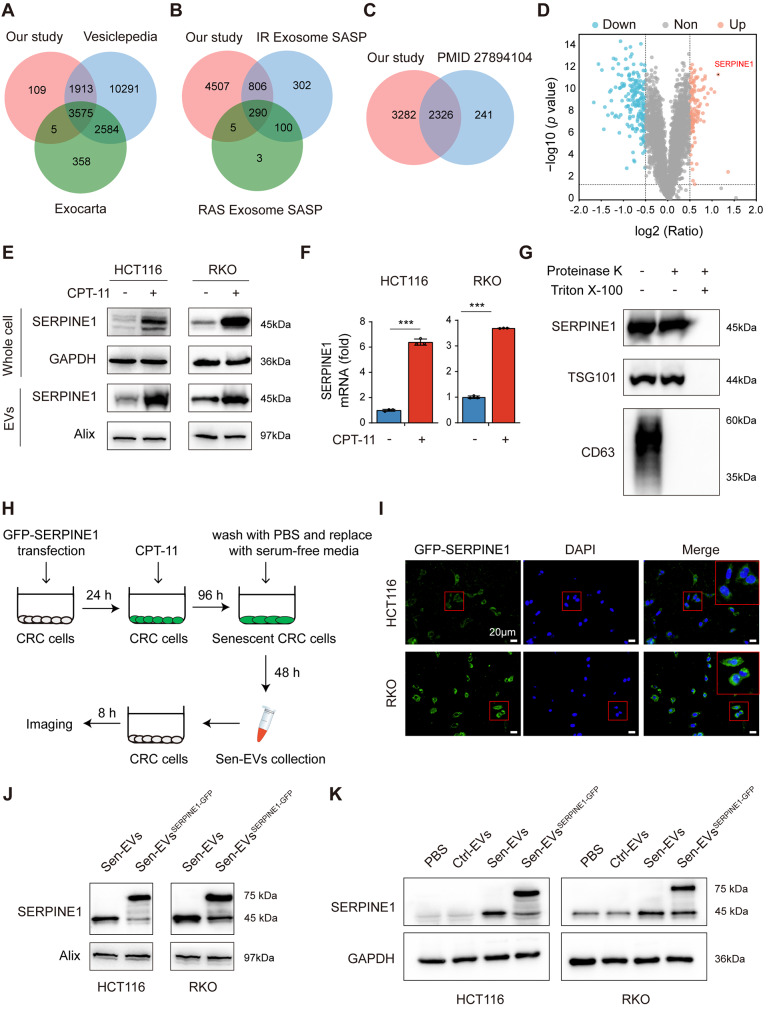
Background: Cellular senescence frequently occurs during anti-cancer treatment, and persistent senescent tumor cells (STCs) unfavorably promote tumor progression through paracrine secretion of the senescence-associated secretory phenotype (SASP). Extracellular vesicles (EVs) have recently emerged as a novel component of the SASP and primarily mediate the tumor-promoting effect of the SASP. Of note, the potential effect of EVs released from STCs on tumor progression remains largely unknown.

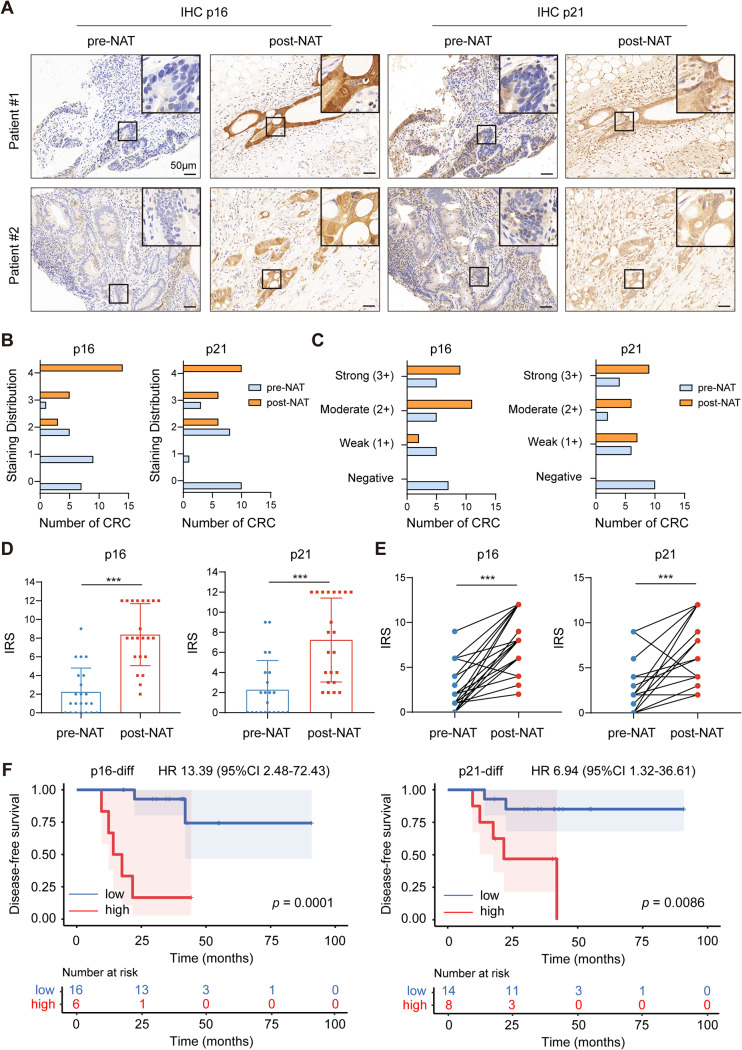
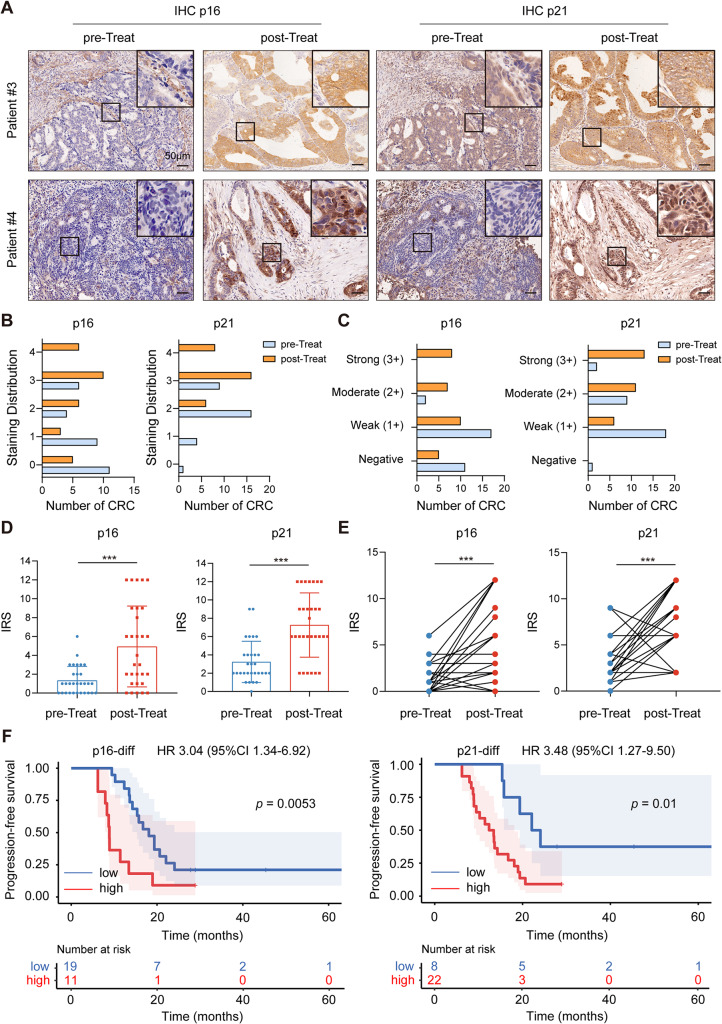
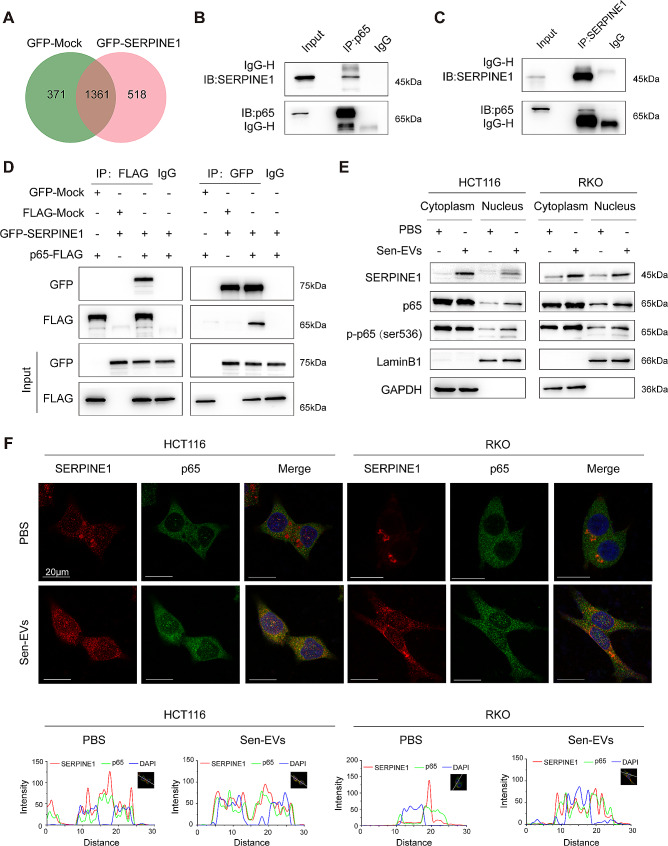
Methods: We collected tumor tissues from two cohorts of colorectal cancer (CRC) patients to examine the expression of p16, p21, and SERPINE1 before and after anti-cancer treatment. Cohort 1 included 22 patients with locally advanced rectal cancer (LARC) who received neoadjuvant therapy before surgical resection. Cohort 2 included 30 patients with metastatic CRC (mCRC) who received first-line irinotecan-contained treatment. CCK-8, transwell, wound-healing assay, and tumor xenograft experiments were carried out to determine the impacts of EVs released from STCs on CRC progression in vitro and in vivo. Quantitative proteomic analysis was applied to identify protein cargo inside EVs secreted from STCs. Immunoprecipitation and mass spectrometer identification were utilized to explore the binding partners of SERPINE1. The interaction of SERPINE1 with p65 was verified by co-immunoprecipitation, and their co-localization was confirmed by immunofluorescence.

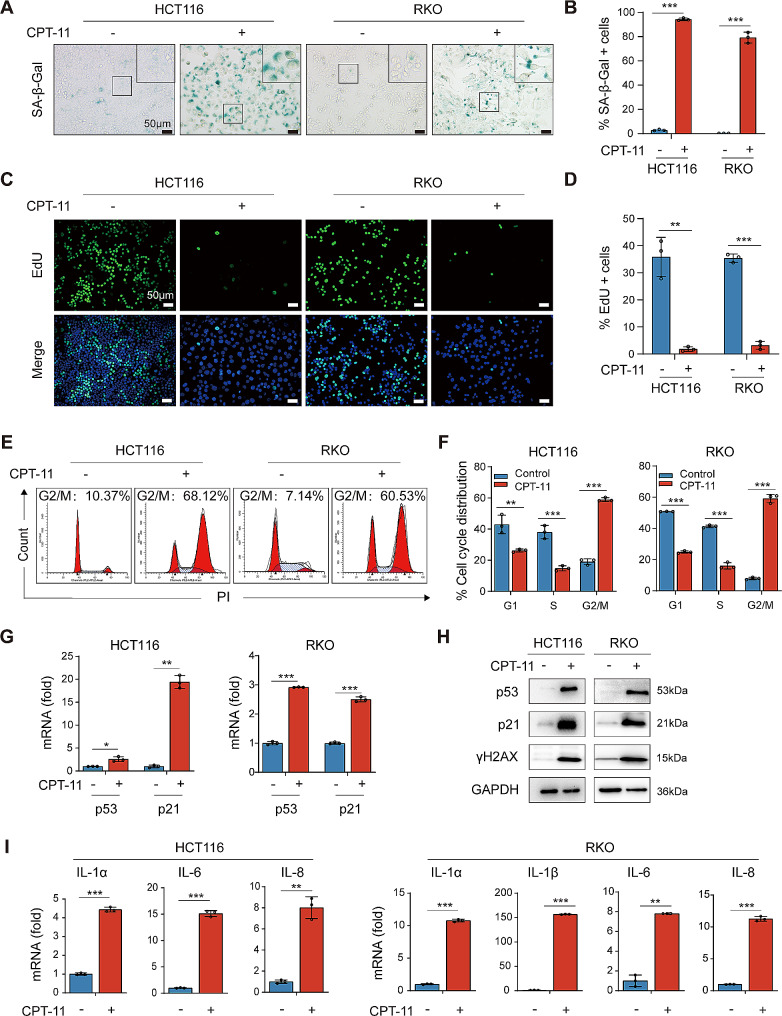
Results: Chemotherapeutic agents and irradiation could potently induce senescence in CRC cells in vitro and in human CRC tissues. The more significant elevation of p16 and p21 expression in patients after anti-cancer treatment displayed shorter disease-free survival (DFS) for LARC or progression-free survival (PFS) for mCRC. We observed that compared to non-STCs, STCs released an increased number of EVs enriched in SERPINE1, which further promoted the progression of recipient cancer cells. Targeting SERPINE1 with a specific inhibitor, tiplaxtinin, markedly attenuated the tumor-promoting effect of STCs-derived EVs. Additionally, the patients with greater increment of SERPINE1 expression after anti-cancer treatment had shorter DFS for LARC or PFS for mCRC. Mechanistically, SERPINE1 bound to p65, promoting its nuclear translocation and subsequently activating the NF-κB signaling pathway.

Conclusions: We provide the in vivo evidence of the clinical prognostic implications of therapy-induced senescence. Our results revealed that STCs were responsible for CRC progression by producing large amounts of EVs enriched in SERPINE1. These findings further confirm the crucial role of therapy-induced senescence in tumor progression and offer a potential therapeutic strategy for CRC treatment.

Keywords: Cellular senescence; Colorectal cancer; Extracellular vesicles; SERPINE1; p65.


Conflict of interest statement

The authors declare no competing interests.

Figures

Fig. 1
Fig. 1
Therapy-induced cancer cell senescence was observed in human LARC tissues of cohort 1. (A) IHC staining of p16 and p21 in 22 matched LARC tissues. pre-NAT, colonoscopic biopsy specimens before NAT. post-NAT, surgical specimens after NAT. (B) The staining distribution of p16 and p21. (C) The intensity score of p16 and p21. (D and E) The IRS of p16 and p21. (F) Kaplan-Meier plots of DFS. The plot was generated according to the difference between pre-NAT IRS and post-NAT IRS of p16 (p16-diff) and p21 (p21-diff). *p < 0.05, **p < 0.01, and ***p < 0.001
Fig. 2
Fig. 2
The expression of p16 and p21 was significantly elevated after irinotecan-based chemotherapy in mCRC patients of cohort 2. (A) IHC staining of p16 and p21 in matched CRC tissues. pre-Treat, colonoscopy biopsies or surgically resected tumors before anti-cancer treatment. post-Treat, surgically resected tumors after irinotecan-based chemotherapy. (B) The staining distribution of p16 and p21. (C) The intensity score of p16 and p21. (D and E) The IRS of p16 and p21. (F) Kaplan-Meier plots of PFS. The plot was generated according to the difference between pre-Treat IRS and post-Treat IRS of p16 (p16-diff) and p21 (p21-diff). *p < 0.05, **p < 0.01, and ***p < 0.001
Fig. 3
Fig. 3
CPT-11 induced senescence in CRC cells. CRC cells were treated with or without CPT-11 for 96 h. (A) Representative photographs of SA-β-Gal staining. (B) Quantification of SA-β-Gal-positive cells. (C) Representative photographs of EdU staining. Green fluorescence indicated EdU staining, and blue fluorescence reflected nuclear staining with DAPI. (D) Quantification of EdU-positive cells. (E) Flow cytometry analysis of cell cycle distribution. (F) Quantification of cell cycle distribution. (G) p53 and p21 mRNA levels. (H) p53, p21, and γH2AX protein levels. (I) mRNA levels of SASP factors. Data represented the mean ± standard deviation of at least 3 independent experiments. *p < 0.05, **p < 0.01, and ***p < 0.001
Fig. 4
Fig. 4
STCs released a significantly increased number of EVs. (A) The overview scheme of the EVs isolation. (B) Representative TEM images of Ctrl-EVs and Sen-EVs. Ctrl-EVs, EVs derived from untreated CRC cells. Sen-EVs, EVs derived from senescent CRC cells. (C and D) Western blot analysis of EVs markers and endoplasmic reticulum marker in whole cell lysates and EVs. (E) Concentration and size distribution of EVs assessed by NTA. (F) Quantitation of the relative EVs number per cell. The relative number of EVs per cell = (particle size concentration of EVs) × (volume of EVs)/total number of cells. (G) CRC cells were incubated with PKH67-labeled Sen-EVs for 18 h, and the uptaken of Sen-EVs was detected by fluorescence microscopy. Green fluorescence indicated PKH67, and blue fluorescence reflected nuclear staining with Hoechst 33342. Data represented the mean ± standard deviation of at least 3 independent experiments. *p < 0.05, **p < 0.01, and ***p < 0.001
Fig. 5
Fig. 5
EVs secreted from STCs further enhanced the malignant biological behaviors of recipient cancer cells. (A) CRC cells were incubated with or without EVs (15 µg/ml) and then analyzed for cell viability via CCK-8 assay. (B-E) CRC cells were cultured with or without EVs (15 µg/ml) for 48 h. Ctrl-EVs, EVs derived from untreated CRC cells. Sen-EVs, EVs from senescent CRC cells. (B) Cell migration and invasion abilities were analyzed by transwell assay. (C) Quantification of migratory cells, invasive cells, and wound-healing rates. (D) Representative wound-healing images of CRC cells. (E) E-cadherin, Snail, Slug, and MMP9 protein levels. Data represented the mean ± standard deviation of at least 3 independent experiments. *p < 0.05, **p < 0.01, and ***p < 0.001
Fig. 6
Fig. 6
SERPINE1 was enriched in EVs secreted from STCs. (A) Venn diagram illustrating the similarities and differences between our study and ExoCarta and Vesiclepedia databases. (B) Venn diagram showing overlaps between our study and the SASPAtlas. (C) Venn diagram depicting the proteins detected in our study and those detected from the HCT116 cell line in the NCI-60. (D) Volcano plot of differentially expressed proteins between Ctrl-EVs and Sen-EVs. (E and F) CRC cells were treated with CPT-11 for 96 h to induce senescence, and untreated CRC cells were used as a control. (E) SERPINE1 protein level in whole cell lysates and EVs. (F) SERPINE1 mRNA level in CRC cells. (G) EVs derived from STCs were treated with proteinase K in the presence or absence of Triton X-100 and analyzed by western blot. (H) Scheme of cells cultured with Sen-EVsSERPINE1−GFP. CRC cells were plated in dishes and transfected with GFP-SERPINE1. After 24 h, cells were treated with CPT-11 for 96 h to induce senescence. The cultured cells were washed twice with PBS and cultured in serum-free DMEM for 48 h, then the culture media was collected for Sen-EVsSERPINE1−GFP isolation. The recipient cells were co-incubated with the Sen-EVsSERPINE1−GFP (15 µg/ml) for 8 h and photographed under a fluorescent microscope. (I) Fluorescence imaging of CRC cells treated with Sen-EVsSERPINE1−GFP. (J) SERPINE1 protein level in Sen-EVs and Sen-EVsSERPINE1−GFP. (K) CRC cells were incubated with EVs (15 µg/ml) or PBS for 48 h and the protein expression of SERPINE1 was detected. Data represented the mean ± standard deviation of at least 3 independent experiments. *p < 0.05, **p < 0.01, and ***p < 0.001
Fig. 7
Fig. 7
SERPINE1 was responsible for the tumor-promoting effect of EVs secreted from STCs. (A) Cell viability of CRC cells cultured with EVs at the indicated time points. (B) Schematic illustration of the establishment of the in vivo tumor model. (C) The tumor growth curve. (D) Images of the excised xenograft tumors. (E) Measurement of tumor weight. (F) H&E and IHC staining of Ki-67. (G-I) CRC cells were cultured with EVs (15 µg/ml) for 48 h. (G) The migration and invasion abilities of recipient CRC cells were analyzed by transwell assay. (H) Quantification of migratory cells, invasive cells, and wound-healing rates. (I) SERPINE1, E-cadherin, Snail, Slug, and MMP9 protein levels. Data represented the mean ± standard deviation of at least 3 independent experiments. *p < 0.05, **p < 0.01, and ***p < 0.001
Fig. 8
Fig. 8
SERPINE1 promoted NF-κB p65 nuclear translocation. (A) GFP-SERPINE1 plasmids were transfected into 293T cells, the GFP-Mock plasmids were used as control. We immunoprecipitated extracts from whole cell lysates with anti-GFP antibody and analyzed the resulting complexes by LC-MS/MS. Venn diagram showed the proteins pulled down in GFP-SERPINE1 group and GFP-Mock group. (B and C) Co-IP of endogenous interaction of p65 and SERPINE1 in RKO cells. (D) Co-IP of exogenous interaction of p65 and SERPINE1 in 293T cells. (E and F) CRC cells were co-cultured with Sen-EVs (15 µg/ml) for 48 h. (E) Cellular distribution of SERPINE1, p65, and p-p65 was detected. (F) Representative images of immunofluorescence staining displaying the co-localization of SERPINE1 (red) and p65 (green). DAPI: blue. Line chart of fluorescence signal positioning analysis
Fig. 9
Fig. 9
SERPINE1 expression was elevated in tumors after NAT and predicted poor prognosis in cohort 1. (A) IHC staining of SERPINE1 in matched LARC tissues. (B) The IRS of SERPINE1 in matched LARC tissues. (C) OS of CRC patients from the TCGA database. (D) OS and (E) RFS of colon patients from the Kaplan-Meier plotter database. (F) DFS of 22 LARC patients in cohort 1. The plot was generated according to the difference between pre-NAT IRS and post-NAT IRS of SERPINE1 (SERPINE1-diff). *p < 0.05, **p < 0.01, and ***p < 0.001

Similar articles

Cited by

References

    1. Sung H, Ferlay J, Siegel RL, Laversanne M, Soerjomataram I, Jemal A, et al. Global Cancer statistics 2020: GLOBOCAN estimates of incidence and Mortality Worldwide for 36 cancers in 185 countries. CA Cancer J Clin. 2021;71(3):209–49. doi: 10.3322/caac.21660. - DOI - PubMed
    1. López-Otín C, Blasco MA, Partridge L, Serrano M, Kroemer G. Hallmarks of aging: an expanding universe. Cell. 2023;186(2):243–78. doi: 10.1016/j.cell.2022.11.001. - DOI - PubMed
    1. Gorgoulis V, Adams PD, Alimonti A, Bennett DC, Bischof O, Bishop C, et al. Cellular Senescence: defining a path Forward. Cell. 2019;179(4):813–27. doi: 10.1016/j.cell.2019.10.005. - DOI - PubMed
    1. Wang L, Lankhorst L, Bernards R. Exploiting senescence for the treatment of cancer. Nat Rev Cancer. 2022;22(6):340–55. doi: 10.1038/s41568-022-00450-9. - DOI - PubMed
    1. Huang W, Hickson LJ, Eirin A, Kirkland JL, Lerman LO. Cellular senescence: the good, the bad and the unknown. Nat Rev Nephrol. 2022;18(10):611–27. doi: 10.1038/s41581-022-00601-z. - DOI - PMC - PubMed

MeSH terms