

Enhancing endometrial receptivity: the roles of human chorionic gonadotropin in autophagy and apoptosis regulation in endometrial stromal cells
- PMID: 38576003
- PMCID: PMC10993617
- DOI: 10.1186/s12958-024-01205-x
Enhancing endometrial receptivity: the roles of human chorionic gonadotropin in autophagy and apoptosis regulation in endometrial stromal cells
Abstract
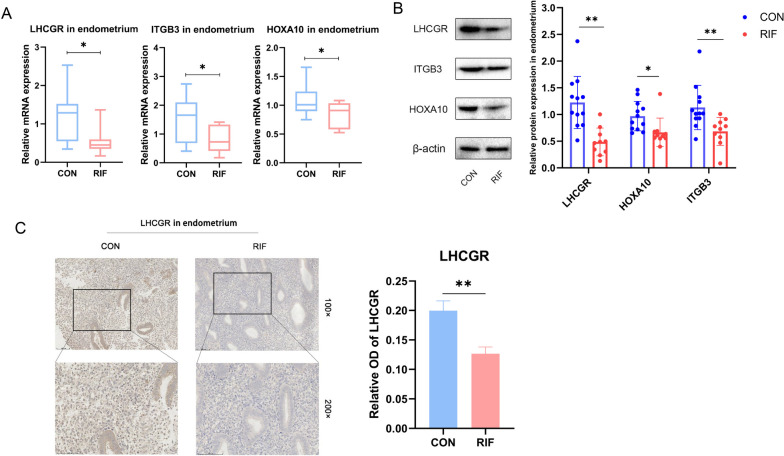
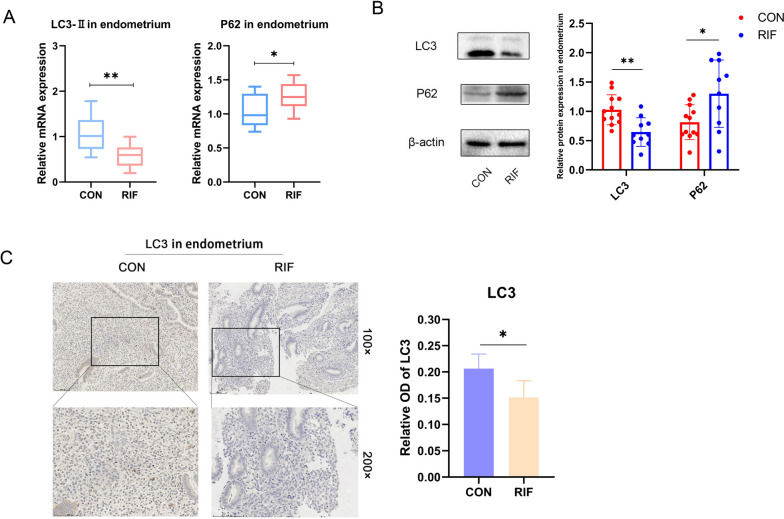
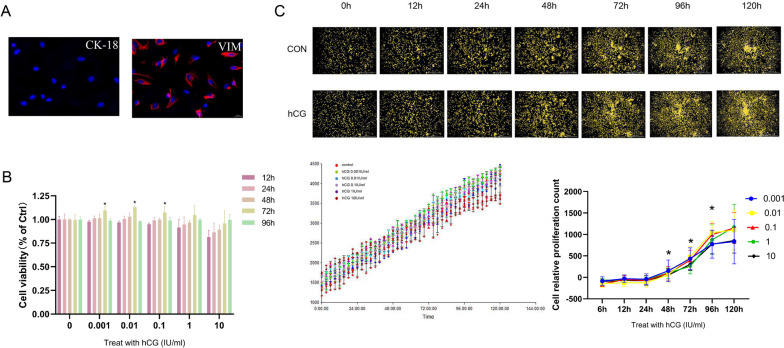
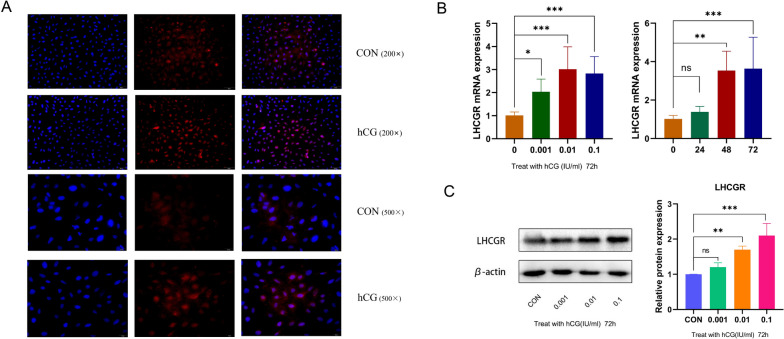
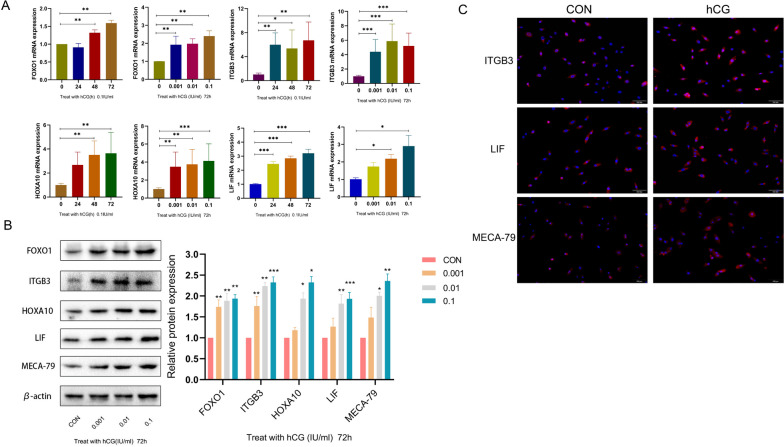
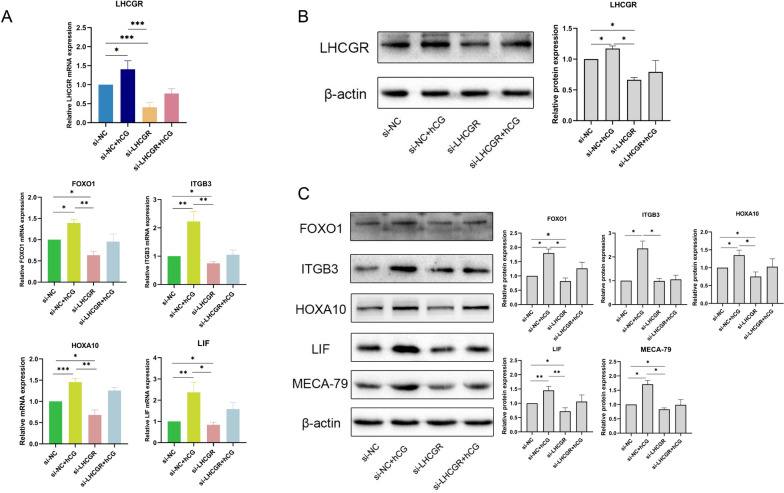
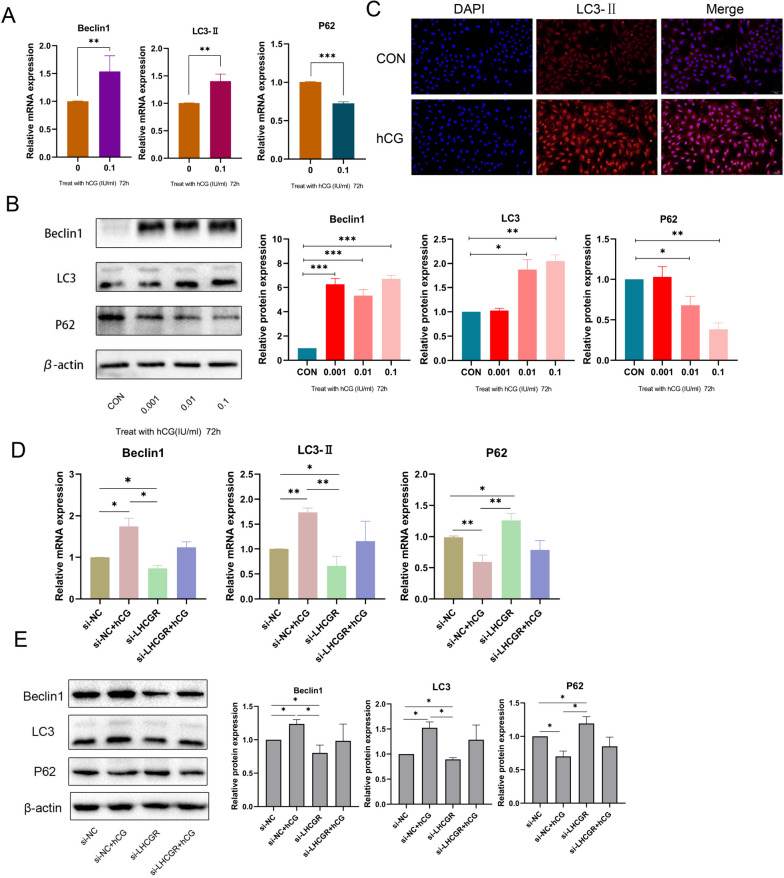
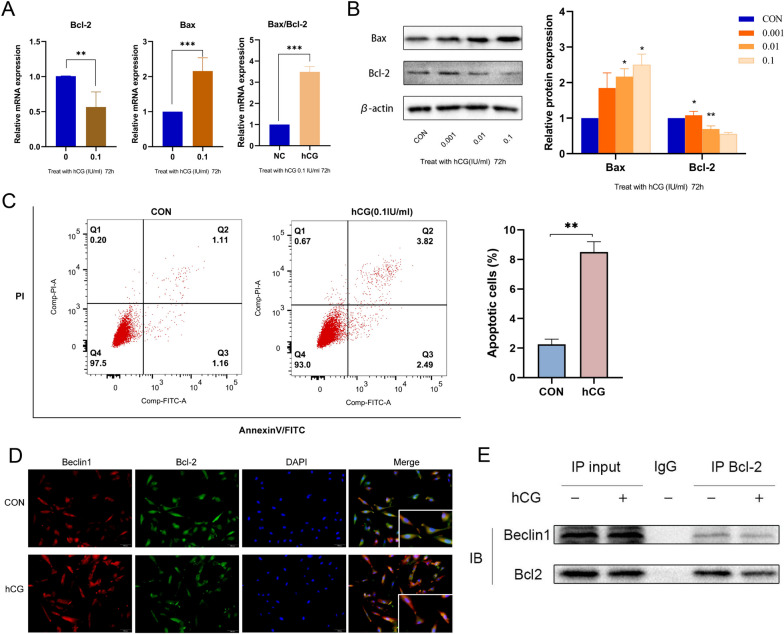
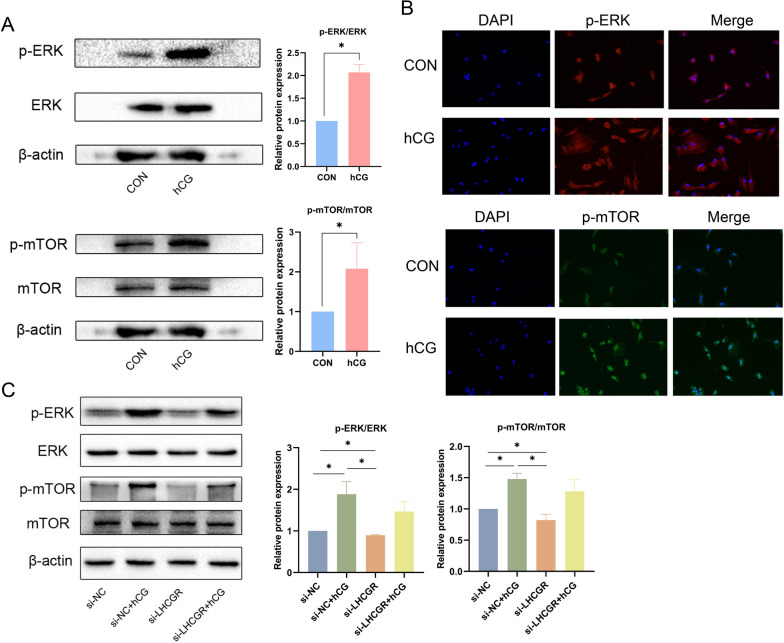
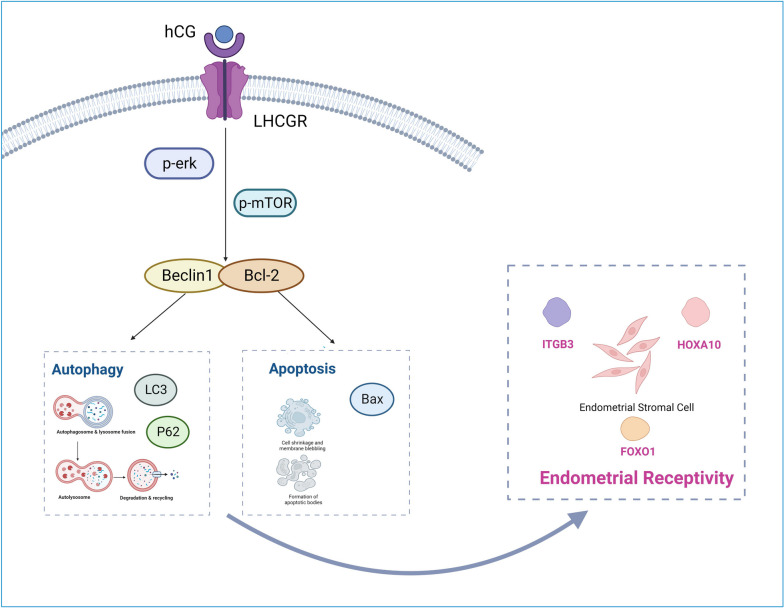
Inadequate endometrial receptivity often results in embryo implantation failure and miscarriage. Human chorionic gonadotropin (hCG) is a key signaling molecule secreted during early embryonic development, which regulates embryonic maternal interface signaling and promotes embryo implantation. This study aimed to examine the impact of hCG on endometrial receptivity and its underlying mechanisms. An exploratory study was designed, and endometrial samples were obtained from women diagnosed with simple tubal infertility or male factor infertile (n = 12) and recurrent implantation failure (RIF, n = 10). Using reverse transcription-quantitative PCR and western blotting, luteinizing hormone (LH)/hCG receptor (LHCGR) levels and autophagy were detected in the endometrial tissues. Subsequently, primary endometrial stromal cells (ESCs) were isolated from these control groups and treated with hCG to examine the presence of LHCGR and markers of endometrial receptivity (HOXA10, ITGB3, FOXO1, LIF, and L-selectin ligand) and autophagy-related factors (Beclin1, LC3, and P62). The findings revealed that the expressions of receptivity factors, LHCGR, and LC3 were reduced in the endometrial tissues of women with RIF compared with the control group, whereas the expression of P62 was elevated. The administration of hCG to ESCs specifically activated LHCGR, stimulating an increase in the endometrial production of HOXA10, ITGB3, FOXO1, LIF and L-selectin ligands. Furthermore, when ESCs were exposed to 0.1 IU/mL hCG for 72 h, the autophagy factors Beclin1 and LC3 increased within the cells and P62 decreased. Moreover, the apoptotic factor Bax increased and Bcl-2 declined. However, when small interfering RNA was used to knock down LHCGR, hCG was less capable of controlling endometrial receptivity and autophagy molecules in ESCs. In addition, hCG stimulation enhanced the phosphorylation of ERK1/2 and mTOR proteins. These results suggest that women with RIF exhibit lower levels of LHCGR and compromised autophagy function in their endometrial tissues. Thus, hCG/LHCGR could potentially improve endometrial receptivity by modulating autophagy and apoptosis.
© 2024. The Author(s).
Conflict of interest statement
The authors declare no competing interests.
Figures
Similar articles
-
hCG activates Epac-Erk1/2 signaling regulating Progesterone Receptor expression and function in human endometrial stromal cells.Mol Hum Reprod. 2017 Jun 1;23(6):393-405. doi: 10.1093/molehr/gax015. Mol Hum Reprod. 2017. PMID: 28333280
-
Too much of a good thing? Experimental evidence suggests prolonged exposure to hCG is detrimental to endometrial receptivity.Hum Reprod. 2013 Jun;28(6):1610-9. doi: 10.1093/humrep/det055. Epub 2013 Mar 20. Hum Reprod. 2013. PMID: 23515188
-
Human chorionic gonadotropin improves endometrial receptivity by increasing the expression of homeobox A10.Mol Hum Reprod. 2020 Jun 1;26(6):413-424. doi: 10.1093/molehr/gaaa026. Mol Hum Reprod. 2020. PMID: 32502249
-
Dialogue between blastocyst hCG and endometrial LH/hCG receptor: which role in implantation?Gynecol Obstet Invest. 2007;64(3):156-60. doi: 10.1159/000101740. Epub 2007 Oct 4. Gynecol Obstet Invest. 2007. PMID: 17934312 Review.
-
On the role of human chorionic gonadotropin (hCG) in the embryo-endometrial microenvironment: implications for differentiation and implantation.Semin Reprod Med. 2001;19(1):37-47. doi: 10.1055/s-2001-13909. Semin Reprod Med. 2001. PMID: 11394202 Review.
Cited by
-
Bibliometric analysis of the links between embryo transfer and endometrial receptivity: Mapping knowledge landscapes and emerging trends (2005-2024).Medicine (Baltimore). 2025 Apr 25;104(17):e42014. doi: 10.1097/MD.0000000000042014. Medicine (Baltimore). 2025. PMID: 40295290 Free PMC article.
-
Exploring the mechanism of action of aspirin in improving endometrial receptivity in PCOS rats based on uterine lavage fluid metabolomics.PLoS One. 2025 May 22;20(5):e0324432. doi: 10.1371/journal.pone.0324432. eCollection 2025. PLoS One. 2025. PMID: 40403007 Free PMC article.
-
Short and long duration testosterone treatments induce reversable subfertility in female mice using a gestational model of gender-affirming hormone therapy.Hum Reprod. 2025 Apr 1;40(4):695-706. doi: 10.1093/humrep/deaf016. Hum Reprod. 2025. PMID: 39935255
-
Controversial Roles of Autophagy in Adenomyosis and Its Implications for Fertility Outcomes-A Systematic Review.J Clin Med. 2024 Dec 10;13(24):7501. doi: 10.3390/jcm13247501. J Clin Med. 2024. PMID: 39768424 Free PMC article. Review.
-
The pathogenesis, diagnosis, and treatment of chronic endometritis: a comprehensive review.Front Endocrinol (Lausanne). 2025 Jun 12;16:1603570. doi: 10.3389/fendo.2025.1603570. eCollection 2025. Front Endocrinol (Lausanne). 2025. PMID: 40575265 Free PMC article. Review.
References
MeSH terms
Substances
Grants and funding
LinkOut - more resources
Full Text Sources
Research Materials
Miscellaneous
