

Predicting the fundamental thermal niche of ectotherms
- PMID: 38578245
- PMCID: PMC11374413
- DOI: 10.1002/ecy.4289
Predicting the fundamental thermal niche of ectotherms
Abstract
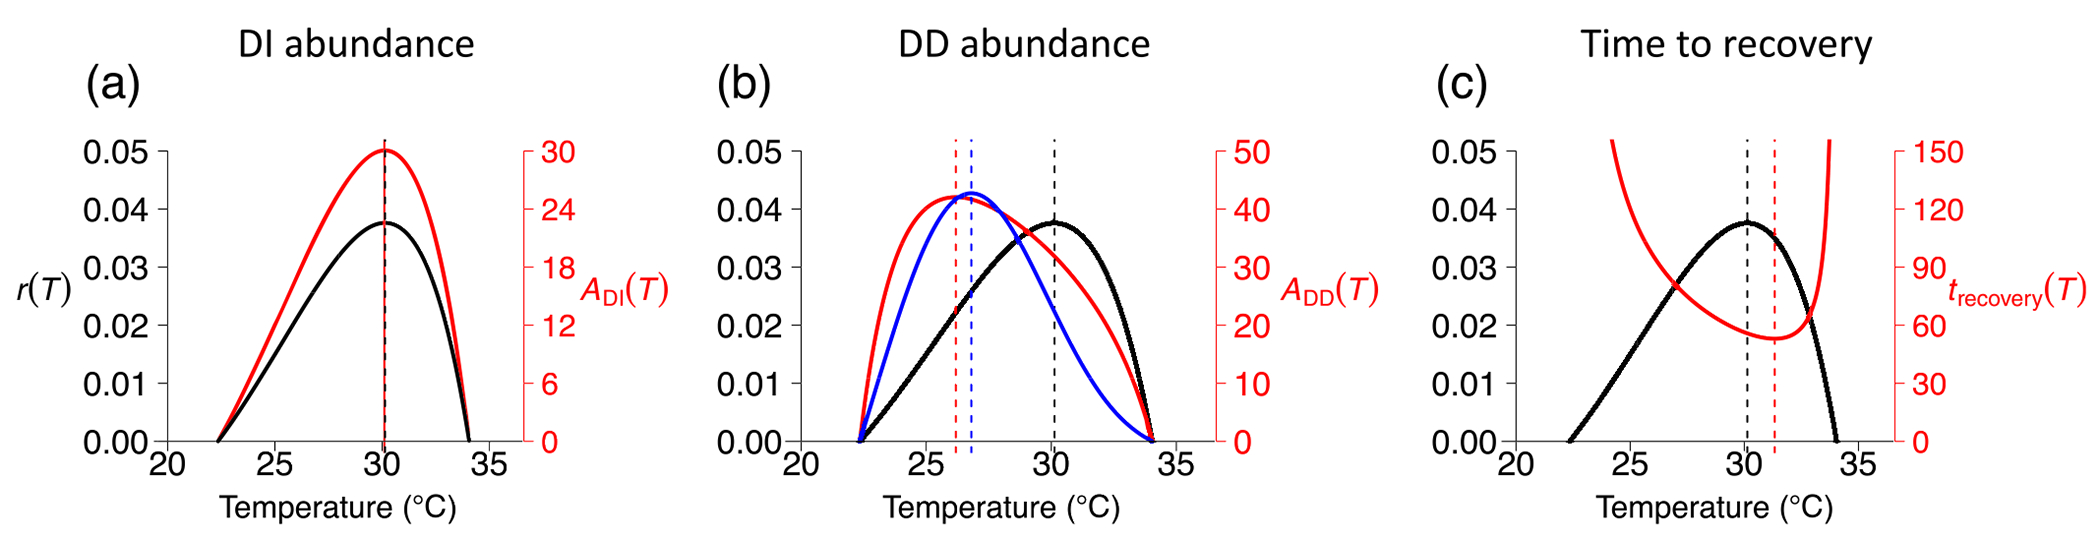
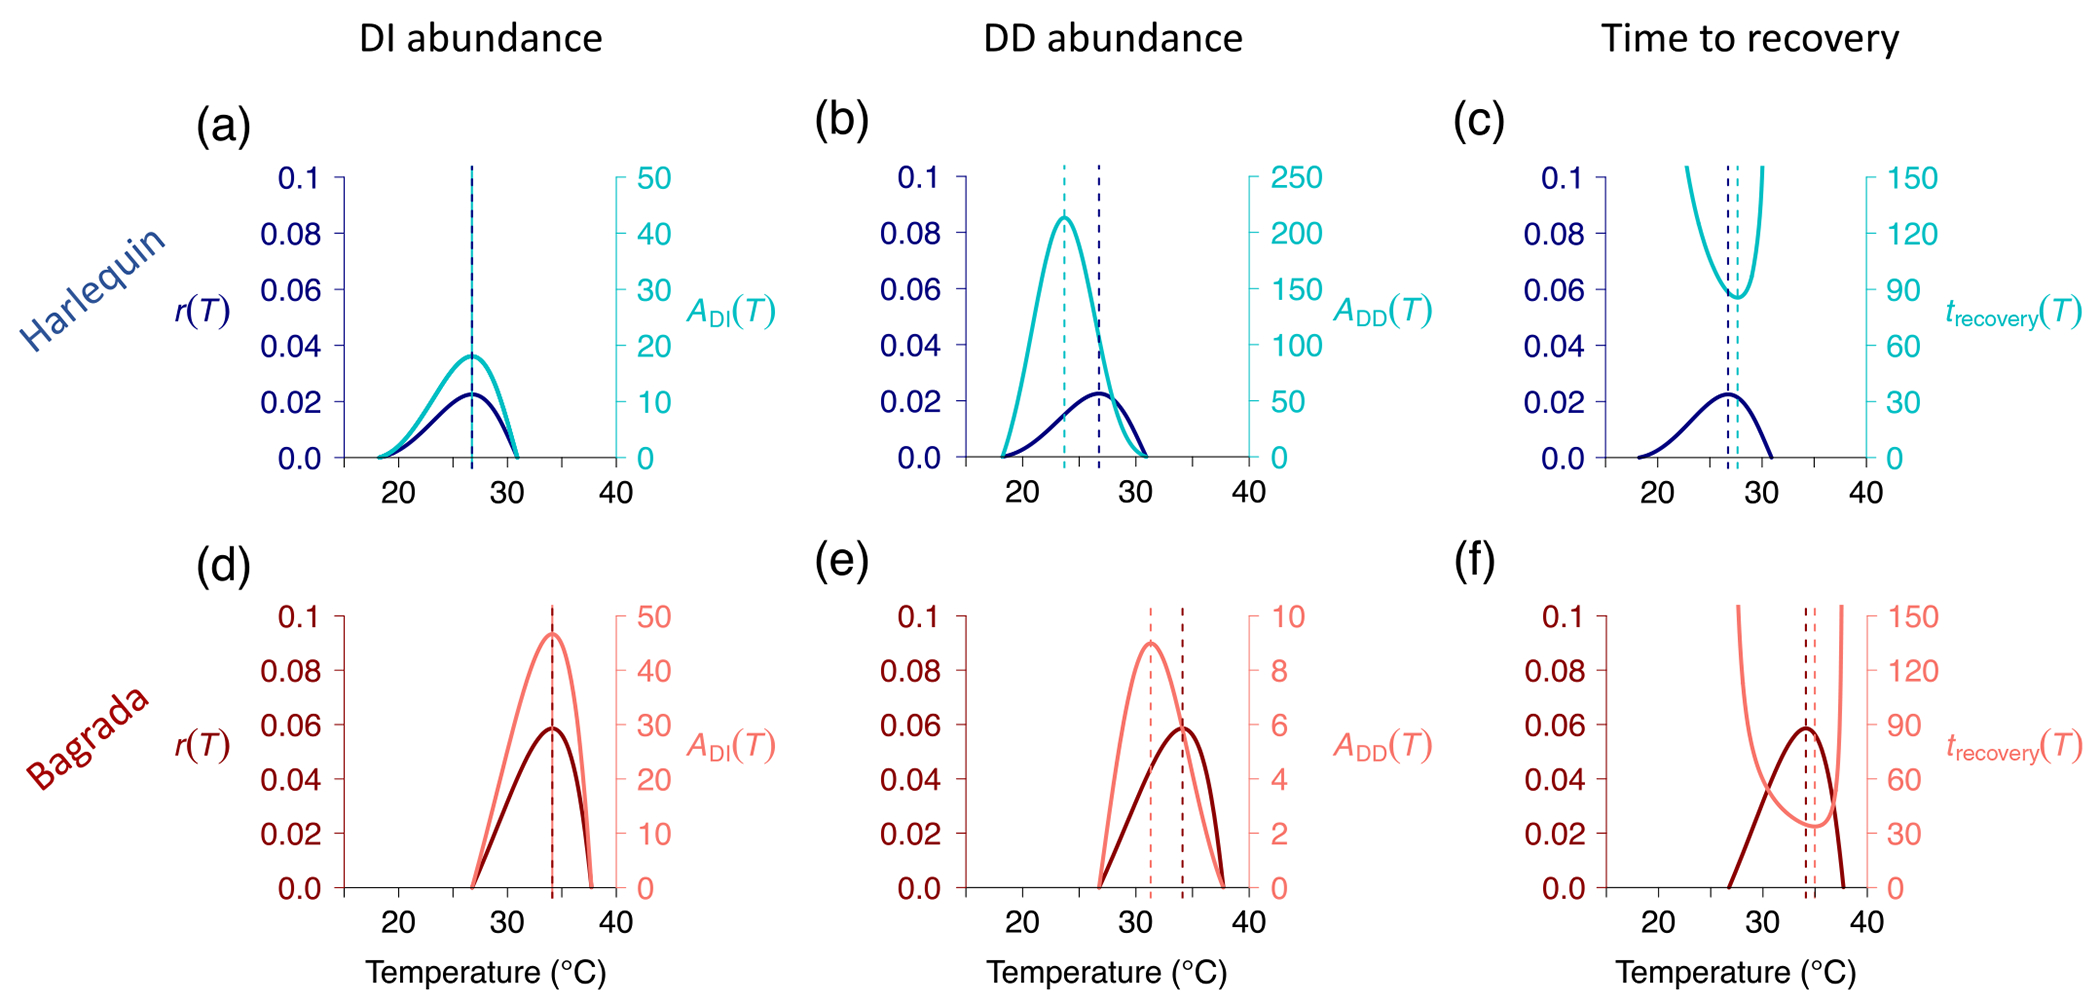
Climate warming is predicted to increase mean temperatures and thermal extremes on a global scale. Because their body temperature depends on the environmental temperature, ectotherms bear the full brunt of climate warming. Predicting the impact of climate warming on ectotherm diversity and distributions requires a framework that can translate temperature effects on ectotherm life-history traits into population- and community-level outcomes. Here we present a mechanistic theoretical framework that can predict the fundamental thermal niche and climate envelope of ectotherm species based on how temperature affects the underlying life-history traits. The advantage of this framework is twofold. First, it can translate temperature effects on the phenotypic traits of individual organisms to population-level patterns observed in nature. Second, it can predict thermal niches and climate envelopes based solely on trait response data and, hence, completely independently of any population-level information. We find that the temperature at which the intrinsic growth rate is maximized exceeds the temperature at which abundance is maximized under density-dependent growth. As a result, the temperature at which a species will increase the fastest when rare is lower than the temperature at which it will recover from a perturbation the fastest when abundant. We test model predictions using data from a naturalized-invasive interaction to identify the temperatures at which the invasive can most easily invade the naturalized's habitat and the naturalized is most likely to resist the invasive. The framework is sufficiently mechanistic to yield reliable predictions for individual species and sufficiently broad to apply across a range of ectothermic taxa. This ability to predict the thermal niche before a species encounters a new thermal environment is essential to mitigating some of the major effects of climate change on ectotherm populations around the globe.
Keywords: climate envelope; conditions for population viability; delay differential equation population model; density‐independent abundance; temperature response of abundance; temperature response of life‐history traits.
© 2024 The Authors. Ecology published by Wiley Periodicals LLC on behalf of The Ecological Society of America.
Conflict of interest statement
CONFLICT OF INTEREST STATEMENT
The authors declare no conflicts of interest.
Figures


References
-
- Amarasekare P. 2015. “Effects of Temperature on Consumer–Resource Interactions.” Journal of Animal Ecology 84(3): 665–679. - PubMed
-
- Amarasekare P, and Johnson C. 2017. “Evolution of Thermal Reaction Norms in Seasonally Varying Environments.” The American Naturalist 189(3): E31–E45. - PubMed
-
- Amarasekare P, and Coutinho R. 2013. “The Intrinsic Growth Rate as a Predictor of Intrinsic Growth Rate under Climate Warming.” Journal of Animal Ecology 82: 1240–53. - PubMed
-
- Amarasekare P, and Coutinho R. 2014. “Effects of Temperature on Intra-Specific Competition in Ectotherms.” The American Naturalist 184: E50–E65. - PubMed
Publication types
MeSH terms
Grants and funding
LinkOut - more resources
Full Text Sources
Other Literature Sources
Medical
Research Materials