. 2024 Jun 3;30(11):2582-2597.
doi: 10.1158/1078-0432.CCR-24-0246.

Stabilizing Tumor-Resident Mast Cells Restores T-Cell Infiltration and Sensitizes Sarcomas to PD-L1 Inhibition

Affiliations

Stabilizing Tumor-Resident Mast Cells Restores T-Cell Infiltration and Sensitizes Sarcomas to PD-L1 Inhibition

Myrofora Panagi et al. Clin Cancer Res. .

Abstract

Purpose: To explore the cellular cross-talk of tumor-resident mast cells (MC) in controlling the activity of cancer-associated fibroblasts (CAF) to overcome tumor microenvironment (TME) abnormalities, enhancing the efficacy of immune-checkpoint inhibitors in sarcoma.

Experimental design: We used a coculture system followed by further validation in mouse models of fibrosarcoma and osteosarcoma with or without administration of the MC stabilizer and antihistamine ketotifen. To evaluate the contribution of ketotifen in sensitizing tumors to therapy, we performed combination studies with doxorubicin chemotherapy and anti-PD-L1 (B7-H1, clone 10F.9G2) treatment. We investigated the ability of ketotifen to modulate the TME in human sarcomas in the context of a repurposed phase II clinical trial.

Results: Inhibition of MC activation with ketotifen successfully suppressed CAF proliferation and stiffness of the extracellular matrix accompanied by an increase in vessel perfusion in fibrosarcoma and osteosarcoma as indicated by ultrasound shear wave elastography imaging. The improved tissue oxygenation increased the efficacy of chemoimmunotherapy, supported by enhanced T-cell infiltration and acquisition of tumor antigen-specific memory. Importantly, the effect of ketotifen in reducing tumor stiffness was further validated in sarcoma patients, highlighting its translational potential.

Conclusions: Our study suggests the targeting of MCs with clinically administered drugs, such as antihistamines, as a promising approach to overcome resistance to immunotherapy in sarcomas.


Figures

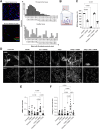
Figure 1. Inhibition of mast cell degranulation suppresses myofibroblast differentiation and activity. A, Representative fluorescence images of human tissue arrays showing the proximity of tryptase-positive mast cells (green color) to αSMA-positive CAFs (red color) in tumor tissue (top) as compared with normal tissue (bottom); scale bar = 0.2 mm (n = 4–6 human tissue arrays). B, Transwell coculture system used for the in vitro evaluation of MC/9 mast cells and NIH3T3 fibroblasts interaction. C, Inhibition of MC/9 degranulation after exposure to ketotifen. For the analysis of MC degranulation, we measured the release of β-hexosaminidase into the culture medium (n = 3 independent experiments, N = 6 technical replicates per experiment). D, Images of immunofluorescence staining of αSMA and collagen I in fibroblasts; scale bar = 0.1 mm. E, Quantification of αSMA and (F) collagen I–positive staining normalized to DAPI nuclear staining. Data, mean ± SE. For C, E, and F, statistical analyses were performed by comparing means between two independent groups using the ordinary one-way ANOVA test. (B, Created with BioRender.com.)
Figure 1.
Inhibition of mast cell degranulation suppresses myofibroblast differentiation and activity. A, Representative fluorescence images of human tissue arrays showing the proximity of tryptase-positive mast cells (green color) to αSMA-positive CAFs (red color) in tumor tissue (top) as compared with normal tissue (bottom); scale bar = 0.2 mm (n = 4–6 human tissue arrays). B, Transwell coculture system used for the in vitro evaluation of MC/9 mast cells and NIH3T3 fibroblasts interaction. C, Inhibition of MC/9 degranulation after exposure to ketotifen. For the analysis of MC degranulation, we measured the release of β-hexosaminidase into the culture medium (n = 3 independent experiments, N = 6 technical replicates per experiment). D, Images of immunofluorescence staining of αSMA and collagen I in fibroblasts; scale bar = 0.1 mm. E, Quantification of αSMA and (F) collagen I–positive staining normalized to DAPI nuclear staining. Data, mean ± SE. For C, E, and F, statistical analyses were performed by comparing means between two independent groups using the ordinary one-way ANOVA test. (B, Created with BioRender.com.)
Figure 2. Ketotifen alleviates tumor stiffness. A, Study treatment protocol for the MCA205 and K7M2 tumor models. For the MCA205 model, ketotifen was administered at 1, 5, 10, and 25 mg/kg daily via intraperitoneal injection for 8 days once tumor size reached an average volume of 60 mm3. For the K7M2 model, ketotifen was administered at 10 mg/kg daily via intraperitoneal injection for 8 days once tumor size reached an average volume of 150 mm3. B, Representative SWE images of MCA205 tumors treated with saline and ketotifen 10 mg/kg. The dashed line denotes the tumor region, and the color map indicates the different magnitudes of elastic modulus in kPa. C, Temporal changes in elastic modulus of MC205 and (D) K7M2 tumors during the treatment protocol. Data are presented as mean ± SE. Statistical analyses were performed by comparing means between two independent groups using the two-way ANOVA test (n = 5 mice, N = 2 image fields per mouse, each point represents the average value of 2 images). E, Table with demographics and the effect of ketotifen on tumor stiffness in sarcoma patients. F, Representative SWE images of tumors pre- and post-ketotifen treatment. G, Graph showing the tumor elastic modulus before and after ketotifen treatment for each patient. Data, mean ± SE. Statistical analyses were performed by comparing means between two independent groups using the ordinary one-way ANOVA test. (A, Created with BioRender.com.)
Figure 2.
Ketotifen alleviates tumor stiffness. A, Study treatment protocol for the MCA205 and K7M2 tumor models. For the MCA205 model, ketotifen was administered at 1, 5, 10, and 25 mg/kg daily via intraperitoneal injection for 8 days once tumor size reached an average volume of 60 mm3. For the K7M2 model, ketotifen was administered at 10 mg/kg daily via intraperitoneal injection for 8 days once tumor size reached an average volume of 150 mm3. B, Representative SWE images of MCA205 tumors treated with saline and ketotifen 10 mg/kg. The dashed line denotes the tumor region, and the color map indicates the different magnitudes of elastic modulus in kPa. C, Temporal changes in elastic modulus of MC205 and (D) K7M2 tumors during the treatment protocol. Data are presented as mean ± SE. Statistical analyses were performed by comparing means between two independent groups using the two-way ANOVA test (n = 5 mice, N = 2 image fields per mouse, each point represents the average value of 2 images). E, Table with demographics and the effect of ketotifen on tumor stiffness in sarcoma patients. F, Representative SWE images of tumors pre- and post-ketotifen treatment. G, Graph showing the tumor elastic modulus before and after ketotifen treatment for each patient. Data, mean ± SE. Statistical analyses were performed by comparing means between two independent groups using the ordinary one-way ANOVA test. (A, Created with BioRender.com.)
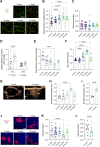
Figure 3. Ketotifen reprograms the TME by normalizing CAFs, collagen, and hyaluronan. A, Representative immunofluorescence images of Ki67 proliferation marker (red) and αSMA (green) in MCA205 fibrosarcoma tumors; scale bar = 0.2 μm. B, Quantification of CAFs positive for both the αSMA and Ki67 markers, normalized to total αSMA staining. C, Quantification of mRNA expression levels of Col1A1 and ACTA2 (i.e., the gene encoding αSMA) in untreated and ketotifen (10 mg/kg) treated MCA205 tumors using the 2−ΔΔCT method (3 biological × 3 technical replicates were used). D, Representative bright field images of picrosirius red staining in MCA205 paraffin sections; scale bar, 0.5 mm. E, Quantification of the area positive for picrosirius red staining in MCA205 fibrosarcoma and (F) K7M2 osteosarcoma tumors. G, Representative immunofluorescence images of MCA205 paraffin sections stained with anti-HABP1; scale bar, 0.2 mm. H, Quantification of the fraction of area positive for HABP1 staining (green) normalized to DAPI (blue) stain in MCA205 tumors. For histologic analysis, n = 4 tumors per group were stained, and N = 5–6 image fields were captured per tumor. Data are presented as mean ± SE. For B, C, E, and H, statistical analyses were performed by comparing means between two independent groups using the ordinary one-way ANOVA test and for F using the unpaired parametric Welch t test.
Figure 3.
Ketotifen reprograms the TME by normalizing CAFs, collagen, and hyaluronan. A, Representative immunofluorescence images of Ki67 proliferation marker (red) and αSMA (green) in MCA205 fibrosarcoma tumors; scale bar = 0.2 μm. B, Quantification of CAFs positive for both the αSMA and Ki67 markers, normalized to total αSMA staining. C, Quantification of mRNA expression levels of Col1A1 and ACTA2 (i.e., the gene encoding αSMA) in untreated and ketotifen (10 mg/kg) treated MCA205 tumors using the 2−ΔΔCT method (3 biological × 3 technical replicates were used). D, Representative bright field images of picrosirius red staining in MCA205 paraffin sections; scale bar, 0.5 mm. E, Quantification of the area positive for picrosirius red staining in MCA205 fibrosarcoma and (F) K7M2 osteosarcoma tumors. G, Representative immunofluorescence images of MCA205 paraffin sections stained with anti-HABP1; scale bar, 0.2 mm. H, Quantification of the fraction of area positive for HABP1 staining (green) normalized to DAPI (blue) stain in MCA205 tumors. For histologic analysis, n = 4 tumors per group were stained, and N = 5–6 image fields were captured per tumor. Data are presented as mean ± SE. For B, C, E, and H, statistical analyses were performed by comparing means between two independent groups using the ordinary one-way ANOVA test and for F using the unpaired parametric Welch t test.
Figure 4. Ketotifen restores tumor vessel functionality and perfusion. A, Representative immunofluorescence images of NG2 pericyte marker (green) and CD31 endothelial cell marker (red) of MCA205 tumors upon treatment with different ketotifen concentrations; scale bar = 0.1 mm. B, Quantification of vessel pericyte coverage as indicated by CD31 and NG2 overlapping staining (yellow) normalized to total CD31+ staining. C, Quantification of area fraction positive for CD31 staining (vessels; n = 5 mice per group, N = 3–5 image fields per mouse). D, Quantification of mRNA expression levels of IFNγ and VEGF in untreated and ketotifen (10 mg/kg) treated MCA205 tumors using the 2−ΔΔCT method (3 biological × 3 technical replicates were used). E, Interstitial fluid pressure levels in untreated and daily ketotifen-treated mice for 7 days (n = 7 mice per treatment group). F, Quantification of open lumen fraction in MCA205 tumors based on CD31 image analysis. G, Representative contrast-enhanced ultrasound images of microbubbles (yellow) entering MCA205 tumors for control and 10 mg/kg ketotifen-treated tumors at the time of peak intensity. The dashed line shows the tumor margin. H, Normalized perfused area with respect to the total tumor area at the time of peak intensity for MCA205 and (I) K7M2 tumors, after completion of treatment protocol (Fig. 2A; n = 4–5). J, Representative immunofluorescence images of MCA205 paraffin sections stained for pimonidazole adducts following pimonidazole hydrochloride injection; scale bar = 0.2 mm. Quantification of hypoxia area fraction (red) normalized to DAPI stain (blue) of (K) MCA205 and (L) K7M2 tumors (n = 5 mice per group, N = 3–5 image fields per mouse). Data are presented as mean ± SE. Statistical analyses were performed by comparing means between two independent groups using the two independent groups using the ordinary one-way ANOVA test for B, D–F, H, K–L and the unpaired parametric Welch t test for C and I.
Figure 4.
Ketotifen restores tumor vessel functionality and perfusion. A, Representative immunofluorescence images of NG2 pericyte marker (green) and CD31 endothelial cell marker (red) of MCA205 tumors upon treatment with different ketotifen concentrations; scale bar = 0.1 mm. B, Quantification of vessel pericyte coverage as indicated by CD31 and NG2 overlapping staining (yellow) normalized to total CD31+ staining. C, Quantification of area fraction positive for CD31 staining (vessels; n = 5 mice per group, N = 3–5 image fields per mouse). D, Quantification of mRNA expression levels of IFNγ and VEGF in untreated and ketotifen (10 mg/kg) treated MCA205 tumors using the 2−ΔΔCT method (3 biological × 3 technical replicates were used). E, Interstitial fluid pressure levels in untreated and daily ketotifen-treated mice for 7 days (n = 7 mice per treatment group). F, Quantification of open lumen fraction in MCA205 tumors based on CD31 image analysis. G, Representative contrast-enhanced ultrasound images of microbubbles (yellow) entering MCA205 tumors for control and 10 mg/kg ketotifen-treated tumors at the time of peak intensity. The dashed line shows the tumor margin. H, Normalized perfused area with respect to the total tumor area at the time of peak intensity for MCA205 and (I) K7M2 tumors, after completion of treatment protocol (Fig. 2A; n = 4–5). J, Representative immunofluorescence images of MCA205 paraffin sections stained for pimonidazole adducts following pimonidazole hydrochloride injection; scale bar = 0.2 mm. Quantification of hypoxia area fraction (red) normalized to DAPI stain (blue) of (K) MCA205 and (L) K7M2 tumors (n = 5 mice per group, N = 3–5 image fields per mouse). Data are presented as mean ± SE. Statistical analyses were performed by comparing means between two independent groups using the two independent groups using the ordinary one-way ANOVA test for B, DF, H, KL and the unpaired parametric Welch t test for C and I.
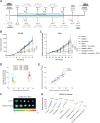
Figure 5. Ketotifen enhances long-term response to chemoimmunotherapy combination treatment. A, Study treatment protocol for the MCA205 and K7M2 tumor model. Ketotifen was given daily until the completion of the study, once the tumors were palpable. For the MCA205 tumor model, the first cycle of doxorubicin or/and anti–PD-L1 (aPD-L1) treatment was administered via intraperitoneal injection on day 7, allowing ketotifen to prime the TME. Two additional cycles of doxorubicin or/and anti–PD-L1 were followed on days 10 and 13 for MCA205. Shear wave elastography measurements were obtained on day 7 right before chemoimmunotherapy initiation, on day 11, and after completion of the three treatment cycles (day 15). Primary tumors were excised on day 16. On day 63, survivors were rechallenged with the MCA205 cell line, and tumor volume was monitored for 24 days. For the K7M2 tumor model, doxorubicin or/and anti–PD-L1 treatment was administered on days 22, 25, 28, and 31. Shear wave elastography measurements were obtained on day 22 right before chemoimmunotherapy initiation and on day 32. Mice were sacrificed and primary tumors were excised on day 33. B, Growth curves of MCA205 tumors treated as indicated until day 16 (n = 10 mice per group). C, Relative growth curves of K7M2 tumors treated as indicated (n = 6 mice per group). Data are presented as mean ± SE. Statistical analyses were performed by comparing means between two independent groups using the two-way ANOVA test with Dunnett correction. D, Clustering of the experimental average tumor growth after treatment and elastic modulus. Error bars present the mean ± SD of clusters. E, Linear regression of tumor growth rate after treatment (Vr) as a function of elastic modulus (E), initial volume at the beginning of treatment (V0), tumor type, and treatment. Vr = a E + b V0 + c E V0 + d, where the parameters a, b, and c depend on tumor type and d on treatment and tumor type. The fitted model has a coefficient of regression (R2) equal to 0.79. F, Ex vivo immunofluorescence images of ketotifen or control K7M2 tumors 6 hours after the intravenous injection of the Atto 680-anti–PD-L1 antibody. G, Individual growth curves of MCA205 tumors after rechallenging survivors. Age-matched naïve mice were used as control. (A, Created with BioRender.com.)
Figure 5.
Ketotifen enhances long-term response to chemoimmunotherapy combination treatment. A, Study treatment protocol for the MCA205 and K7M2 tumor model. Ketotifen was given daily until the completion of the study, once the tumors were palpable. For the MCA205 tumor model, the first cycle of doxorubicin or/and anti–PD-L1 (aPD-L1) treatment was administered via intraperitoneal injection on day 7, allowing ketotifen to prime the TME. Two additional cycles of doxorubicin or/and anti–PD-L1 were followed on days 10 and 13 for MCA205. Shear wave elastography measurements were obtained on day 7 right before chemoimmunotherapy initiation, on day 11, and after completion of the three treatment cycles (day 15). Primary tumors were excised on day 16. On day 63, survivors were rechallenged with the MCA205 cell line, and tumor volume was monitored for 24 days. For the K7M2 tumor model, doxorubicin or/and anti–PD-L1 treatment was administered on days 22, 25, 28, and 31. Shear wave elastography measurements were obtained on day 22 right before chemoimmunotherapy initiation and on day 32. Mice were sacrificed and primary tumors were excised on day 33. B, Growth curves of MCA205 tumors treated as indicated until day 16 (n = 10 mice per group). C, Relative growth curves of K7M2 tumors treated as indicated (n = 6 mice per group). Data are presented as mean ± SE. Statistical analyses were performed by comparing means between two independent groups using the two-way ANOVA test with Dunnett correction. D, Clustering of the experimental average tumor growth after treatment and elastic modulus. Error bars present the mean ± SD of clusters. E, Linear regression of tumor growth rate after treatment (Vr) as a function of elastic modulus (E), initial volume at the beginning of treatment (V0), tumor type, and treatment. Vr = a E + b V0 + c E V0 + d, where the parameters a, b, and c depend on tumor type and d on treatment and tumor type. The fitted model has a coefficient of regression (R2) equal to 0.79. F,Ex vivo immunofluorescence images of ketotifen or control K7M2 tumors 6 hours after the intravenous injection of the Atto 680-anti–PD-L1 antibody. G, Individual growth curves of MCA205 tumors after rechallenging survivors. Age-matched naïve mice were used as control. (A, Created with BioRender.com.)
Figure 6. Ketotifen pretreatment enhances the antitumor effects of immunotherapy by promoting T-cell recruitment and cytotoxic immune responses. A, Flow cytometry data. Percentage of the total CD3+ T cells among CD45+ lymphocytes in the whole tumor tissue of MCA205 tumor models treated as indicated. B, Flow cytometry data. Ratio of cytotoxic CD3+CD8+ T cells to CD3+CD4+CD25hiCD127loFoxp3+ Tregs (n = 5 mice per group). C, Representative images of IF staining of CD8 (green) and Ki67 (red) in K7M2 paraffin-embedded tissue sections; scale bar = 0.1 mm. D, Quantification of proliferative CD8+ T-cell fraction as the ratio of area that is double positive for CD8 and Ki67 staining (yellow) to the area that is positive for total CD8 staining (n = 4 mice per group, N = 4–5 image fields per mouse). E, Representative images of IF staining of CD31 (endothelial marker, red) and CD3 (green) in K7M2 frozen tissue sections; scale bar = 0.1 mm. F, Quantification of colocalization CD3+ T cells with CD31+ endothelial cells normalized to the total CD31-positive staining (n = 3 mice per group, N = 3–5 image fields per mouse). Data are presented as mean ± SE. For A, B, D, and F, statistical analyses were performed by comparing means between two independent groups using the ordinary one-way ANOVA test.
Figure 6.
Ketotifen pretreatment enhances the antitumor effects of immunotherapy by promoting T-cell recruitment and cytotoxic immune responses. A, Flow cytometry data. Percentage of the total CD3+ T cells among CD45+ lymphocytes in the whole tumor tissue of MCA205 tumor models treated as indicated. B, Flow cytometry data. Ratio of cytotoxic CD3+CD8+ T cells to CD3+CD4+CD25hiCD127loFoxp3+ Tregs (n = 5 mice per group). C, Representative images of IF staining of CD8 (green) and Ki67 (red) in K7M2 paraffin-embedded tissue sections; scale bar = 0.1 mm. D, Quantification of proliferative CD8+ T-cell fraction as the ratio of area that is double positive for CD8 and Ki67 staining (yellow) to the area that is positive for total CD8 staining (n = 4 mice per group, N = 4–5 image fields per mouse). E, Representative images of IF staining of CD31 (endothelial marker, red) and CD3 (green) in K7M2 frozen tissue sections; scale bar = 0.1 mm. F, Quantification of colocalization CD3+ T cells with CD31+ endothelial cells normalized to the total CD31-positive staining (n = 3 mice per group, N = 3–5 image fields per mouse). Data are presented as mean ± SE. For A, B, D, and F, statistical analyses were performed by comparing means between two independent groups using the ordinary one-way ANOVA test.

References

    1. Jenkins L, Jungwirth U, Avgustinova A, Iravani M, Mills A, Haider S, et al. . Cancer-associated fibroblasts suppress CD8 T-cell infiltration and confer resistance to immune-checkpoint blockade. Cancer Res 2022;16:2904–17. - PMC - PubMed
    1. Van der Leun AM, Thommen DS, Schumacher TN. CD8 T cell states in human cancer: insights from single-cell analysis. Nat Rev Cancer 2020;20:218–32. - PMC - PubMed
    1. Panagi M, Pilavaki P, Constantinidou A, Stylianopoulos T. Immunotherapy in soft tissue and bone sarcoma: unraveling the barriers to effectiveness. Theranostics 2022;12:6106–29. - PMC - PubMed
    1. Pilavaki P, Panagi M, Arifi S, Jones RL, Stylianopoulos T, Constantinidou A. Exploring the landscape of immunotherapy approaches in sarcomas. Front Oncol 2022;12:1069963. - PMC - PubMed
    1. Stubbs M, McSheehy PM, Griffiths JR, Bashford CL. Causes and consequences of tumour acidity and implications for treatment. Mol Med Today 2000;6:15–9. - PubMed

MeSH terms