

Photoprotection by photoinhibitory and PSII-reaction centre quenching controls growth of Ulva rigida (Chlorophyta) and is a pre-requisite for green tide formation
- PMID: 38578466
- PMCID: PMC10997536
- DOI: 10.1007/s00425-024-04389-z
Photoprotection by photoinhibitory and PSII-reaction centre quenching controls growth of Ulva rigida (Chlorophyta) and is a pre-requisite for green tide formation
Abstract
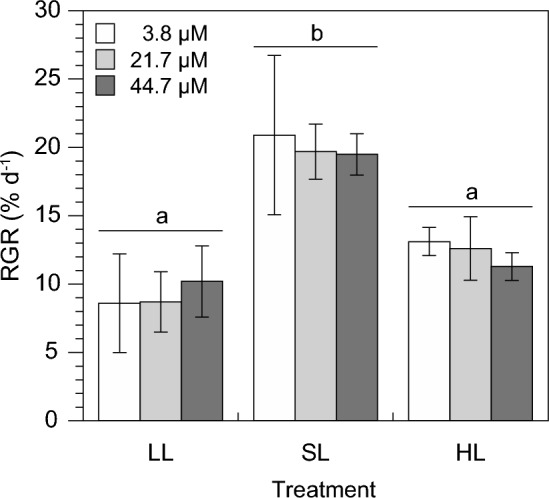
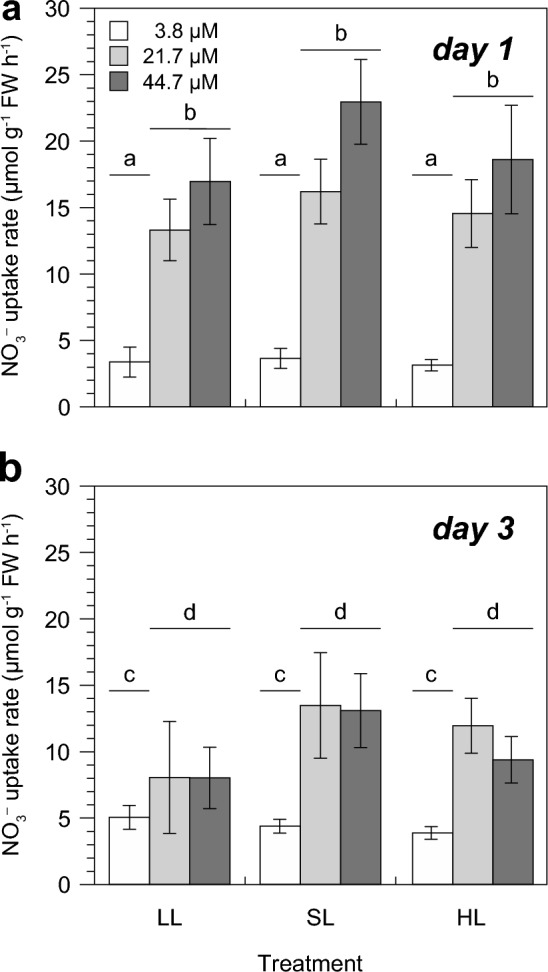
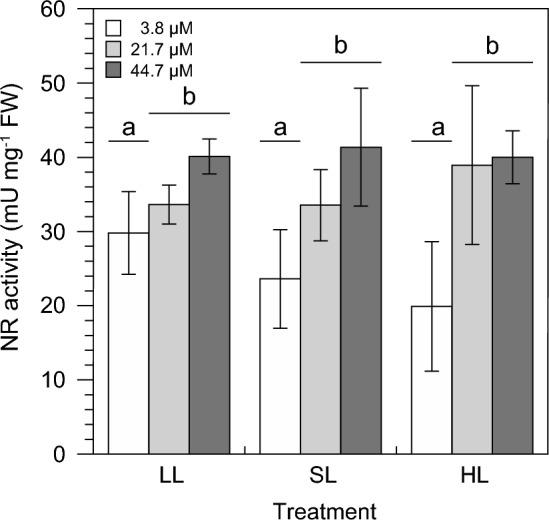
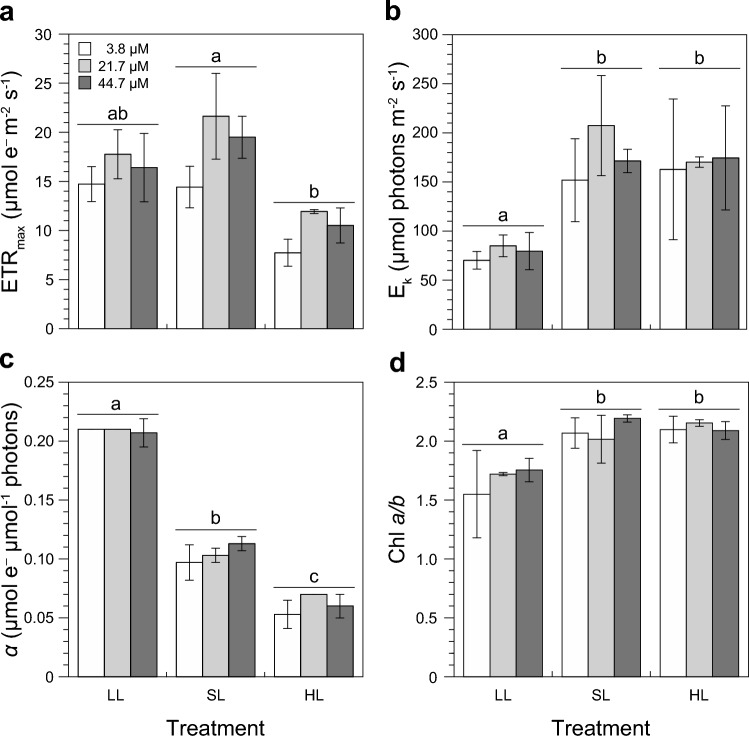
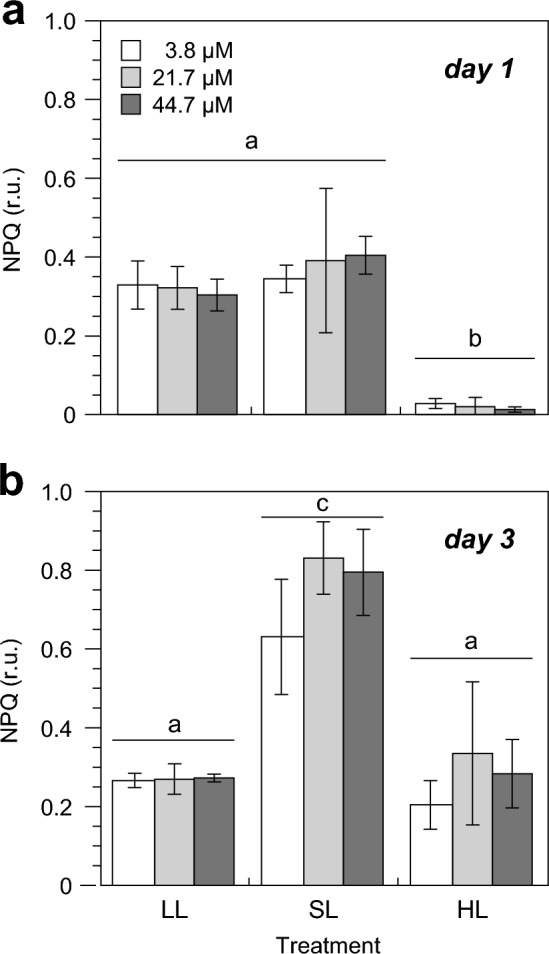
The combined photoinhibitory and PSII-reaction centre quenching against light stress is an important mechanism that allows the green macroalga Ulva rigida to proliferate and form green tides in coastal ecosystems. Eutrophication of coastal ecosystems often stimulates massive and uncontrolled growth of green macroalgae, causing serious ecological problems. These green tides are frequently exposed to light intensities that can reduce their growth via the production of reactive oxygen species (ROS). To understand the physiological and biochemical mechanisms leading to the formation and maintenance of green tides, the interaction between inorganic nitrogen (Ni) and light was studied. In a bi-factorial physiological experiment simulating eutrophication under different light levels, the bloom-forming green macroalga Ulva rigida was exposed to a combination of ecologically relevant nitrate concentrations (3.8-44.7 µM) and light intensities (50-1100 µmol photons m-2 s-1) over three days. Although artificial eutrophication (≥ 21.7 µM) stimulated nitrate reductase activity, which regulated both nitrate uptake and vacuolar storage by a feedback mechanism, nitrogen assimilation remained constant. Growth was solely controlled by the light intensity because U. rigida was Ni-replete under oligotrophic conditions (3.8 µM), which requires an effective photoprotective mechanism. Fast declining Fv/Fm and non-photochemical quenching (NPQ) under excess light indicate that the combined photoinhibitory and PSII-reaction centre quenching avoided ROS production effectively. Thus, these mechanisms seem to be key to maintaining high photosynthetic activities and growth rates without producing ROS. Nevertheless, these photoprotective mechanisms allowed U. rigida to thrive under the contrasting experimental conditions with high daily growth rates (12-20%). This study helps understand the physiological mechanisms facilitating the formation and persistence of ecologically problematic green tides in coastal areas.
Keywords: Ulva; Eutrophication; Macroalgal blooms; Nitrate reductase; Photoprotection; Photosynthesis.
© 2024. The Author(s).
Conflict of interest statement
The authors declare that they have no conflict of interest.
Figures

Similar articles
-
Seawater nitrogen concentration and light independently alter performance, growth, and resource allocation in the bloom-forming seaweeds Ulva lactuca and Ulvaria obscura (Chlorophyta).Harmful Algae. 2018 Sep;78:27-35. doi: 10.1016/j.hal.2018.07.005. Epub 2018 Jul 24. Harmful Algae. 2018. PMID: 30196922
-
Short-term effects of increased CO2, nitrate and temperature on photosynthetic activity in Ulva rigida (Chlorophyta) estimated by different pulse amplitude modulated fluorometers and oxygen evolution.J Exp Bot. 2021 Feb 2;72(2):491-509. doi: 10.1093/jxb/eraa473. J Exp Bot. 2021. PMID: 33064811
-
Future environmental scenarios favor the performance of Ulva lactuca - Implications for the intensification of green tides.Mar Environ Res. 2025 Sep;210:107262. doi: 10.1016/j.marenvres.2025.107262. Epub 2025 May 31. Mar Environ Res. 2025. PMID: 40494092
-
Harmful macroalgal blooms (HMBs) in China's coastal water: Green and golden tides.Harmful Algae. 2021 Jul;107:102061. doi: 10.1016/j.hal.2021.102061. Epub 2021 Jun 13. Harmful Algae. 2021. PMID: 34456020 Review.
-
[Analysis of the underlying mechanisms of green tide with a perspective of algae ecophysiology].Ying Yong Sheng Tai Xue Bao. 2022 May;33(5):1420-1428. doi: 10.13287/j.1001-9332.202205.028. Ying Yong Sheng Tai Xue Bao. 2022. PMID: 35730102 Review. Chinese.
Cited by
-
Photostasis and photosynthetic adaptation to polar life.Photosynth Res. 2024 Aug;161(1-2):51-64. doi: 10.1007/s11120-024-01104-7. Epub 2024 Jun 12. Photosynth Res. 2024. PMID: 38865029 Review.
-
A study on the growth and physiological traits of Leymus chinensis in artificial grasslands under exogenous hormone regulation.Sci Rep. 2025 Aug 17;15(1):30098. doi: 10.1038/s41598-025-14022-y. Sci Rep. 2025. PMID: 40820096 Free PMC article.
References
-
- Bartsch I, Wiencke C, Bischof K, Buchholz CM, Buck BH, Eggert A, Feuerpfeil P, Hanelt D, Jacobsen S, Karez R, Karsten U, Molis M, Roleda MY, Schubert H, Schumann R, Valentin K, Weinberger F, Wiese J. The genus Laminaria sensu lato: recent insights and developments. Eur J Phycol. 2008;43:1–86. doi: 10.1080/09670260701711376. - DOI
-
- Beer S, Larsson C, Poryan O, Axelsson L. Photosynthetic rates of Ulva (Chlorophyta) measured by pulse amplitude modulated (PAM) fluorometry. Eur J Phycol. 2000;35:69–74. doi: 10.1080/09670260010001735641. - DOI
-
- Berges J. Miniview: algal nitrate reductases. Eur J Phycol. 1997;32:3–8. doi: 10.1080/09541449710001719315. - DOI
MeSH terms
Substances
Supplementary concepts
Grants and funding
LinkOut - more resources
Full Text Sources
