Changes in Use of Hepatitis C Direct-Acting Antivirals After Access Restrictions Were Eased by State Medicaid Programs
- PMID: 38578628
- PMCID: PMC10998155
- DOI: 10.1001/jamahealthforum.2024.0302
Changes in Use of Hepatitis C Direct-Acting Antivirals After Access Restrictions Were Eased by State Medicaid Programs
Abstract
Importance: Direct-acting antivirals (DAAs) are safe and highly effective for curing hepatitis C virus (HCV) infection, but their high cost led certain state Medicaid programs to impose coverage restrictions. Since 2015, many of these restrictions have been lifted voluntarily in response to advocacy or because of litigation.
Objective: To estimate how the prescribing of DAAs to Medicaid patients changed after states eased access restrictions.
Design, setting, and participants: This modified difference-in-differences analysis of 39 state Medicaid programs included Medicaid beneficiaries who were prescribed a DAA from January 1, 2015, to December 31, 2019. DAA coverage restrictions were measured based on a series of cross-sectional assessments performed from 2014 through 2022 by the US National Viral Hepatitis Roundtable and the Center for Health Law and Policy Innovation.
Exposure: Calendar quarter when states eased or eliminated 3 types of DAA coverage restrictions: limiting treatment to patients with severe liver disease, restricting use among patients with active substance use, and requiring prescriptions to be written by or in consultation with specialists. States with none of these restrictions at baseline were excluded.
Main outcomes and measures: Quarterly number of HCV DAA treatment courses per 100 000 Medicaid beneficiaries.
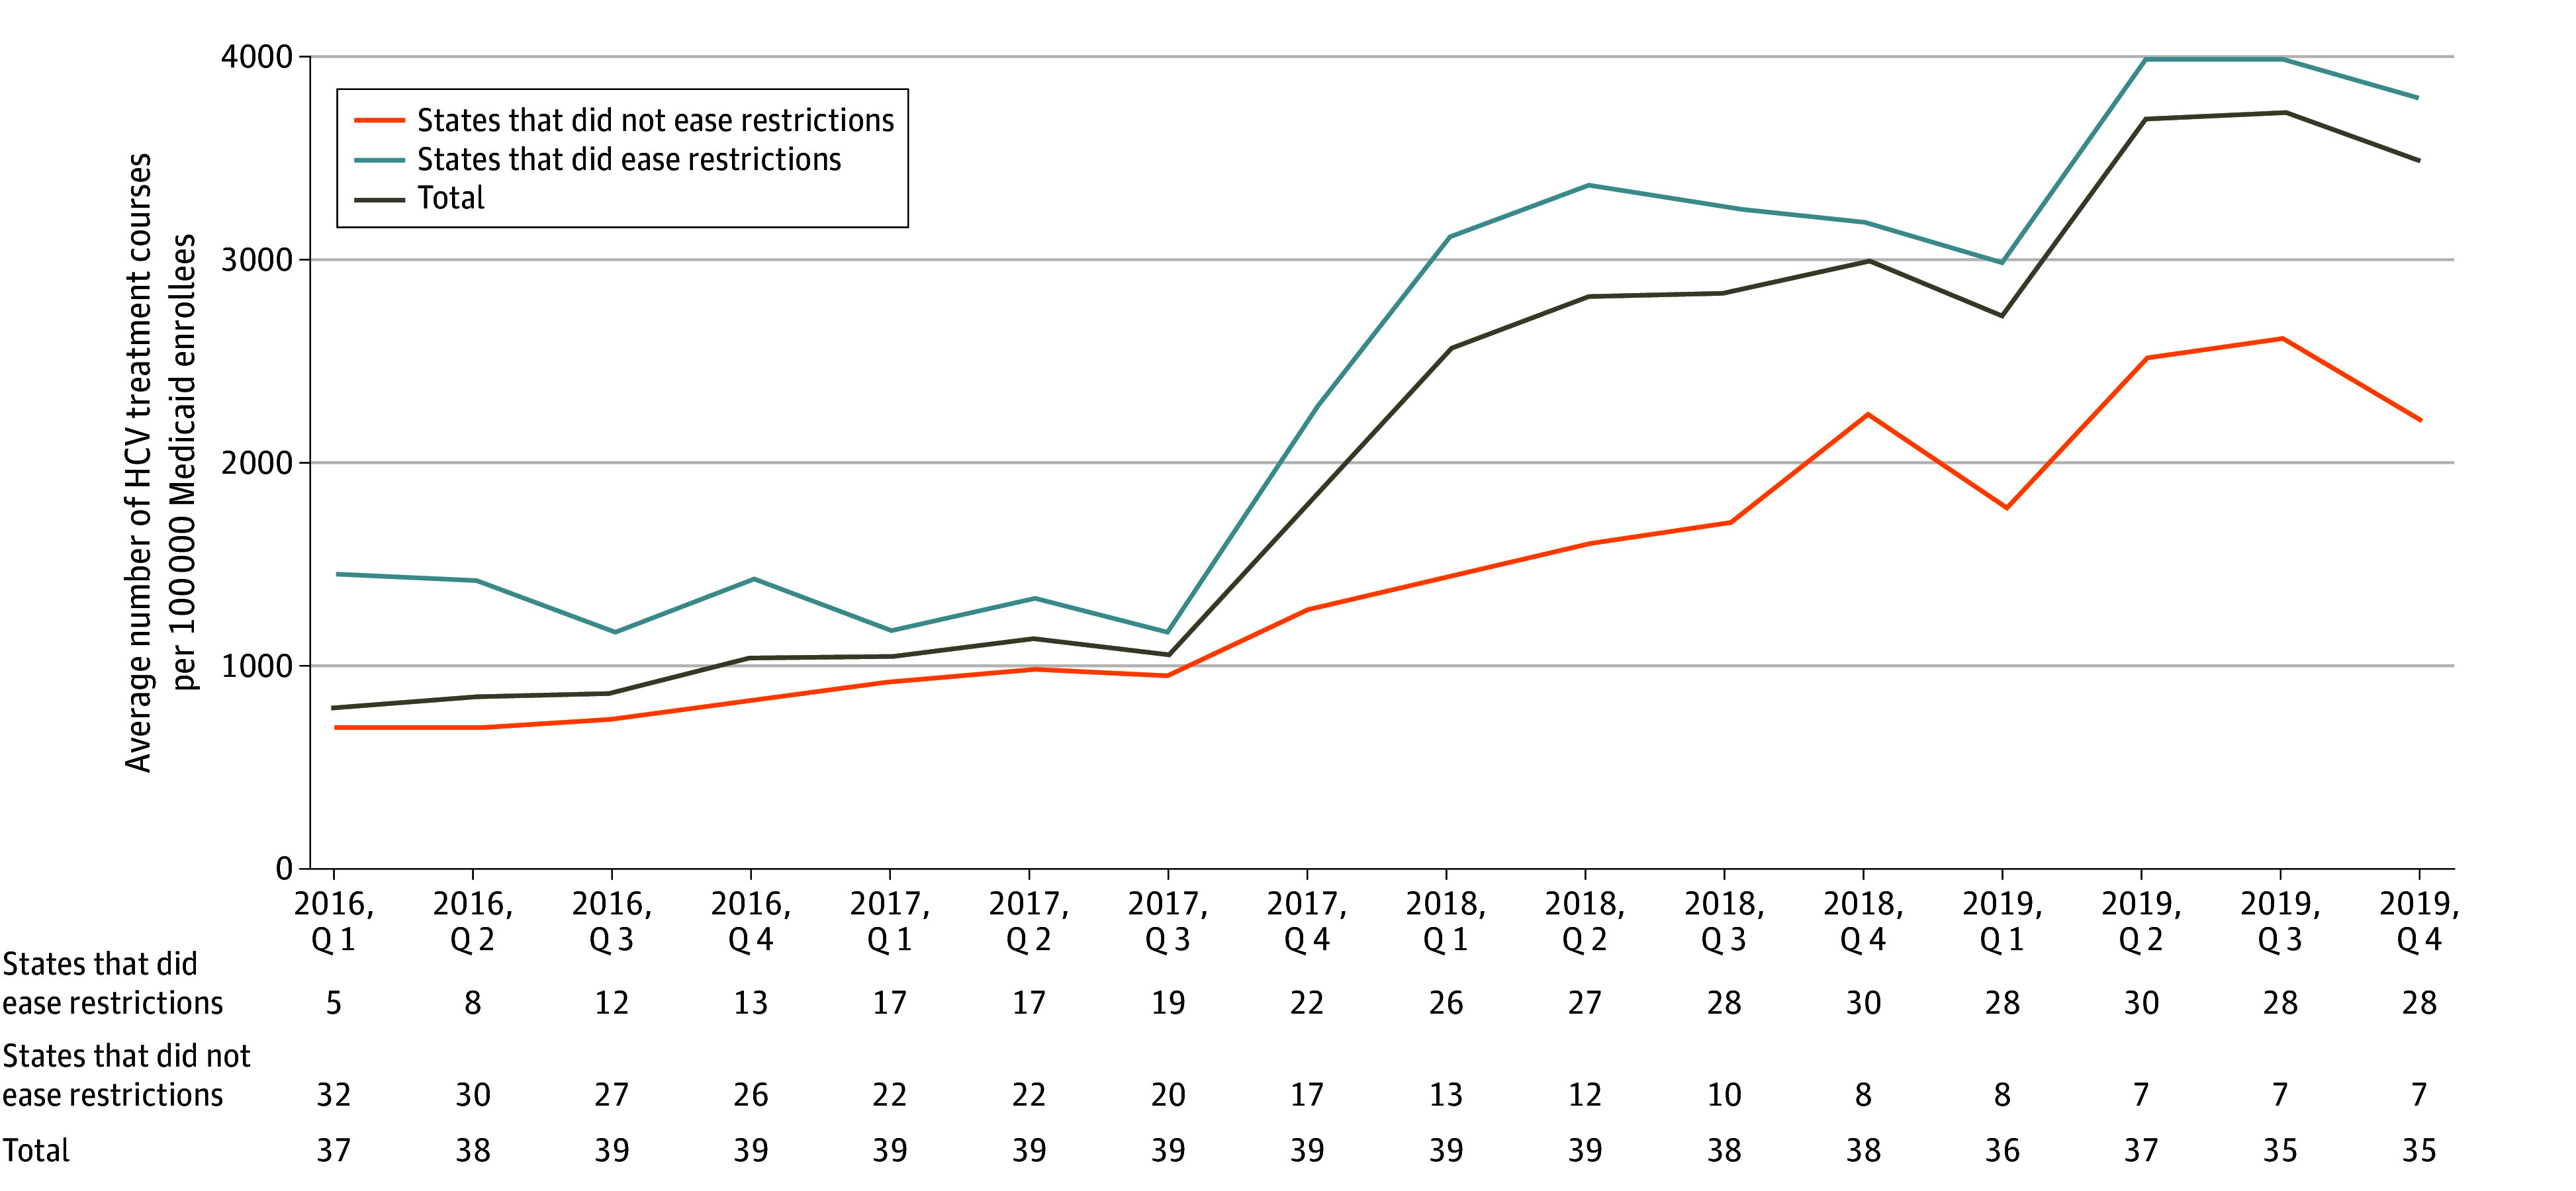
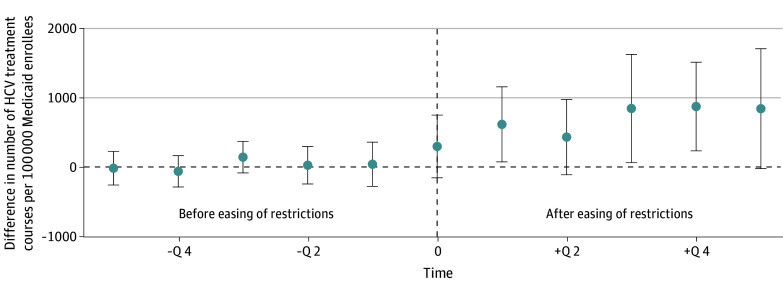
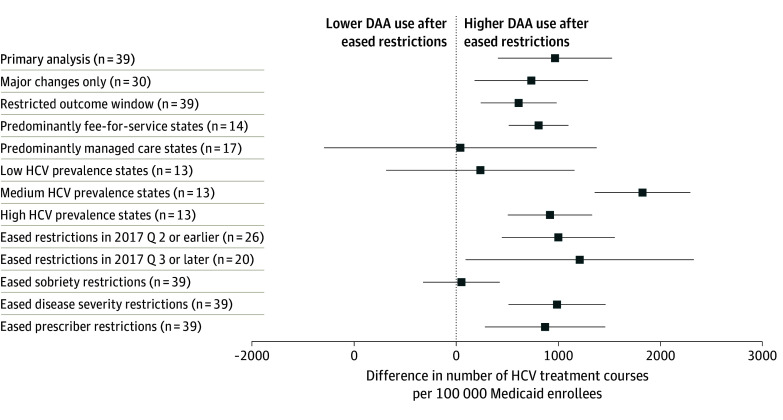
Results: Of 39 states, 7 (18%) eliminated coverage restrictions, 25 (64%) eased restrictions, and 7 (18%) maintained the same restrictions from 2015 to 2019. During this period, the average quarterly use of DAAs increased from 669 to 3601 treatment courses per 100 000 Medicaid beneficiaries. After states eased or eliminated restrictions, the use of DAAs increased by 966 (95% CI, 409-1523) treatment courses per 100 000 Medicaid beneficiaries each quarter compared with states that did not ease or eliminate restrictions.
Conclusions and relevance: The results of this study suggest that there was greater use of DAAs after states relaxed coverage restrictions related to liver disease severity, sobriety, or prescriber specialty. Further reductions or elimination of these rules may improve access to a highly effective public health intervention for patients with HCV.
Conflict of interest statement
Figures
Similar articles
-
Medicaid Expansion and Restriction Policies for Hepatitis C Treatment.JAMA Netw Open. 2024 Jul 1;7(7):e2422406. doi: 10.1001/jamanetworkopen.2024.22406. JAMA Netw Open. 2024. PMID: 39012632 Free PMC article.
-
Effect of relaxing hepatitis C treatment restrictions on direct-acting antiviral use in a Medicaid program: an interrupted time series analysis.J Manag Care Spec Pharm. 2021 Jul;27(7):856-864. doi: 10.18553/jmcp.2021.27.7.856. J Manag Care Spec Pharm. 2021. PMID: 34185560 Free PMC article.
-
Removal of medicaid restrictions were associated with increased hepatitis C virus treatment rates, but disparities persist.J Viral Hepat. 2022 May;29(5):366-374. doi: 10.1111/jvh.13661. Epub 2022 Mar 19. J Viral Hepat. 2022. PMID: 35254695 Free PMC article.
-
Hepatitis C Virus in Pregnancy: An Opportunity to Test and Treat.Obstet Gynecol Clin North Am. 2023 Jun;50(2):363-373. doi: 10.1016/j.ogc.2023.02.008. Obstet Gynecol Clin North Am. 2023. PMID: 37149316 Review.
-
Integrating Management of Hepatitis C Infection into Primary Care: the Key to Hepatitis C Elimination Efforts.J Gen Intern Med. 2022 Oct;37(13):3435-3443. doi: 10.1007/s11606-022-07628-9. Epub 2022 Apr 28. J Gen Intern Med. 2022. PMID: 35484367 Free PMC article. Review.
Cited by
-
Hepatitis C Screening in Emergency Departments: The DETECT Hep C Randomized Clinical Trial.JAMA. 2025 Aug 12;334(6):497-507. doi: 10.1001/jama.2025.10563. JAMA. 2025. PMID: 40632510 Clinical Trial.
-
Building a Low-Threshold Model for HCV Diagnosis and Treatment Among Formerly Incarcerated Patients in Alabama.J Gen Intern Med. 2025 Jul;40(10):2433-2437. doi: 10.1007/s11606-025-09411-y. Epub 2025 Feb 12. J Gen Intern Med. 2025. PMID: 39939496 Free PMC article.
-
Medicaid Expansion and Restriction Policies for Hepatitis C Treatment.JAMA Netw Open. 2024 Jul 1;7(7):e2422406. doi: 10.1001/jamanetworkopen.2024.22406. JAMA Netw Open. 2024. PMID: 39012632 Free PMC article.
-
Racial and Sociodemographic Disparities in Hepatitis C Treatment at an Urban Academic Medical Center, 2018-2023.Open Forum Infect Dis. 2025 Jun 13;12(6):ofaf312. doi: 10.1093/ofid/ofaf312. eCollection 2025 Jun. Open Forum Infect Dis. 2025. PMID: 40519633 Free PMC article.
-
The Impact of Biliary Injury on the Recurrence of Biliary Cancer and Benign Disease after Liver Transplantation: Risk Factors and Mechanisms.Cancers (Basel). 2024 Aug 7;16(16):2789. doi: 10.3390/cancers16162789. Cancers (Basel). 2024. PMID: 39199562 Free PMC article. Review.
References
-
- Centers for Disease Control and Prevention . Viral Hepatitis, 2017. Surveillance. Accessed July 3, 2023. https://www.cdc.gov/hepatitis/statistics/2017surveillance/index.htm.
-
- US Centers for Disease Control and Prevention . Increase in Hepatitis C infections linked to worsening opioid crisis, 2017. Accessed July 3, 2023. https://www.cdc.gov/nchhstp/newsroom/2017/hepatitis-c-and-opioid-injecti...
MeSH terms
Substances
LinkOut - more resources
Full Text Sources
Medical