. 2024 Apr 5:12:RP91729.
doi: 10.7554/eLife.91729.

Single-cell 'omic profiles of human aortic endothelial cells in vitro and human atherosclerotic lesions ex vivo reveal heterogeneity of endothelial subtype and response to activating perturbations

Affiliations

Single-cell 'omic profiles of human aortic endothelial cells in vitro and human atherosclerotic lesions ex vivo reveal heterogeneity of endothelial subtype and response to activating perturbations

Maria L Adelus et al. Elife. .

Abstract

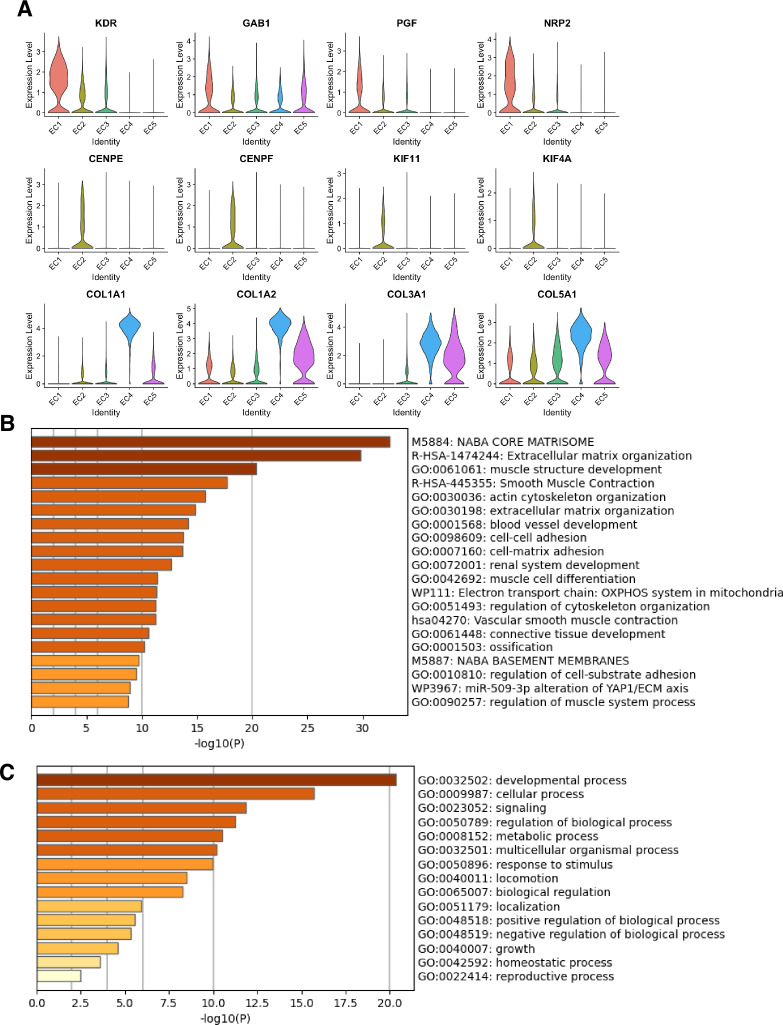
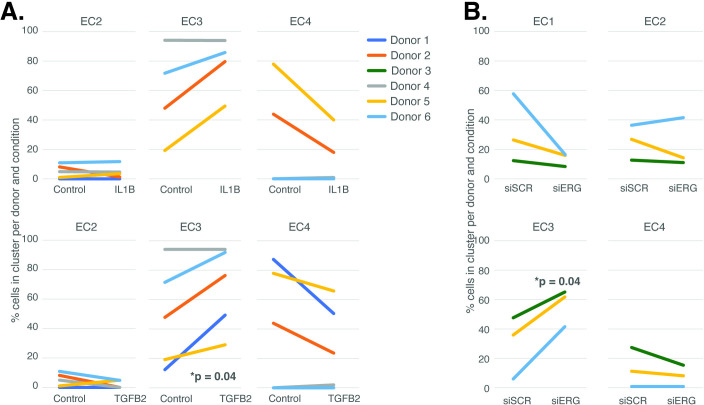
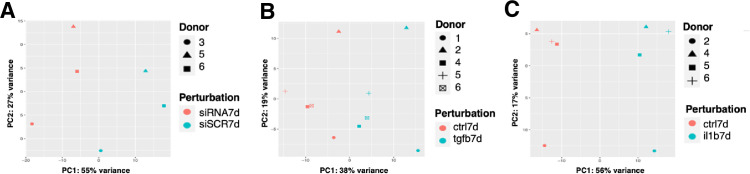
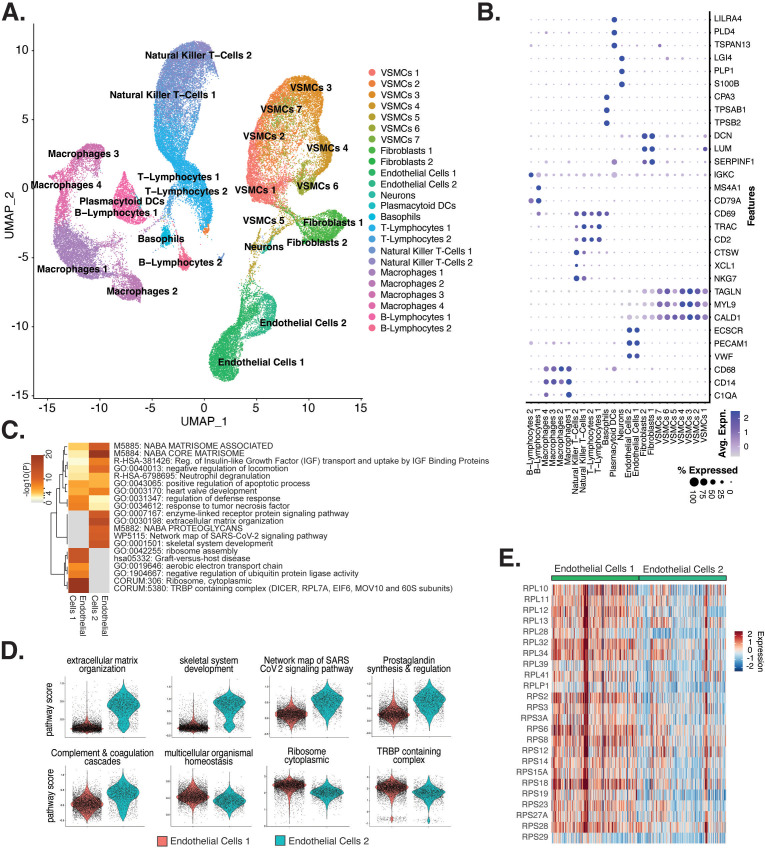
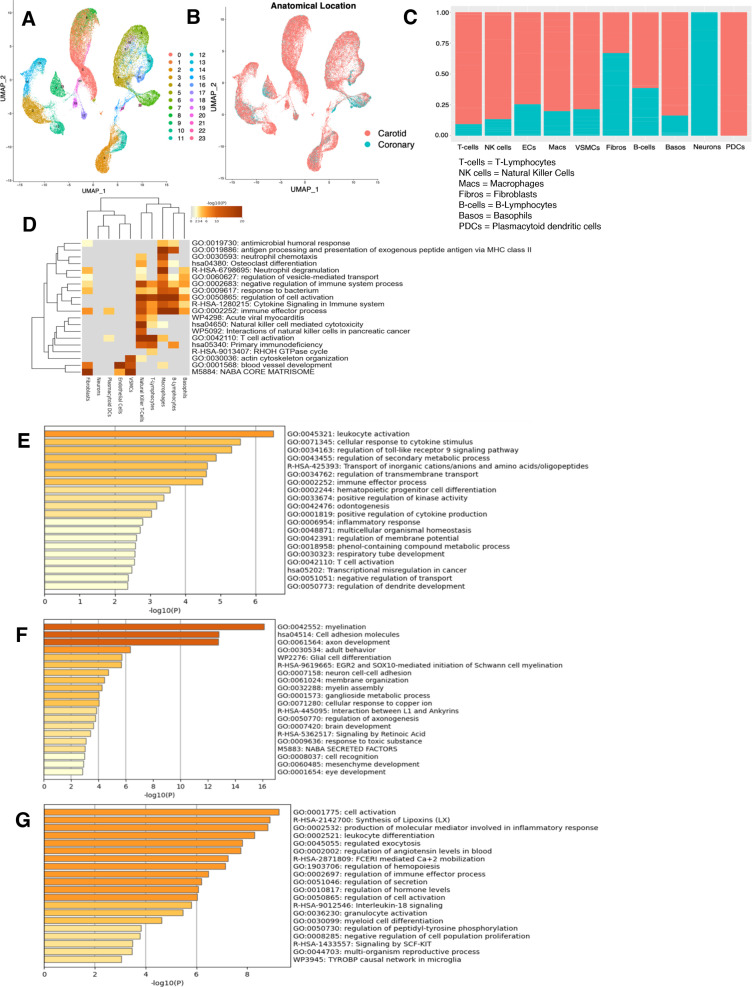
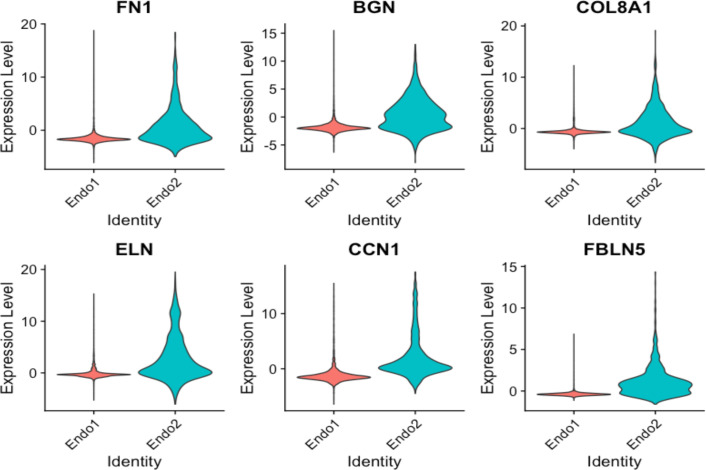
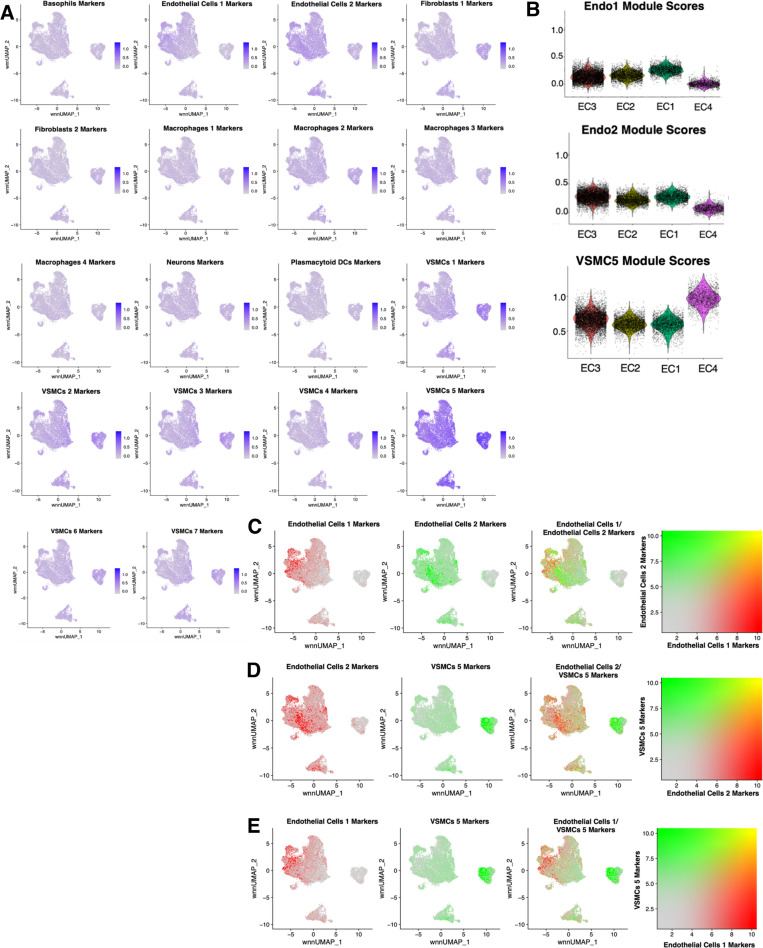
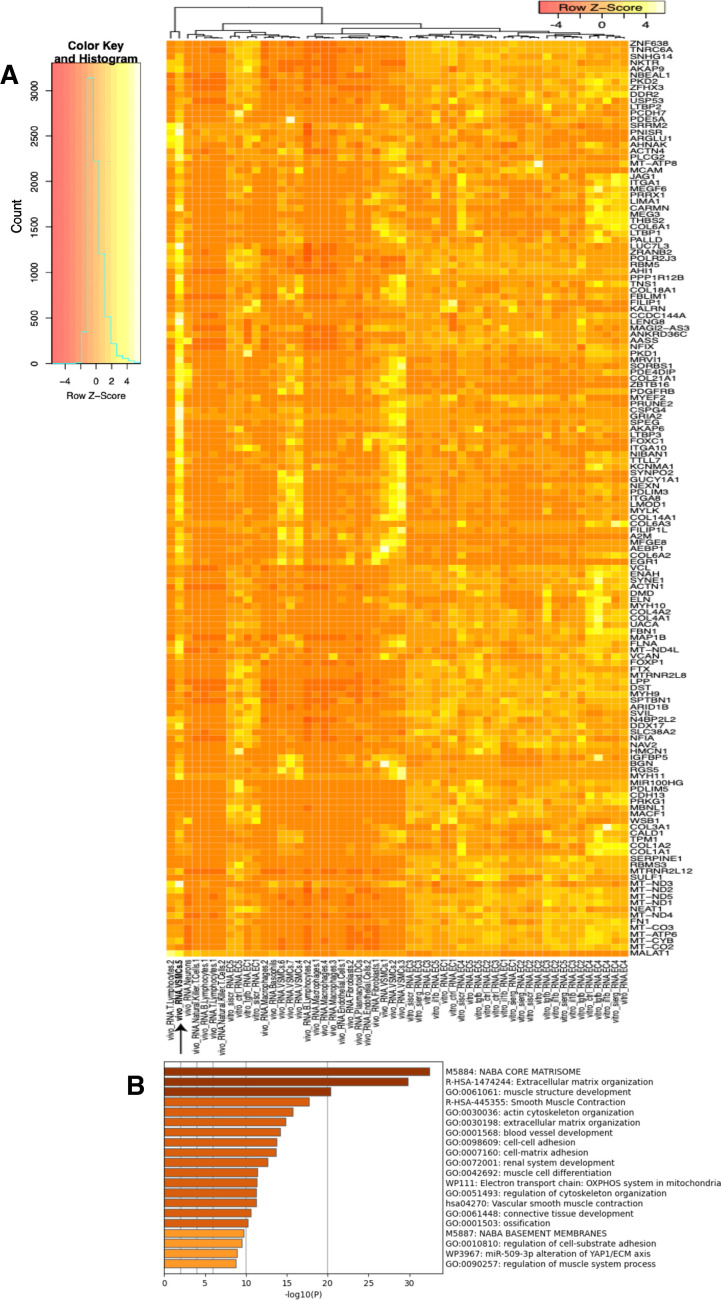
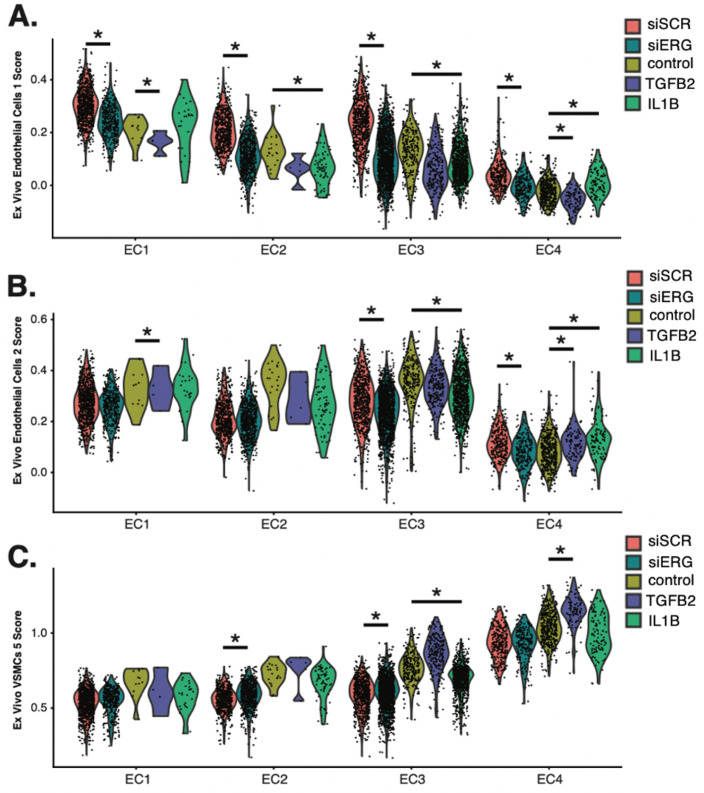
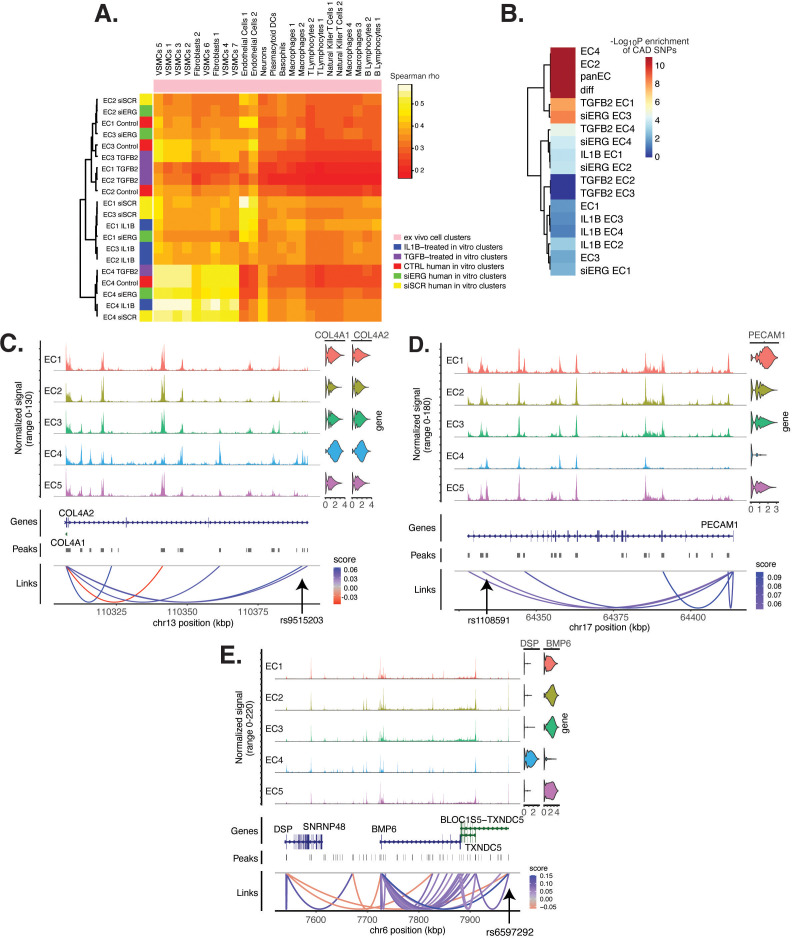
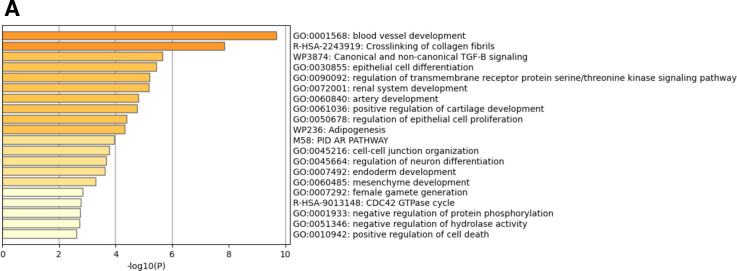
Heterogeneity in endothelial cell (EC) sub-phenotypes is becoming increasingly appreciated in atherosclerosis progression. Still, studies quantifying EC heterogeneity across whole transcriptomes and epigenomes in both in vitro and in vivo models are lacking. Multiomic profiling concurrently measuring transcriptomes and accessible chromatin in the same single cells was performed on six distinct primary cultures of human aortic ECs (HAECs) exposed to activating environments characteristic of the atherosclerotic microenvironment in vitro. Meta-analysis of single-cell transcriptomes across 17 human ex vivo arterial specimens was performed and two computational approaches quantitatively evaluated the similarity in molecular profiles between heterogeneous in vitro and ex vivo cell profiles. HAEC cultures were reproducibly populated by four major clusters with distinct pathway enrichment profiles and modest heterogeneous responses: EC1-angiogenic, EC2-proliferative, EC3-activated/mesenchymal-like, and EC4-mesenchymal. Quantitative comparisons between in vitro and ex vivo transcriptomes confirmed EC1 and EC2 as most canonically EC-like, and EC4 as most mesenchymal with minimal effects elicited by siERG and IL1B. Lastly, accessible chromatin regions unique to EC2 and EC4 were most enriched for coronary artery disease (CAD)-associated single-nucleotide polymorphisms from Genome Wide Association Studies (GWAS), suggesting that these cell phenotypes harbor CAD-modulating mechanisms. Primary EC cultures contain markedly heterogeneous cell subtypes defined by their molecular profiles. Surprisingly, the perturbations used here only modestly shifted cells between subpopulations, suggesting relatively stable molecular phenotypes in culture. Identifying consistently heterogeneous EC subpopulations between in vitro and ex vivo models should pave the way for improving in vitro systems while enabling the mechanisms governing heterogeneous cell state decisions.

Keywords: ERG; atherosclerosis; chromosomes; endothelial cells; epigenetics; gene expression; genetics; genomics; human; inflammation; vascular biology.


Conflict of interest statement

MA, JD, BT, AC, AG, LS, MW, DC, CR No competing interests declared

Figures

Figure 1.
Figure 1.. Human aortic endothelial cell (HAEC) transcriptomic profiling discover a heterogeneous cell population.
(A) Schematic diagram of the experimental design. Endothelial cells (ECs) were isolated from six human heart transplant donor’s ascending aortic trimmings and treated with IL1B, TGFB2, or siERG (ERG siRNA) for 7 d. (B) Weighted nearest-neighbor UMAP (WNNUMAP) of aggregate cells from all perturbations and donors is shown. Each dot represents a cell, and the proximity between each cell approximates their similarity of both transcriptional and epigenetic profiles. Colors denote cluster membership. (C) The proportion of cells from each donor for each EC subtype. (D) Gene expression across top markers for each cluster including pan EC (ERG), EC1 (KDR), EC2 (TOP2A), and EC4 (COL1A1). (E) Top markers for pan EC (PECAM1, CDH5, ERG), EC1 (KDR, PGF), EC2 (CENPE, TOP2A), EC3 (SEMA3C, ACKR3), EC4 (COL1A1, COL6A1), and EC5 (LRRC17, LAMA2). The size of the dot represents the percentage of cells within each EC subtype that express the given gene, while the shade of the dot represents the level of average expression (‘Avg. Expn.’ in the legend). (F) Heatmap of pathway enrichment analysis (PEA) results from submitting top 200 differentially expressed genes (DEGs; by ascending p-value) between EC subtypes. Rows (pathways) and columns (EC subtypes) are clustered based on -Log10(P). (G) Violin plots of top Metascape pathway module scores across EC subtypes. Module scores are generated for each cell barcode with the Seurat function AddModuleScore().
Figure 1—figure supplement 1.
Figure 1—figure supplement 1.. Marker genes and pathways for endothelial clusters.
(A) Violin plots of representative marker genes for angiogenic EC1 (KDR, GAB1, PGF, NRP1), proliferative EC2 (CENPE, CENPF, KIF11, KIF4A), and mesenchymal EC4 (COL1A1, COL1A2, COL3A1, COL5A1) sub-phenotypes. (B) Top 20 pathway enrichment analysis (PEA) results from submitting top 200 differentially expressed genes (DEGs; by ascending p-value) regulated in EC3 versus EC1-2 and EC4-5. (C) Top 20 Gene Ontology (GO) PEA results from submitting top 200 DEGs (by ascending p-value) regulated in EC3 versus EC1-2 and EC4-5.
Figure 1—figure supplement 2.
Figure 1—figure supplement 2.. Violin plot of XIST showing expected expression in female in vitro donor cells (1 and 3) and lack of expression in male in vitro donor cells (2, 4, 5, and 6).
Figure 2.
Figure 2.. Endothelial cells (ECs) have epigenetically distinct cell states.
(A) Upset plot of differential peaks across EC subtypes. Intersection size represents the number of genes at each intersection, while set size represents the number of genes for each EC subtype. (B) Genomic annotation for the complete peak set. (C) Heatmap of top transcription factors (TFs) from motif enrichment analysis for marker peaks in each EC subtype. Top TFs for each EC subtype are selected based on ascending p-value. Rows (TFs) and columns (EC subtype) are clustered based on enrichment score (ES). (D) Feature plots and position weight matrices (PWMs) for top TF binding motifs for EC1 (TCF12), EC2 (ETV1), EC3 (GATA5), and EC4 (TEAD3). Per-cell motif activity scores are computed with chromVAR, and motif activities per cell are visualized using the Signac function FeaturePlot. (E), PWMs comparing Jaspar 2020 ETV1 motif to ERG motif reported in Hogan et al.
Figure 3.
Figure 3.. Endothelial cell (EC)-activating perturbations modestly shift cells into the EC3 subtype.
(A) The proportion of cells in 7-day control and 7-day IL1B treatment are shown per human aortic endothelial cell (HAEC) donor and cluster on the top and for 7-day control and 7-day TGFB2 on the bottom. (B) The proportion of cells in 7-day siSCR control and 7-day siERG knockdown are shown per HAEC donor and cluster. EC1 was omitted in (A) due to lack of cells in both conditions.
Figure 3—figure supplement 1.
Figure 3—figure supplement 1.. Principal component analysis using RNA-seq data.
(A) Principal component analysis (PCA) of EC1-4 snRNA-seq samples +/-siERG or control across donor replicates. (B) PCA of EC1-4 snRNA-seq samples +/-TGFB2 or control across donor replicates. (C) PCA of EC1-4 snRNA-seq samples +/-IL1B or control across donor replicates.
Figure 3—figure supplement 2.
Figure 3—figure supplement 2.. Receptor expression profiles across endothelial clusters.
(A) Feature plots of expression of TGFB pathway receptors: TGFBR1, TGFBR2, and ACVRL1. (B) Feature plots of IL1B pathway receptors: IL1R1, IL1R2, IL1RL1, and IL1RL2.
Figure 3—figure supplement 3.
Figure 3—figure supplement 3.. Validation of ERG knockdown.
(A) qPCR results for ERG knockdown across donors. (B) Western blot representing a typical knockdown of siERG with the siRNA pools used in this study. TCF4 samples are irrelevant for the purpose of this study.
Figure 4.
Figure 4.. Endothelial cell (EC)-activating perturbations in vitro elicit EC subtype-specific transcriptional responses.
(A) Upset plots of up- and downregulated differentially expressed genes (DEGs) across EC subtypes with siERG (gray), IL1B (pink), and TGFB2 (blue). Upset plots visualize intersections between sets in a matrix, where the columns of the matrix correspond to the sets, and the rows correspond to the intersections. Intersection size represents the number of genes at each intersection. (B) Pathway enrichment analysis (PEA) for EC3-4 up- and downregulated DEGs with TGFB2 compared to control media. (C) PEA for EC2-4 up- and downregulated DEGs with IL1B compared to control media. (D) PEA for EC1-4 up- and downregulated DEGs with siERG compared to siSCR. (E) PEA comparing up- and downregulated DEGs that are mutually exclusive and shared between IL1B and siERG in EC3.
Figure 4—figure supplement 1.
Figure 4—figure supplement 1.. Profiles of shared peaks and motif enrichments across endothelial subtypes.
(A) Upset plot of induced peaks for siERG (gray), IL1B (pink), and TGFB2 (blue) across EC1, EC2, EC3, and EC4. Upset plots visualize intersections between sets in a matrix, where the columns of the matrix correspond to the sets, and the rows correspond to the intersections. Intersection size represents the number of genes at each intersection. (B) Heatmap of top motifs enriched in IL1B-induced peaks. Top transcription factors (TFs) for each EC subtype are selected based on ascending p-value. Rows (TFs) and columns (EC subtype) are clustered based on enrichment score (ES). (C) Heatmap of top motifs enriched in siERG-induced peaks. (D), Heatmap of top motifs enriched in TGFB2-induced peaks.
Figure 5.
Figure 5.. Endothelial cells (ECs) from ex vivo human atherosclerotic plaques show two major populations.
(A) scRNA-seq UMAP of different cell subtypes across 17 samples of ex vivo human atherosclerotic plaques. (B) Dot plot of top markers for each cell type. (C) Heatmap of pathway enrichment analysis (PEA) results generated from submitting 200 differentially expressed genes (DEGs) between endothelial cells 1 (Endo1) and endothelial cells 2 (Endo2). Rows (pathways) and columns (cell subtypes) are clustered based on -Log10(P). (E) Heatmap displaying expression of genes belonging to ribosome cytoplasmic pathway for Endo1 and Endo2.
Figure 5—figure supplement 1.
Figure 5—figure supplement 1.. Characterization of RNA-seq profiles from ex vivo arterial samples.
(A) UMAP displaying original clusters formed from scRNA-seq data taken from 17 samples across four studies of human ex vivo atherosclerotic plaques. Colors denote different clusters. (B) UMAP from (A). Colors denote anatomical location from which cells derived. (C) Stacked bar graph showing the distribution of anatomic location (red denoting carotid, blue denoting coronary arteries) from which cells derived. (D) Heatmap of pathway enrichment analysis (PEA) results from submitting top 100 differentially expressed genes (DEGs) (by ascending p-value) between ex vivo cell types. Rows (pathways) and columns (cell subtypes) are clustered based on -Log10(P). (E) PEA of the top 100 DEGs (by ascending p-value) for plasmacytoid dendritic cells (PDCs). (F) PEA of the top 100 DEGs (by ascending p-value) for neurons. (G) PEA of the top 100 DEGs (by ascending p-value) for basophils. Adjusted p-value<0.05 for DEGs submitted in (D–G).
Figure 5—figure supplement 2.
Figure 5—figure supplement 2.. Violin plots displaying upregulation of several EndMT markers in Endo2, compared to Endo1, including FN1, BGN, COL8A1, ELN, CCN1, FBLN5.
Figure 5—figure supplement 3.
Figure 5—figure supplement 3.. Cross comparisons between in vitro and ex vivo RNA-based module scores.
(A) Feature plots for each ex vivo module score across in vitro cells. Briefly, ex vivo module scores are generated using top marker genes for each ex vivo cell subtype. The Seurat function AddModuleScore is used to score each cell for visualization. (B) Violin plots displaying endothelial cells 1 (Endo1), endothelial cells 2 (Endo2), and vascular smooth muscle cell 5 (VSMC5) module scores for each perturbation across in vitro EC1–4. (C) Feature plots displaying distribution of Endo1 (red) versus Endo2 (green) module scores across in vitro cells. (D) Feature plots displaying distribution of Endo1 (red) versus VSMC5 (green) module scores across in vitro cells. (E) Feature plots displaying distribution of Endo2 (red) versus VSMC5 (green) modules scores across in vitro cells.
Figure 5—figure supplement 4.
Figure 5—figure supplement 4.. Heatmap and pathway analysis for marker genes of the VSMC5 ex vivo cluster.
(A) Heatmap displaying average expression of VSMC5 maker genes (black arrow) across in vitro and ex vivo datasets. Rows (genes) and columns (cell subtypes) are clustered based on average expression for each given gene. (B) Pathway enrichment analysis (PEA) of the top 200 genes for VSMC5 (adjusted p-value<0.05).
Figure 5—figure supplement 5.
Figure 5—figure supplement 5.. Breakdown of ex vivo module scores across in vitro clusters and sample identity.
(A) Violin plots of ex vivo Endo1 module scores across EC1–4. (B), Violin plots of ex vivo Endo2 module scores across EC1–4. (C) Violin plots of ex vivo VSMC5 module scores across EC1–4. Adjusted p-value for (A–C) generated using Wilcoxon rank sum test with continuity correction by setting the alternative hypothesis to ‘two.sided’.
Figure 6.
Figure 6.. Endothelial cell (EC) subtype is a major determinant in the ability to recapitulate ‘omic profiles seen in atherosclerosis.
(A) Heatmap displaying average expression between in vitro perturbation-subtype combinations and ex vivo cell subtypes using all up- and downregulated genes between IL1B, TGFB2, or siERG versus respective controls. Spearman correlation was used as the distance metric. Rows (in vitro EC subtypes) and columns (ex vivo cell subtypes) are clustered using all significant genes (adjusted p-value<0.05) induced and attenuated across all in vitro EC subtypes for each perturbation versus its respective control. (B) Heatmap of coronary artery disease (CAD)-associated single-nucleotide polymorphism (SNP) enrichments across in vitro EC subtypes and perturbation–subtype combinations. Rows (EC subtypes and perturbation-subtype combinations) are clustered using -Log10(P) for enrichment in significant CAD-associated SNPs (p-value<5 × 10⁻⁸). Note that ‘diff’ represents peaks common to more than one EC subtype; it is found by subtracting EC1–5 subtype-specific peaks from the entire in vitro peak set (termed ‘panEC’). (C) Coverage plots displaying links for COL4A1/COL4A2 genes to EC4-specific peaks, including one overlapping with CAD-associated SNP rs9515203. (D) Coverage plot showing links for PECAM1 gene to EC4-specific peaks, including one overlapping with CAD-associated SNP rs1108591. (E) Coverage plot showing links for BMP6 gene to EC4-specific peaks, including one overlapping with CAD-associated SNP rs6597292.
Figure 6—figure supplement 1.
Figure 6—figure supplement 1.. Pathway enrichment analysis (PEA) of significant (p-value<0.05) EC4-linked genes that overlap with significant (p-value<10–8) coronary artery disease (CAD)-associated single-nucleotide polymorphism (SNP).

Update of

References

    1. 1000 Genomes Project Consortium. Auton A, Brooks LD, Durbin RM, Garrison EP, Kang HM, Korbel JO, Marchini JL, McCarthy S, McVean GA, Abecasis GR. A global reference for human genetic variation. Nature. 2015;526:68–74. doi: 10.1038/nature15393. - DOI - PMC - PubMed
    1. Alsaigh T, Evans D, Frankel D, Torkamani A. Decoding the transcriptome of calcified atherosclerotic plaque at single-cell resolution. Communications Biology. 2022;5:1084. doi: 10.1038/s42003-022-04056-7. - DOI - PMC - PubMed
    1. Andueza A, Kumar S, Kim J, Kang D-W, Mumme HL, Perez JI, Villa-Roel N, Jo H. Endothelial reprogramming by disturbed flow revealed by Single-Cell RNA and chromatin accessibility study. Cell Reports. 2020;33:108491. doi: 10.1016/j.celrep.2020.108491. - DOI - PMC - PubMed
    1. Aragam KG, Jiang T, Goel A, Kanoni S, Wolford BN, Atri DS, Weeks EM, Wang M, Hindy G, Zhou W, Grace C, Roselli C, Marston NA, Kamanu FK, Surakka I, Venegas LM, Sherliker P, Koyama S, Ishigaki K, Åsvold BO, Brown MR, Brumpton B, de Vries PS, Giannakopoulou O, Giardoglou P, Gudbjartsson DF, Güldener U, Haider SMI, Helgadottir A, Ibrahim M, Kastrati A, Kessler T, Kyriakou T, Konopka T, Li L, Ma L, Meitinger T, Mucha S, Munz M, Murgia F, Nielsen JB, Nöthen MM, Pang S, Reinberger T, Schnitzler G, Smedley D, Thorleifsson G, von Scheidt M, Ulirsch JC, Biobank Japan. EPIC-CVD. Arnar DO, Burtt NP, Costanzo MC, Flannick J, Ito K, Jang D-K, Kamatani Y, Khera AV, Komuro I, Kullo IJ, Lotta LA, Nelson CP, Roberts R, Thorgeirsson G, Thorsteinsdottir U, Webb TR, Baras A, Björkegren JLM, Boerwinkle E, Dedoussis G, Holm H, Hveem K, Melander O, Morrison AC, Orho-Melander M, Rallidis LS, Ruusalepp A, Sabatine MS, Stefansson K, Zalloua P, Ellinor PT, Farrall M, Danesh J, Ruff CT, Finucane HK, Hopewell JC, Clarke R, Gupta RM, Erdmann J, Samani NJ, Schunkert H, Watkins H, Willer CJ, Deloukas P, Kathiresan S, Butterworth AS, CARDIoGRAMplusC4D Consortium Discovery and systematic characterization of risk variants and genes for coronary artery disease in over a million participants. Nature Genetics. 2022;54:1803–1815. doi: 10.1038/s41588-022-01233-6. - DOI - PMC - PubMed
    1. Benjamini Y, Hochberg Y. Controlling the false discovery rate: a practical and powerful approach to multiple testing. Journal of the Royal Statistical Society. 1995;57:289–300. doi: 10.1111/j.2517-6161.1995.tb02031.x. - DOI

MeSH terms

Associated data