. 2024 Apr 5;20(4):e1011231.
doi: 10.1371/journal.pgen.1011231. eCollection 2024 Apr.

Belt and braces: Two escape ways to maintain the cassette reservoir of large chromosomal integrons

Affiliations

Belt and braces: Two escape ways to maintain the cassette reservoir of large chromosomal integrons

Egill Richard et al. PLoS Genet. .

Abstract

Integrons are adaptive devices that capture, stockpile, shuffle and express gene cassettes thereby sampling combinatorial phenotypic diversity. Some integrons called sedentary chromosomal integrons (SCIs) can be massive structures containing hundreds of cassettes. Since most of these cassettes are non-expressed, it is not clear how they remain stable over long evolutionary timescales. Recently, it was found that the experimental inversion of the SCI of Vibrio cholerae led to a dramatic increase of the cassette excision rate associated with a fitness defect. Here, we question the evolutionary sustainability of this apparently counter selected genetic context. Through experimental evolution, we find that the integrase is rapidly inactivated and that the inverted SCI can recover its original orientation by homologous recombination between two insertion sequences (ISs) present in the array. These two outcomes of SCI inversion restore the normal growth and prevent the loss of cassettes, enabling SCIs to retain their roles as reservoirs of functions. These results illustrate a nice interplay between gene orientation, genome rearrangement, bacterial fitness and demonstrate how integrons can benefit from their embedded ISs.


Conflict of interest statement

The authors have declared that no competing interests exist.

Figures

Fig 1
Fig 1. The integron system and the importance of its orientation towards replication.
a. Schematic representation of the integron. The stable platform consists of a gene encoding the integrase (intI, in yellow) and its Pint promoter, the cassette insertion site attI (in red) and the cassette promoter PC driving the expression of the downstream cassettes along an expression gradient. The cassettes are represented by arrows whose heads represent the attC site. Their color intensity represents their level of expression from dark blue (highly expressed) to light blue (not expressed). Cassettes can be excised through an attC × attC intramolecular reaction and be reintegrated in 1st position of the integron array (near the PC promoter) through an attC × attI intermolecular reaction. Then, cassettes become expressed. b. Mechanistic insight on the issue of integron orientation. Array of cassettes are represented while they are replicated. Their orientation towards the replication fork is indicated by the direction of the arrowhead representing the cassette. In their conserved orientation, SCI recombinogenic bottom strands of attC sites (attCbs) are carried by the continuously replicated leading strand template which supposedly limits their structuration. The non-recombinogenic top strands of attC sites (attCts) are carried by the lagging strand template containing stretches of ssDNA (between the Okazaki fragments, dotted lines) which supposedly favors their structuration. In the inverted orientation, recombinogenic attCbs are carried by the lagging strand template. A more frequent structuration of these attC strands is expected to lead to increased binding of the integrase and higher cassette excision rate.
Fig 2
Fig 2. Experimental evolution of the SCI Inverted and Reinverted strains expressing integrase.
a. Schematic overview of the evolutionary experiment. D0, D1, … stands for Day 0, Day 1, and so forth. After each day of growth (corresponding to 10 generations: 10 g), cultures were plated. 24 and 8 clones were collected for respectively SCI Inv and Reinv strains both expressing integrase (N = 24 and N = 8). Created with BioRender.com. b. Growth curves of the SCI Inv (orange lines) and SCI Reinv (blue lines) collected clones expressing integrase during the evolution experiment. For each curve, the line corresponds to the mean of the growth of the collected clones, and the shade corresponds to the standard errors at each timepoint. c. Distribution of the relative growth rates of the 24 collected clones at each time point of the evolution experiment. The growth rates of each SCI Inv clone for each day are represented as relative values compared to the mean growth rate of the SCI Reinv on the corresponding days. A violin plot is also represented to help visualize the bimodal distributions of the intermediate time points, as well as the median (full line) and quartiles (dotted lines) of those distributions.
Fig 3
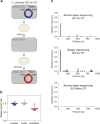
Fig 3. Analysis of the mutation pattern in the Vibrio cholerae integron integrase gene.
a. Schematic overview of the plasmid curing and retransformation (retransfo.) The inducible PBAD promoter, the araC repressor and the intIA integrase genes are respectively represented by black, white and yellow arrows. Created with BioRender.com. b. Distribution of the growth rates of the 24 clones before plasmid curing (Evolved), after plasmid curing (Cured) and after retransformation (Retransfo.) of the pSC101::intIA. The growth rates are represented as relative values compared to the mean growth rate of the 24 SCI Inv clones evolved from D7. c. Pattern of mutation of the intIA gene carried by the pSC101 vector. The x-axis is the nucleotide position relative to the adenine of the ATG start codon and the y-axis represents the mutation frequency. Each bar represents every type of variants (SNV: Single nucleotide variant; MNV: Multi-nucleotide variant; indel: insertion-deletion). The top panel shows results obtained with Illumina deep sequencing approach using the SCI Inv evolved D7 strain (with integrase). The middle panel shows results obtained with Sanger sequencing approach using the SCI Inv evolved D7 strain (with integrase). The bottom panel shows results obtained with Illumina deep sequencing approach using the SCI Reinv evolved D7 strain (with integrase). bp: base pair.
Fig 4
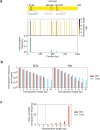
Fig 4. Analysis of the DNA homopolymer distribution among the integrase genes.
a. Insertion-deletion (indel) mutation frequency and homopolymer distribution in the intIA integrase gene. A schematic view of the integrase gene and the position of the three largest homopolymers is shown just above the graph to help locate the mutation pattern. The top panel of the graph shows a barcode representing the distribution of homopolymers all along the intIA integrase gene with colors ranging from white to black depending on the length of the homopolymers, respectively from the smallest to the largest (from 3 to 8 bp). The bottom panel of the graph corresponds to the top panel of the Fig 3C in which mutations that do not correspond to indels in homopolymers have been removed. Note that we only considered the homopolymers containing three or more repeats. b. Frequency of the DNA homopolymers for lengths ranging from 1 to 10 within the integrase genes of SCIs (left panel) and MIs (right panel). For each panel, the frequency of the homopolymer lengths observed (obs) in SCI and MI integrase genes is represented in orange-red and the frequency of the homopolymer lenghts theoretically (theo) expected from randomized sequences is represented in light blue. The randomized sequences were generated by randomly shuffling the nucleotides of each SCI and MI integrase sequences. c. Ratio of the DNA homopolymer frequency for lengths ranging from 1 to 10 within the integrase genes of SCIs compared to the MI ones. The ratio observed (obs) between SCI and MI integrase genes is represented in orange-red and the ratio theoretically (theo) expected from the randomized sequences is represented in light blue. bp: base pair.
Fig 5
Fig 5. Analysis of the partial re-inversion event in the array of the Vibrio cholerae chromosomal sedentary integron.
a. Representation of the SCI array of the three clones of interest. Orange triangles show the cassettes from the inverted part of the array, and the blue ones, the cassettes from the re-inverted part of the array (i.e. with IS3 recombination, IS3 rec.). The green triangles show the six toxin-antitoxin cassettes present in the first inverted part of the array. The duplicated ones are indicated by an asterisk. The dark blue arrows represent the deletion events. The red rectangles each with a white arrow show the IS3 copies. b. Schematic representation of the partial SCI re-inversion event at the scale of the chromosome 2 of V. cholerae and focus on the two recombination points involved in this re-inversion. The PCR primer pairs used to identify the recombination event are represented: i1 and i2 are the primer pairs that should be positive in non-evolved. r1 and r2 are the primer pairs that should be positive upon recombination between the two IS3 copies within the SCI (SCI inv with IS3 rec.). c. PCR profile of the six clones tested for the SCI array configuration. The gels show the PCR results obtained using r1, i1, r2, i2 primer pairs for three non-evolved SCI Inv clones (left panel) as well as for each of the three evolved clones with IS3 recombination (right panel).

References

    1. Cambray G, Guerout AM, Mazel D. Integrons. Annu Rev Genet. 2010;44:141–66. doi: 10.1146/annurev-genet-102209-163504 - DOI - PubMed
    1. Mazel D. Integrons: agents of bacterial evolution. Nat Rev Microbiol. 2006;4(8):608–20. doi: 10.1038/nrmicro1462 - DOI - PubMed
    1. Loot C, Millot GA, Richard E, Littner E, Vit C, Lemoine F, et al.. Integron cassettes integrate into bacterial genomes via widespread non-classical attG sites. Nat Microbiol. 2024;9(1):228–40. doi: 10.1038/s41564-023-01548-y - DOI - PubMed
    1. Escudero JA, Loot C, Nivina A, Mazel D. The Integron: Adaptation On Demand. Microbiology spectrum. 2015;3(2):MDNA3-0019-2014. doi: 10.1128/microbiolspec.MDNA3-0019-2014 - DOI - PubMed
    1. Guerin E, Cambray G, Sanchez-Alberola N, Campoy S, Erill I, Da Re S, et al.. The SOS response controls integron recombination. Science. 2009;324(5930):1034. doi: 10.1126/science.1172914 - DOI - PubMed