. 2024 Apr 23;43(4):114054.
doi: 10.1016/j.celrep.2024.114054. Epub 2024 Apr 4.

14-3-3 binding motif phosphorylation disrupts Hdac4-organized condensates to stimulate cardiac reprogramming

Affiliations

14-3-3 binding motif phosphorylation disrupts Hdac4-organized condensates to stimulate cardiac reprogramming

Liu Liu et al. Cell Rep. .

Abstract

Cell fate conversion is associated with extensive post-translational modifications (PTMs) and architectural changes of sub-organelles, yet how these events are interconnected remains unknown. We report here the identification of a phosphorylation code in 14-3-3 binding motifs (PC14-3-3) that greatly stimulates induced cardiomyocyte (iCM) formation from fibroblasts. PC14-3-3 is identified in pivotal functional proteins for iCM reprogramming, including transcription factors and chromatin modifiers. Akt1 kinase and protein phosphatase 2A are the key writer and key eraser of the PC14-3-3 code, respectively. PC14-3-3 activation induces iCM formation with the presence of only Tbx5. In contrast, PC14-3-3 inhibition by mutagenesis or inhibitor-mediated code removal abolishes reprogramming. We discover that key PC14-3-3-embedded factors, such as histone deacetylase 4 (Hdac4), Mef2c, and Foxo1, form Hdac4-organized inhibitory nuclear condensates. PC14-3-3 activation disrupts Hdac4 condensates to promote cardiac gene expression. Our study suggests that sub-organelle dynamics regulated by a PTM code could be a general mechanism for stimulating cell reprogramming.

Keywords: 14-3-3; CP: Molecular biology; biomolecular condensate; cardiac reprogramming; epigenetic code; post-translational modification.


Conflict of interest statement

Declaration of interests The authors declare no competing interests.

Figures

Figure 1.
Figure 1.. Phosphorylation in 14-3-3 binding motifs is a phosphorylation code embedded in diverse classes of proteins that can regulate cardiac reprogramming
(A) A schematic diagram of the phosphorylation screen strategy. Mutated individual genes were transduced into MEFs derived from a transgenic α-major histocompatibility complex (αMHC)-GFP reporter mouse with retroviruses expression. Medium was changed every 2 days. Reprogramming efficiency was evaluated 14 days after transduction by qPCR. (B) Myh6 expression measured after MEF induction with dephosphorylation mutation library. (C and D) Immunocytochemistry (ICC) of cardiac markers cTnT of S82A mutation construct or WT-transduced cells by fluorescence microscopy (100×). Mef2c-GT, Mef2c+Gata4+Tbx5. *p < 0.05, **p < 0.01, and ***p < 0.001 vs. MGT. Fold change (FC) of GFP-positive or cTnT-positive cells counted in 100× power field (PF). n = 10. (E) Mutations of 14-3-3 binding motif phosphorylation disrupted 14-3-3 binding to Mef2c. HEK293 cells were transfected with 14-3-3 together with either WT or S82A or T20A mutation of Mef2c. Mef2c was immunoprecipitated with anti-Mef2c antibody followed by western blotting and detection of 14-3-3 isoform YWHAB-FLAG by FLAG antibody. (F) A schematic diagram of the 14-3-3 binding motif dephosphorylation-mimicking screen strategy. Mutated individual genes were transduced into MEFs derived from a transgenic αMHC-GFP reporter mouse with retroviruses expressing MGT. Reprogramming efficiency was evaluated 14 days after transduction by qPCR as shown in (A). (G) Relative expression of Myh6 in iCM reprogramming with WT and mutant PC14-3-3-containing proteins 14 days after MGT transduction. **p < 0.01 vs. WT. n = 3. (H) Relative expression of Myh6 in iCM reprogramming with WT and mutant PC14-3-3-containing proteins 14 days after MGT transduction. Data are normalized to the MGT+empty plasmid group. *p < 0.05, **p < 0.01, and ***p < 0.001 vs. WT. FC, fold change. Data represent three independent experiments and are presented as mean ± SD. Each independent experiment consists of at least three technical replicates. One-way ANOVA.
Figure 2.
Figure 2.. Phosphorylation in 14-3-3 binding motifs is required and positively associated with conversion from fibroblasts to iCMs
(A) A schematic diagram of establishing an inducible cardiac reprogramming cell line with cardiac-specific Myh6 promoter-driven marker gene GFP. (B) Flow cytometry sorting of reprogrammed cells. The inducible cardiac reprogramming cell line was treated with doxycycline for 2 days. Successfully reprogrammed Myh6− GFP+ cells and unsuccessfully reprogrammed Myh6− GFP− cells were separated by flow cytometry. (C) Detection of 14-3-3 binding motif phosphorylation by western blot. Protein lysates from Myh6− GFP+ cells and Myh6− GFP− cells isolated from (B) were used for the assay. (D and E) 14-3-3 inhibitor (14-3-3 antagonist I, 2-5) (D) and direct shRNA knockdown of 14-3-3 proteins (E) significantly decreased reprogramming efficiency by qPCR. n = 3. (F and G) ICC and quantification of cardiac marker cTnT of MGT-transduced cells with 14-3-3 inhibitor or shRNA knockdown of 14-3-3 proteins. n = 10. *p < 0.05, **p < 0.01, and ***p < 0.001 vs. MGT. Data represent three independent experiments and are presented as mean ± SD. Each independent experiment consists of at least three technical replicates. One-way ANOVA.
Figure 3.
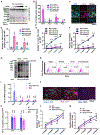
Figure 3.. PP2A inhibitor okadaic acid (OA) and Akt1 treatment leads to PC14-3-3 activation and drastically enhances reprogramming
(A) PP2A inhibitor OA activated PC14-3-3. Phosphorylation of 14-3-3 binding motifs was detected by western blot of protein lysates from MEF cells with OA treatment. (B) Relative expression of CM marker genes of iCM reprogramming with Akt1 and OA treatment 14 days after MGT transduction with or without shRNA YWHAZ/E. Statistical analyses were performed between MEFs with Akt1 and OA or DMSO-treated groups. *p < 0.05 vs. MGT. #p < 0.05 and ##p < 0.01 vs. MGT+Akt1+OA. n = 3. (C and D) ICC and quantification of cardiac markers TnT and Myh6-GFP of MGT-transduced cells with or without Akt1 and OA treatment with or without shRNA YWHAZ/E by fluorescence microscopy (100×). ICC results indicated increased iCM maturation with the treatment of MGT+Akt+OA. ***p < 0.001 vs. MGT. ###p < 0.001 vs. MGT+Akt1+OA. n = 10. (E) Quantification of spontaneous Ca2+ oscillation cells per field with indicated viral infection treatment for 1–4 weeks (n = 50 from 10 wells). ***p < 0.001 vs. MGT+DMSO. ###p < 0.001 vs. MGT+Akt1+OA. (F) Quantification of beating iCMs loci with indicated viral infection for 1–4 weeks (n = 10). ***p < 0.001 vs. MGT+DMSO. ###p < 0.001 vs. MGT+Akt1+OA. (G) Phosphorylation of 14-3-3 binding motifs was detected by western blot of protein lysates from MEF cells with or without MK-2206 (Akt1 inhibitor) + DT-061 (PP2A activator) treatment. (H) Successfully reprogrammed Myh6− GFP+ cells were detected by flow cytometry with or without MK-2206 (Akt1 inhibitor) + DT-061 (PP2A activator) treatment in iCM cell line. (I) Relative expression of CM marker genes in iCM reprogramming with Akt1 and OA treatment 14 days after Tbx5 transduction. *p < 0.05, **p < 0.01, and ***p < 0.001 vs. NC. (J and K) ICC and Quantification of cardiac markers α-actinin of Tbx5 or control-transduced cells with or without Akt1 and OA treatment by fluorescence microscopy (400×). ***p < 0.001, vs. NC. (L and M) Quantification of spontaneous Ca2+ oscillation cells per field (L) or beating iCM loci with Tbx5 or control-transduced cells (M) with or without Akt1 and OA treatment for 1–4 weeks (n = 10). *p < 0.05, **p < 0.01, ***p < 0.001, #p < 0.05, ##p < 0.01, and ###p < 0.001 vs. NC. Data represent three independent experiments and are presented as mean ± SD. Each independent experiment consists of at least three technical replicates. One-way ANOVA.
Figure 4.
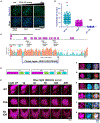
Figure 4.. PC14-3-3 activation regulates Hdac4-organized condensates with multiple 14-3-3-motif-embedded proteins
(A and B) ICC of endogenous Hdac4 in reprogramming cells treated with OA+Akt1 or MK-2206 (Akt1 inhibitor) + DT-061 (PP2A activator) by fluorescence microscopy. Magnification image showing the Hdac4+5+9 condensates (green dots) in a single reprogramming cell. Sample size: MK+DT (n = 321), DMSO (n = 344), and Akt1+OA (n = 287). (C and D) A schematic diagram showing Hdac4 14-3-3 binding motifs, intrinsically disordered regions (IDRs), potential phase separation regions, and the construction strategy for optoIDR assay. (E) Time-lapse images of the HE293T cell expressing Hdac4205-646aa-optoIDR with laser excitation. A droplet fusion event occurs in the Hdac4-3SA205-646aa optoIDR group but not in the Hdac4205-646aa optoIDR group. (F–H) Co-overexpression of Hdac4-3SA with PC14-3-3-embedded factors Mef2c (F), Foxo1 (G), and Nrip (H) showing that Hdac4 co-localized with these factors in the same condensate. (I–K) Co-overexpression of Hdac4-3SA with PP2A subunits showing that Hdac4 co-localizes with PP2A subunits B56alpha (I), B56delta (J), and B56epsilon (K) in the same condensate. Data represent three independent experiments and are presented as mean ± SD. Each independent experiment consists of at least three technical replicates. One-way ANOVA.
Figure 5.
Figure 5.. PC14-3-3 dissociates Hdac4 condensates to facilitate cardiac reprogramming
(A) A schematic diagram of Hdac4 mutants in 14-3-3 binding motifs combined with replacement of a permanent binding peptide R18. (B) Immunostaining of specific mutant Hdac4 proteins in reprogramming cells. (C) Co-overexpression of Hdac4 mutants with PC14-3-3-embedded factor Mef2c showing that R18 dissociates Hdac4 co-localized with MEF2C in the same condensate. (D) Relative expression of CM marker genes during iCM reprogramming with expression of Hdac4 mutants 3R18 and 3SA. *p < 0.05, **p < 0.01, and ***p < 0.001, WT vs. 3SA. #p < 0.05, ##p < 0.01, and ###p < 0.001, 3SA vs. 3R18. n = 3. (E) ICC of Hdac4 in iCM cells with Hdac4 overexpression and Hdac4 inhibitor treatment. Among Hdac4 inhibitors, TMP269, but not MC1568 and BML210, dissociates Hdac4 condensates. (F and G) ICC by fluorescence microscopy (F) and quantification (G) of cardiac markers cTnT and Myh6-GFP of MGT-transduced cells with Hdac4 inhibitor TMP269 treatment (400×). (H) Heatmap showing the effect of Hdac4 inhibitor TMP269 on representative cardiac-related gene expression (GO: 0048738) among MGT-transduced cells. n = 3. (I) Chromatin immunoprecipitation (ChIP)-qPCR of Hdac4-GFP at cardiac gene loci from iCM cells treated with OA (PC14-3-3 activation) or MK+DT (PC14-3-3 inhibition). *p < 0.05 vs. IGG. n = 3. Data represent three independent experiments and are presented as mean ± SD. Each independent experiment consists of at least three technical replicates. One-way ANOVA.

Update of

Similar articles

Cited by

References

    1. Ieda M, Fu JD, Delgado-Olguin P, Vedantham V, Hayashi Y, Bruneau BG, and Srivastava D (2010). Direct reprogramming of fibroblasts into functional cardiomyocytes by defined factors. Cell 142, 375–386. - PMC - PubMed
    1. Song K, Nam YJ, Luo X, Qi X, Tan W, Huang GN, Acharya A, Smith CL, Tallquist MD, Neilson EG, et al. (2012). Heart repair by reprogramming non-myocytes with cardiac transcription factors. Nature 485, 599–604. 10.1038/nature11139. - DOI - PMC - PubMed
    1. Qian L, Huang Y, Spencer CI, Foley A, Vedantham V, Liu L, Conway SJ, Fu JD, and Srivastava D (2012). In vivo reprogramming of murine cardiac fibroblasts into induced cardiomyocytes. Nature 485, 593–598. 10.1038/nature11044. - DOI - PMC - PubMed
    1. Zhou Y, Wang L, Vaseghi HR, Liu Z, Lu R, Alimohamadi S, Yin C, Fu JD, Wang GG, Liu J, and Qian L (2016). Bmi1 Is a Key Epigenetic Barrier to Direct Cardiac Reprogramming. Cell Stem Cell 18, 382–395. 10.1016/j.stem.2016.02.003. - DOI - PMC - PubMed
    1. Christoforou N, Chellappan M, Adler AF, Kirkton RD, Wu T, Addis RC, Bursac N, and Leong KW (2013). Transcription factors MYOCD, SRF, Mesp1 and SMARCD3 enhance the cardio-inducing effect of GATA4, TBX5, and MEF2C during direct cellular reprogramming. PLoS One 8, e63577. 10.1371/journal.pone.0063577. - DOI - PMC - PubMed

Publication types