. 2024 Mar 29;165(5):bqae044.
doi: 10.1210/endocr/bqae044.

β-Cell Insulin Resistance Plays a Causal Role in Fat-Induced β-Cell Dysfunction In Vitro and In Vivo

Affiliations

β-Cell Insulin Resistance Plays a Causal Role in Fat-Induced β-Cell Dysfunction In Vitro and In Vivo

Aleksandar Ivovic et al. Endocrinology. .

Abstract

In the classical insulin target tissues of liver, muscle, and adipose tissue, chronically elevated levels of free fatty acids (FFA) impair insulin signaling. Insulin signaling molecules are also present in β-cells where they play a role in β-cell function. Therefore, inhibition of the insulin/insulin-like growth factor 1 pathway may be involved in fat-induced β-cell dysfunction. To address the role of β-cell insulin resistance in FFA-induced β-cell dysfunction we co-infused bisperoxovanadate (BPV) with oleate or olive oil for 48 hours in rats. BPV, a tyrosine phosphatase inhibitor, acts as an insulin mimetic and is devoid of any antioxidant effect that could prevent β-cell dysfunction, unlike most insulin sensitizers. Following fat infusion, rats either underwent hyperglycemic clamps for assessment of β-cell function in vivo or islets were isolated for ex vivo assessment of glucose-stimulated insulin secretion (GSIS). We also incubated islets with oleate or palmitate and BPV for in vitro assessment of GSIS and Akt (protein kinase B) phosphorylation. Next, mice with β-cell specific deletion of PTEN (phosphatase and tensin homolog; negative regulator of insulin signaling) and littermate controls were infused with oleate for 48 hours, followed by hyperglycemic clamps or ex vivo evaluation of GSIS. In rat experiments, BPV protected against fat-induced impairment of β-cell function in vivo, ex vivo, and in vitro. In mice, β-cell specific deletion of PTEN protected against oleate-induced β-cell dysfunction in vivo and ex vivo. These data support the hypothesis that β-cell insulin resistance plays a causal role in FFA-induced β-cell dysfunction.

Keywords: beta-cell dysfunction; beta-cell insulin resistance; beta-cell insulin signaling; lipotoxicity; oleate; olive oil.


Figures

Figure 1.
Figure 1.
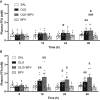
Plasma FFA levels during the 48-hour intravenous infusion period. 12-week-old female Wistar rats were treated with: (i) Saline (SAL, n = 12) (A, B); (ii) Oleate alone (OLE, 1.3 µmol/min, n = 10) (A) or Olive oil alone (OLO, 5.5 µL/min, n = 9) (B); (iii) Oleate + Bisperoxovanadate (OLE + BPV, oleate-1.3 µmol/min, BPV-0.0025 µmol/kg//min, n = 8) (A) or Olive oil + Bisperoxovanadate (OLO + BPV, OLO-5.5 µL/min, BPV-0.0025 µmol·kg/min, n = 8) (B); or (iv) Bisperoxovanadate alone (BPV, n = 6) (A, B). Data are means ± SEM. *P < .05 vs SAL. &P < .05 vs SAL and BPV. &&P < .01 vs SAL and BPV. ##P < .01 vs BPV. ###P < .001 vs BPV.
Figure 2.
Figure 2.
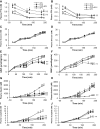
Plasma free fatty acids (FFA; A, B), plasma glucose (C, D), glucose infusion rate (GINF; E, F), plasma insulin (G, H), and plasma C-peptide (I, J) during 2-step hyperglycemic clamps with/without 48 hours oleate (A, C, E, G, I) or olive oil (B, D, F, H, J) intravenous infusion and with/without co-infusion of BPV (A-J) in rats. 12-week-old female Wistar rats were treated with: (i) Saline (SAL, n = 14); (ii) Oleate alone (OLE, 1.3 µmol/min, n = 10) or Olive oil alone (OLO, 5.5 µL/min, n = 9); (iii) Oleate + Bisperoxovanadate (OLE + BPV, OLE:1.3 µmol/min, BPV:0.0025 µmol/kg/min, n = 6) or Olive oil + Bisperoxovanadate (OLO + BPV, OLO-5.5 µL/min, BPV-0.0025 µmol·kg/min, n = 8); or (iv) Bisperoxovanadate alone (BPV, 0.0025 µmol/kg/min, n = 9 for 13 mM and n = 8 for 22 mM). Data are means ± SEM. †† P < .01 oleate/olive oil–infused groups vs non-oleate/olive oil–infused groups throughout the hyperglycemic clamp (A, B). **P < .01 OLE and OLE + BPV vs SAL during the second step of the hyperglycemic clamp (E). **P < .01 OLO vs SAL during the second step of the hyperglycemic clamp (F). **P < .01 all vs SAL during the second step of the hyperglycemic clamp (G). **P < .01 BPV vs SAL during the second step of the hyperglycemic clamp (H). **P < .01 all vs SAL during the second step of the hyperglycemic clamp (I). **P < .01 BPV vs SAL during the second step of the hyperglycemic clamp (J).
Figure 3.
Figure 3.
Sensitivity Index (SI = GINF/Insulin, units are μmol/kg/min glucose divided by pM insulin); A, B, Insulin Clearance Index (C-peptide/Insulin, units are nM C-peptide divided by pM insulin); C, D, and Disposition Index (DI = C-peptide multiplied by Sensitivity Index, units are nM C-peptide multiplied by unit of Sensitivity Index); E, F, during 2-step hyperglycemic clamps with/without 48 hours oleate (A, C, E) or olive oil (B, D, F) intravenous infusion and with/without co-infusion of BPV (A-F) in rats. 12-week-old female Wistar rats were treated with: (i) Saline (SAL, n = 14); (ii) Oleate alone (OLE, 1.3 µmol/min, n = 10) or Olive oil alone (OLO, 5.5 µL/min, n = 9); (iii) Oleate + Bisperoxovanadate (OLE + BPV, OLE:1.3 µmol/min, BPV:0.0025 µmol/kg/min, n = 6) or Olive oil + Bisperoxovanadate (OLO + BPV, OLO-5.5 µL/min, BPV-0.0025 µmol·kg/min, n = 8); (iv) Bisperoxovanadate alone (BPV, 0.0025 µmol/kg/min, n = 9 for 13 mM and n = 8 for 22 mM). Data are means ± SEM. *P < .05 vs SAL (A, B). ** P < .01 vs SAL (A, B, E, F). ‡ P < .05 BPV and OLE + BPV vs SAL or OLE (C, D).
Figure 4.
Figure 4.
Insulin secretory response to glucose of freshly isolated islets of 12-week-old female Wistar rats intravenously infused for 48 hours with: (i) Saline (SAL, n = 17) (A, B); (ii) Oleate alone (OLE, 1.3 µmol/min, n = 14) (A) or Olive oil alone (OLO, 5.5 µL/min, n = 13) (B); (iii) Oleate + Bisperoxovanadate (OLE + BPV, oleate-1.3 µmol/min, BPV-0.0025 µmol/kg//min, n = 8) (A) or Olive oil + Bisperoxovanadate (OLO + BPV, OLO-5.5 µL/min, BPV-0.0025 µmol·kg/min, n = 7) (B); (iv) Bisperoxovanadate alone (BPV, n = 6) (A, B). Freshly isolated islets of in vivo infused rats were pre-incubated for 1 hour at 37 °C in KRBH supplemented with 2.8 mM glucose. Thereafter, 5 rat islets of approximately the same size were incubated in triplicate in KRBH buffer containing 2.8 mM (non-GSIS), 6.5 mM (basal glucose level in rodents), 13 or 22 mM glucose (as in hyperglycemic clamps) for 2 hours at 37 °C. Insulin content is shown in islets of a random subset of rats intravenously infused as in (A) and (B) (SAL n = 3; OLE/OLO n = 3 [1 OLE, 2 OLO]; OLE/OLO + BPV, n = 3 [2 OLE + BPV, 1 OLO + BPV]) (C). Data are means ± SEM. *P < .05 OLE vs all. $$P < .01 OLE vs OLE + BPV and BPV. &P < .05 OLE or OLO vs SAL and OLE + BPV or OLO + BPV. #P < .05 OLO vs SAL. ‡P < .05 OLE/OLO vs SAL and OLE/OLO + BPV.
Figure 5.
Figure 5.
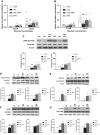
Insulin secretory response to glucose in cultured islets exposed for 48 hours to: (i) bovine serum albumin (BSA, 0.5%; VEH; n = 19); (ii) Palmitate (PAL; 0.4 mM in BSA; n = 14); (iii) Palmitate + Bisperoxovanadate (PAL + BPV; palmitate-0.4 mM in BSA, BPV-4 µM; n = 16); (iv) BPV (n = 15) (A). Insulin secretory response to glucose in cultured islets exposed for 48 hours to: (i) Bovine serum albumin (BSA, 0.5%; VEH; n = 9); (ii) Oleate (OLE; 0.4 mM in BSA; n = 14); (iii) Oleate + Bisperoxovanadate (OLE + BPV; oleate-0.4 mM in BSA, BPV-4 µM; n = 10); (iv) BPV (n = 7) (B). Islets of untreated 12-week-old female Wistar rats were cultured for 48 hours in RPMI 1640 without antioxidants, containing 6.5 mM glucose and 0.4 mM palmitate or oleate in 0.5% BSA or 0.5% BSA alone with or without 4 µM BPV. Thereafter, islets were pre-incubated for 1 hour at 37 °C in KRBH supplemented with 2.8 mM glucose. Subsequently 5 islets of approximately the same size were incubated in triplicate in KRBH buffer containing 6.5 mM or 22 mM glucose for 2 hours for the determination of insulin secretion. Insulin secretion data in (A) and (B) were obtained by 2 different experimenters. Representative blot and quantification of phosphorylated Akt/total Akt expression in cultured islets exposed for 48 hours to VEH, PAL, or OLE with/without BPV (n = 7 for all) after 5-minute 200 nM insulin exposure (C). Representative blots and quantification of other insulin signaling pathway effectors in islets, namely IRS-1, ERK1/2, GSK3β, and mTOR, after 48 hours exposure to the above treatments (n = 4-5). Islets were exposed to 200 nM insulin for 5 minutes before protein quantification (D-G). For (C-G), controls were run for each blot and results of all other groups are expressed as a percentage of control in each blot. Data are means ± SEM. *P < .05 vs all (A, C, E). ** P < .01 vs all (B, C, E). $P < .05 vs OLE + BPV, BPV (D). $$P < .01 vs PAL + BPV, BPV (D, F, G). &P < .05 vs OLE + BPV (G).
Figure 6.
Figure 6.
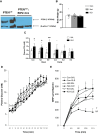
PTEN protein levels in isolated islets of β-cell specific PTEN knockout mice (PTENF/F: RIP2-Cre) and their floxed controls (PTENF/F) (A). Body weights of 12-week-old male β-cell specific homozygous (KO, n = 7) and heterozygous (Het, n = 13) PTEN-knockout mice and littermate controls (mixture of PTEN floxed and wild-type Cre+: Con, n = 9) prior to intravenous infusion (B). Plasma FFA (C) plasma glucose (D), and glucose infusion rate (GINF; E), during a 22 mM hyperglycemic clamp of 12-week-old male β-cell specific homozygous and heterozygous PTEN-knockout mice and littermate controls (mixture of PTEN floxed and wild-type Cre+) infused intravenously for 48 hours with saline (SAL: Con [n = 5], Het [n = 7], KO [n = 5]) or oleate (OLE: 0.4 µmol/min; Con [n = 6], Het [n = 8], KO [n = 5]). Data are means ± SEM. * P < .05 vs respective SAL; ** P < .01 vs respective SAL (C). * P < .05 vs Con-SAL; ## P < .01 vs KO-OLE (E).
Figure 7.
Figure 7.
Plasma Insulin (A), Plasma C-peptide (B), Insulin Clearance Index (C-peptide/Insulin, units are nM C-peptide divided by pM insulin) (C), Sensitivity Index (SI = GINF/Insulin, units are μmol/kg/min glucose divided by pM insulin) (D), and Disposition Index (DI = C-peptide multiplied by Sensitivity Index, units are nM C-peptide multiplied by unit of Sensitivity Index) (E) during a 22 mM hyperglycemic clamp of 12-week-old male β-cell specific homozygous and heterozygous PTEN-knockout mice (KO and Het, respectively) and littermate controls (mixture of PTEN floxed and wild-type Cre+, Con) infused i.v. for 48 hours with saline (SAL: Con [n = 5], Het [n = 7], KO [n = 5]) or oleate (OLE: 0.4 µmol/min; Con [n = 6], Het [n = 8], KO [n = 5]). * P < .05 vs respective SAL. ** P < .01 vs respective SAL.
Figure 8.
Figure 8.
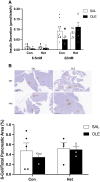
Insulin secretion (A) in islets isolated from 12-week-old male β-cell specific heterozygous PTEN-knockout mice and littermate controls (mixture of PTEN floxed and wild-type Cre+) infused intravenously for 48 hours with saline (SAL: Con [n = 10], Het [n = 7]) or oleate (OLE: 0.4 µmol/min; Con [n = 5], Het [n = 6]). Freshly isolated islets of in vivo infused mice were pre-incubated for 1 hour at 37 °C in KRBH supplemented with 2.8 mM glucose. Thereafter, 10 mouse islets of approximately the same size were incubated in duplicate at 6.5 and 22 mM glucose for 2 hours at 37 °C. Representative images and quantification of % β-cell/total pancreatic area (B) in heterozygous 12 week old male PTEN-knockout mice and littermate controls (mixture of PTEN floxed and wild-type Cre+) infused intravenously for 48 hours with saline (SAL: Con [n = 5], Het [n = 4]) or oleate (OLE: 0.4 µmol/min; Con [n = 3], Het [n = 4]). Data are means ± SEM. * P < .05 vs respective SAL.

References

    1. Xiao C, Giacca A, Lewis GF. Sodium phenylbutyrate, a drug with known capacity to reduce endoplasmic reticulum stress, partially alleviates lipid-induced insulin resistance and β-cell dysfunction in humans. Diabetes 2011;60(3):918‐924. - PMC - PubMed
    1. Xiao C, Giacca A, Lewis GF. Oral taurine but not N-acetylcysteine ameliorates NEFA-induced impairment in insulin sensitivity and beta cell function in obese and overweight, non-diabetic men. Diabetologia 2008;51(1):139‐146. - PubMed
    1. Böni-Schnetzler M, Boller S, Debray S, et al. Free fatty acids induce a proinflammatory response in islets via the abundantly expressed interleukin-1 receptor I. Endocrinology 2009;150(12):5218‐5229. - PubMed
    1. Itani SI, Ruderman NB, Schmieder F, Boden G. Lipid-induced insulin resistance in human muscle is associated with changes in diacylglycerol, protein kinase C, and IκB-α. Diabetes 2002;51(7):2005‐2011. - PubMed
    1. Smith U, Kahn BB. Adipose tissue regulates insulin sensitivity: role of adipogenesis, de novo lipogenesis and novel lipids. J Intern Med 2016;280(5):465‐475. - PMC - PubMed

Publication types