. 2024 Apr 16;121(16):e2313440121.
doi: 10.1073/pnas.2313440121. Epub 2024 Apr 5.

The genetic regulatory architecture and epigenomic basis for age-related changes in rattlesnake venom

Affiliations

The genetic regulatory architecture and epigenomic basis for age-related changes in rattlesnake venom

Michael P Hogan et al. Proc Natl Acad Sci U S A. .

Erratum in

Abstract

Developmental phenotypic changes can evolve under selection imposed by age- and size-related ecological differences. Many of these changes occur through programmed alterations to gene expression patterns, but the molecular mechanisms and gene-regulatory networks underlying these adaptive changes remain poorly understood. Many venomous snakes, including the eastern diamondback rattlesnake (Crotalus adamanteus), undergo correlated changes in diet and venom expression as snakes grow larger with age, providing models for identifying mechanisms of timed expression changes that underlie adaptive life history traits. By combining a highly contiguous, chromosome-level genome assembly with measures of expression, chromatin accessibility, and histone modifications, we identified cis-regulatory elements and trans-regulatory factors controlling venom ontogeny in the venom glands of C. adamanteus. Ontogenetic expression changes were significantly correlated with epigenomic changes within genes, immediately adjacent to genes (e.g., promoters), and more distant from genes (e.g., enhancers). We identified 37 candidate transcription factors (TFs), with the vast majority being up-regulated in adults. The ontogenetic change is largely driven by an increase in the expression of TFs associated with growth signaling, transcriptional activation, and circadian rhythm/biological timing systems in adults with corresponding epigenomic changes near the differentially expressed venom genes. However, both expression activation and repression contributed to the composition of both adult and juvenile venoms, demonstrating the complexity and potential evolvability of gene regulation for this trait. Overall, given that age-based trait variation is common across the tree of life, we provide a framework for understanding gene-regulatory-network-driven life-history evolution more broadly.

Keywords: Crotalus; epigenomics; gene regulatory network; ontogeny; venom.


Conflict of interest statement

Competing interests statement:The authors declare no competing interest.

Figures
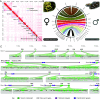
Fig. 1.
Fig. 1.
Reference genome for C. adamanteus and the organization of venom genes. The final assembly consisted of 366 contigs and 27 scaffolds with a contig N50 of 67.533 Mb and a scaffold N50 of 208.942 Mb. (A) The highly contiguous primary assembly required little scaffolding to assemble all 17 autosomes, as well as both sex chromosomes. (B) We found broad agreement with the previously published genome for C. viridis (23) on the basis of locations of BUSCO loci. Lines connect BUSCO loci detected in both genomes. (C) Most chromosomes were assembled from telomere-to-telomere. All venom-gene arrays were assembled within single contigs in our primary assembly except for the C-type lectin (CTL) array on chromosome 6, which had one break. The CTL array structure was confirmed by comparison with other assemblies, where the break was fully resolved (SI Appendix, Table S3 and Fig. S9D). Blue numbers on the left end of the arrays indicate approximate sizes of the expanded region for each venom-gene array. Venom genes expressed at high levels (average TPM > 500) are indicated with an asterisk. Abbreviations: 3FTx—Three-finger toxin, BPP—Bradykinin-potentiating peptide, Chrm—Chromosome, CRISP—Cysteine-rich secretory protein, CTL—C-type lectin, HYAL—Hyaluronidase, KUN—Kunitz-type protease inhibitor, LAAO—L-amino acid oxidase, MYO—Myotoxin, NGF-Nerve growth factor, NUC—Nucleotidase, PDE—Phosphodiesterase, PLA2—Phospholipase A2, PLB—Phospholipase B, SVMP—Snake venom metalloproteinase, SVSP—Snake venom serine protease, VEGF—Vascular endothelial growth factor.
Fig. 2.
Fig. 2.
Differential venom and transcription factor (TF) gene expression between adults and juveniles. (A) We identified 24 differentially expressed venom genes (log2-fold change >1 and FDR <0.05) using snout–vent length (SVL; adults >1,000 mm) as our proxy for age. The vast majority of age-biased venom genes showed higher expression in adults relative to juveniles. The largest subadult (SVL = 880 mm) showed an intermediate pattern, consistent with a gradual transition (31). Heatmap cells are colored based on regularized log (rlog) count differences per gene. (B) The largest class-level expression differences for venom genes correspond to toxin classes with differentially expressed paralogs (e.g., CTLs, PLA2s, SVSPs, SVMPs). One exception is BPP, where a single gene on chromosome 5 is up-regulated in adults (SI Appendix, Fig. S17). Stacked bars represent venom composition based on average transcripts per million (TPM) for juveniles and adults. (C) We identified 37 differentially expressed putative TFs, with the vast majority being adult biased. (D) A complete visualization of venom gland expression shows drastic shifts in venom compared to the majority of nonvenom genes. Abbreviations: BPP—Bradykinin-potentiating peptide, CRISP—Cysteine-rich secretory protein, CTL—C-type lectin, LAAO—L-amino acid oxidase, MYO—Myotoxin, NGF-Nerve growth factor, PLA2—Phospholipase A2, PLB—Phospholipase B, SVMP—Snake venom metalloproteinase, SVSP—Snake venom serine protease.
Fig. 3.
Fig. 3.
ATAC-seq reveals differential chromatin accessibility between adults and juveniles. (AC) In parallel with gene-expression patterns, the vast majority of age-biased peaks showed higher accessibility in adults relative to juveniles. We used the same cutoff for differential accessibility as differential expression (log2-fold change >1 and FDR <0.05). To illustrate the spatial relation of accessible regions and venom genes, we split results based on spatial proximity to the nearest venom gene: (A) within gene margins, (B) flanking gene to 1 kb, and (C) flanking between 1 and 10 kb. We represented peaks by the name of the closest gene, with many venom genes having multiple associated peaks. Heatmap cells are colored based on regularized log (rlog) count differences per peak. For clarity, only peaks associated with DE venom genes are represented in the heatmaps shown. (D) A complete visualization of venom-gland chromatin accessibility from ATAC-seq suggests that the adult bias is more centered around venom than the juvenile bias. Read coverage distributions for all venom genes are provided in SI Appendix, Figs. S12–S19.
Fig. 4.
Fig. 4.
CUT&RUN reveals differential patterns of H3K27ac histone modification between adults and juveniles. (AC) We see general agreement with the ATAC-seq results, where differential H3K27ac modifications occur around differentially expressed venom genes. We analyzed and reported patterns from CUT&RUN following our ATAC-seq results (Fig. 3). For clarity, only peaks associated with DE venom genes are represented in the heatmaps shown. We represented peaks by the name of the closest gene, with many venom genes having multiple associated peaks. (D) A visualization of venom-gland H3K27ac patterns from CUT&RUN suggests that the venom accessibility bias is more comparable between adults and juveniles when compared to our ATAC-seq patterns (Fig. 3D). Read coverage distributions for all venom genes are provided in SI Appendix, Figs. S12–S19.
Fig. 5.
Fig. 5.
Overlapping ontogenetic biases between venom gene expression and chromatin accessibility and differential H3K27ac histone modifications in C. adamanteus. Differential gene expression (DE) via RNA-seq and differential peak accessibility and histone modifications (DA) via ATAC-seq and CUT&RUN between adults (colored red) and juveniles (colored blue). Both DE and DA analyses utilized the same significance threshold (log2-fold change >1 and FDR <0.05). (A) SVMP gene array and accessible peaks colored by significant age bias highlighting DE and DA overlap, with DE gene regions typically overlapping or flanked by matching DA peaks. The array is oriented with adam28 on the Left and NEFL on the Right. (B) The association between changes in expression patterns of venom genes and changes in chromatin accessibility and histone modifications (H3K27ac). We performed linear regression analyses of the log2-fold changes (LFCs) in expression and epigenomic patterns between adults and juveniles. Peaks were binned according to their relationship to their nearest venom gene in the following four categories: 1) within the gene, 2) outside the gene but within 1 kb, 3) from 1 to 10kb from the gene, and 4) from 10 to 100 kb from the gene. We found significant positive correlations for all categories for both ATAC-seq and CUT&RUN, except for ATAC-seq peaks 10 to 100 kb from their nearest venom gene. We found the same pattern of significance when using only the peak with the largest magnitude of change for each gene for each peak category to address RNA-seq data nonindependence. (C) Proportional z-scores of DE–DA bias agreement from ATAC-seq, ordered from most supported scenario to least. Positive values represent DE–DA overlap scenarios occurring more than all other venom peak scenarios, and negative values represent DE–DA overlap scenarios occurring less than all other venom peak scenarios. The highest z-scores reflect a strong preference for matching ontogenetic DE–DA combinations. Peaks are classified based on positional relation to genes, ontogenetic DE bias of the gene, and ontogenetic DA bias of the peak. Proportions were calculated using total bp counts for each venom peak classification compared to all other venom peaks. (D) Proportional z-scores of DE-DA bias agreement from CUT&RUN, mirroring the layout shown in panel C for ATAC-seq. The CUT&RUN z-scores show overall agreement with ATAC-seq, with the highest z-scores depicting a strong preference for matching ontogenetic DE-DA combinations.
Fig. 6.
Fig. 6.
Presence and absence of Bhlhe40 binding motifs in two rattlesnake species. (A) Crotalus atrox does not show a drastic ontogenetic shift in venom phenotype as does C. adamanteus (SI Appendix, Figs. S22 and S23). Comparing binding motif presence and absence between the two species supports our hypothesis that Bhlhe40 functions as a transcriptional repressor for SVMP gene mdc-3a in adult C. adamanteus. (B) An example of apparent Bhlhe40 motif loss/gain by means of five nucleotide changes.

Comment in

  • Coming of age in venom research.
    Rodríguez de la Vega RC. Rodríguez de la Vega RC. Proc Natl Acad Sci U S A. 2024 May 7;121(19):e2405708121. doi: 10.1073/pnas.2405708121. Epub 2024 Apr 30. Proc Natl Acad Sci U S A. 2024. PMID: 38687800 Free PMC article. No abstract available.

References

    1. Levine M., Davidson E. H., Gene regulatory networks for development. Proc. Natl. Acad. Sci. U.S.A. 102, 4936–4942 (2005). - PMC - PubMed
    1. Erwin D. H., Davidson E. H., The evolution of hierarchical gene regulatory networks. Nat. Rev. Genet. 10, 141–148 (2009). - PubMed
    1. Hoekstra H. E., Coyne J. A., The locus of evolution: Evo devo and the genetics of adaptation. Evolution 61, 995–1016 (2007). - PubMed
    1. Carroll S. B., Evo-devo and an expanding evolutionary synthesis: A genetic theory of morphological evolution. Cell 134, 25–36 (2008). - PubMed
    1. Barrier M., Robichaux R. H., Purugganan M. D., Accelerated regulatory gene evolution in an adaptive radiation. Proc. Natl. Acad. Sci. U.S.A. 98, 10208–10213 (2001). - PMC - PubMed

Substances

Supplementary concepts

LinkOut - more resources