. 2024 Apr 5;10(14):eadk8093.
doi: 10.1126/sciadv.adk8093. Epub 2024 Apr 5.

Multi-omics analysis reveals that linoleic acid metabolism is associated with variations of trained immunity induced by distinct BCG strains

Affiliations

Multi-omics analysis reveals that linoleic acid metabolism is associated with variations of trained immunity induced by distinct BCG strains

Jin-Chuan Xu et al. Sci Adv. .

Abstract

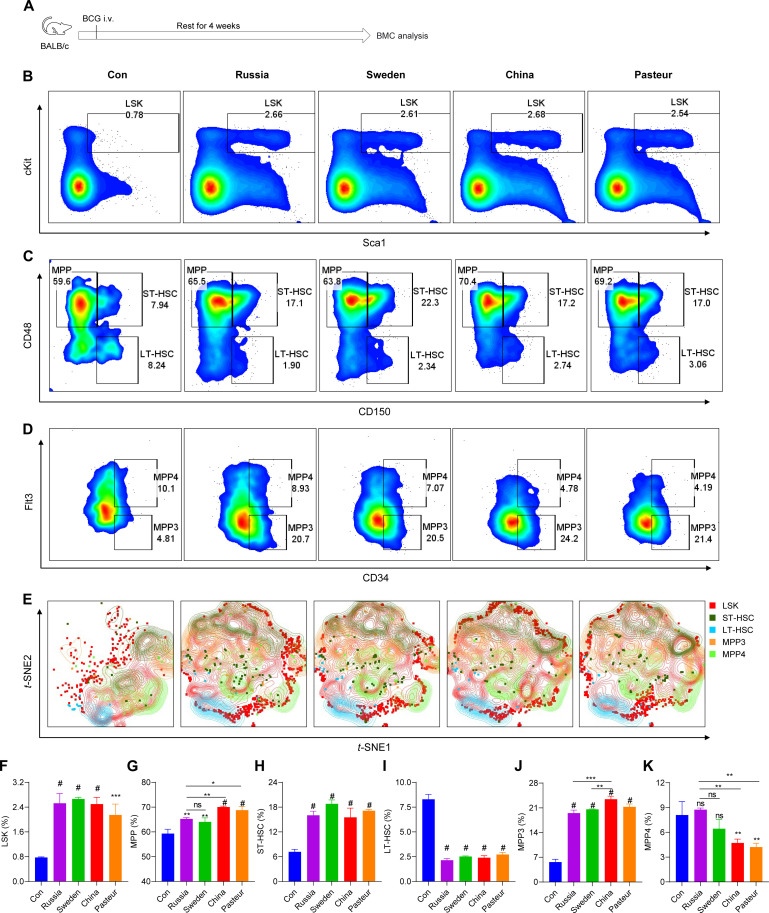
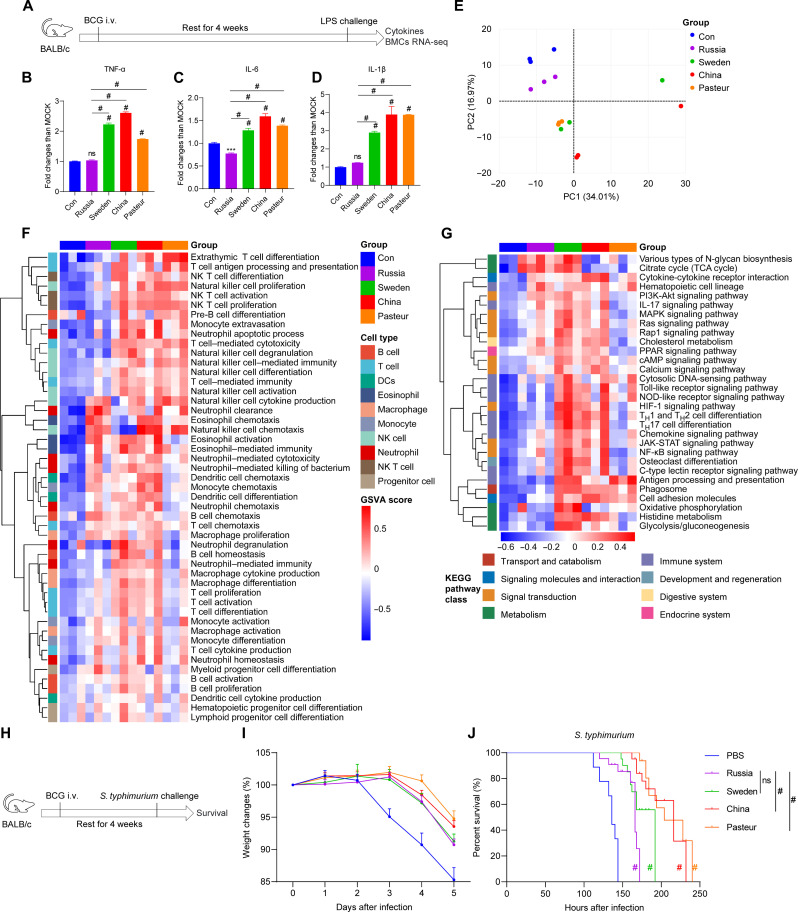
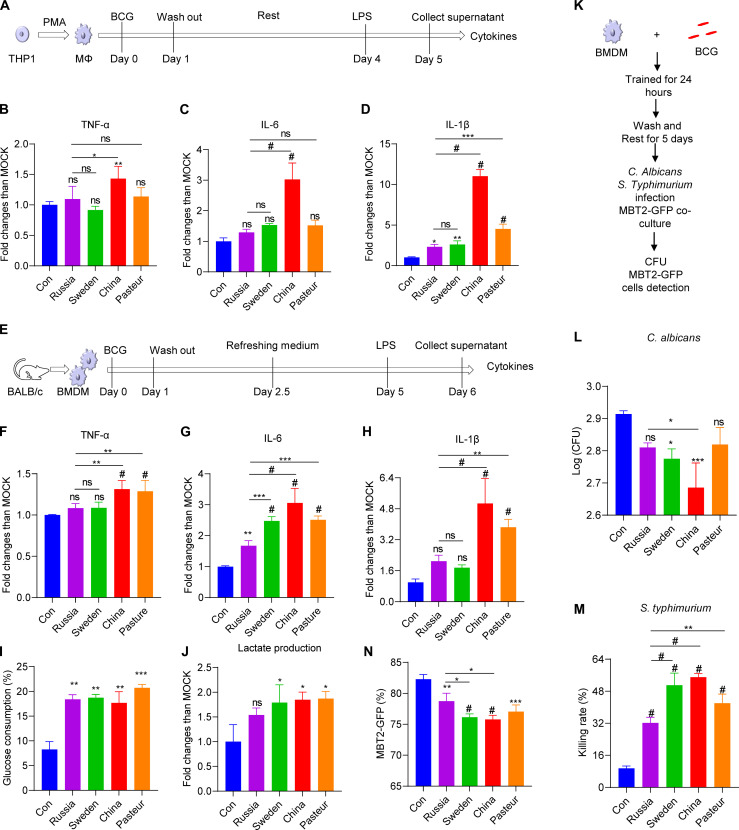
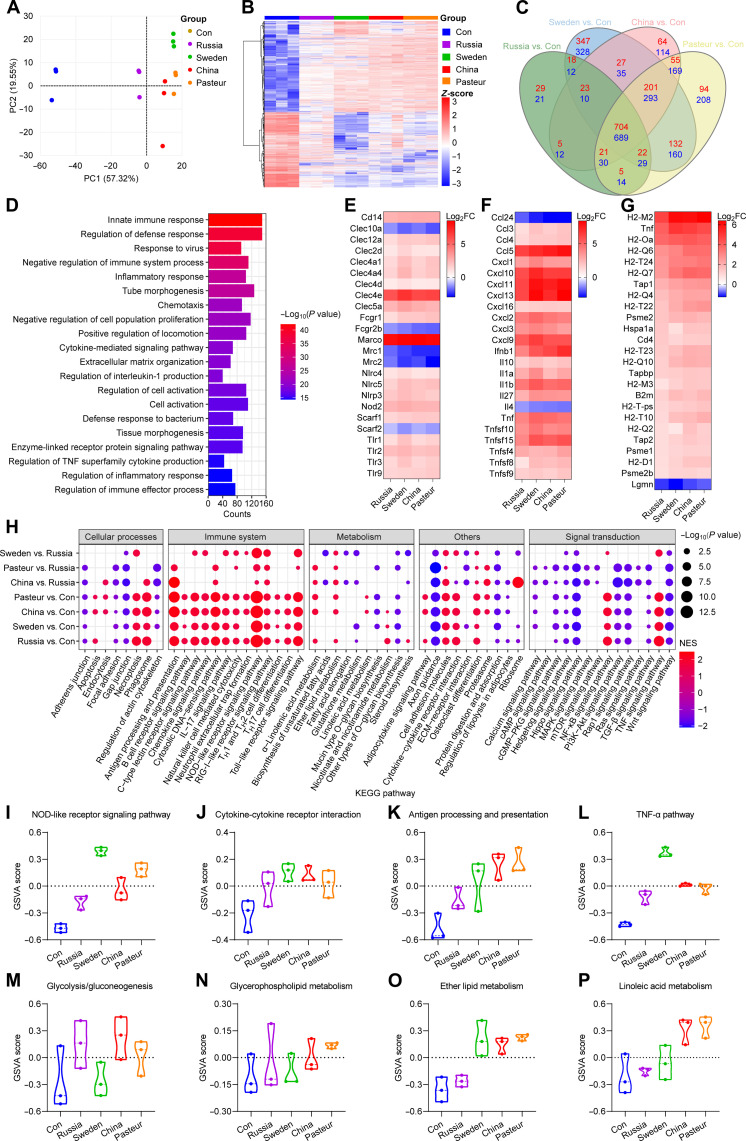
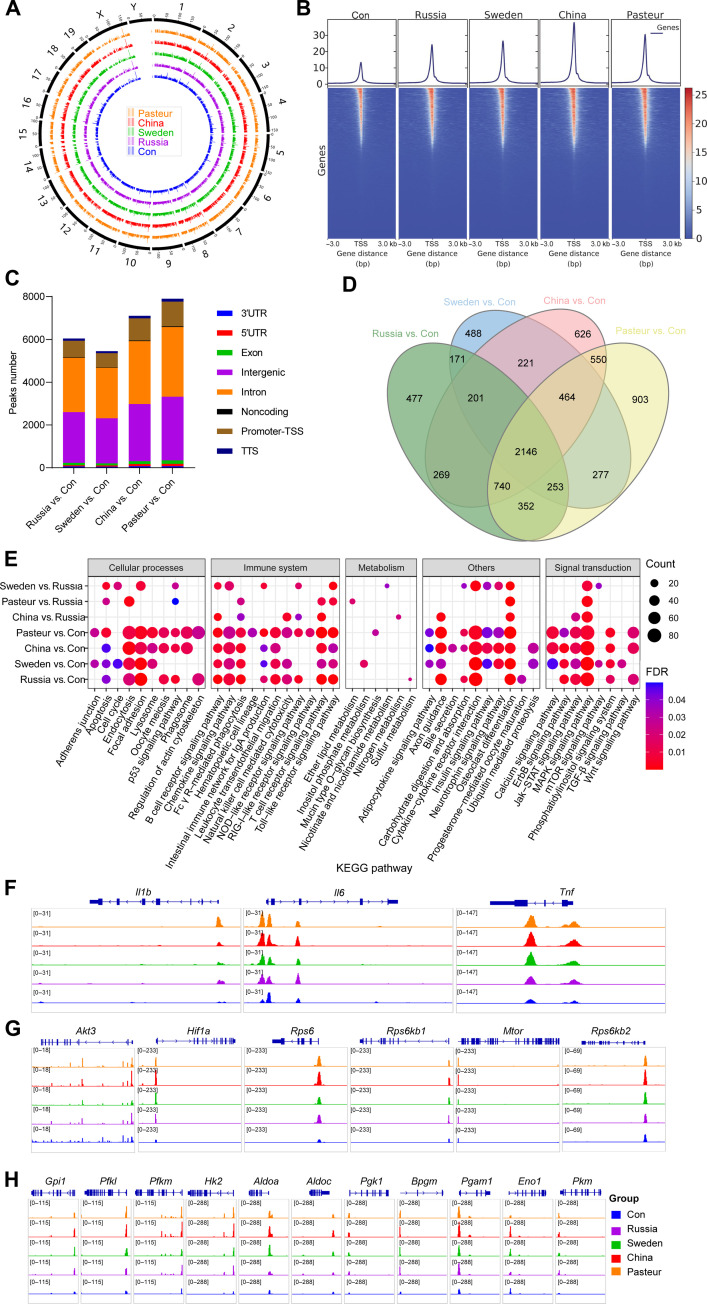
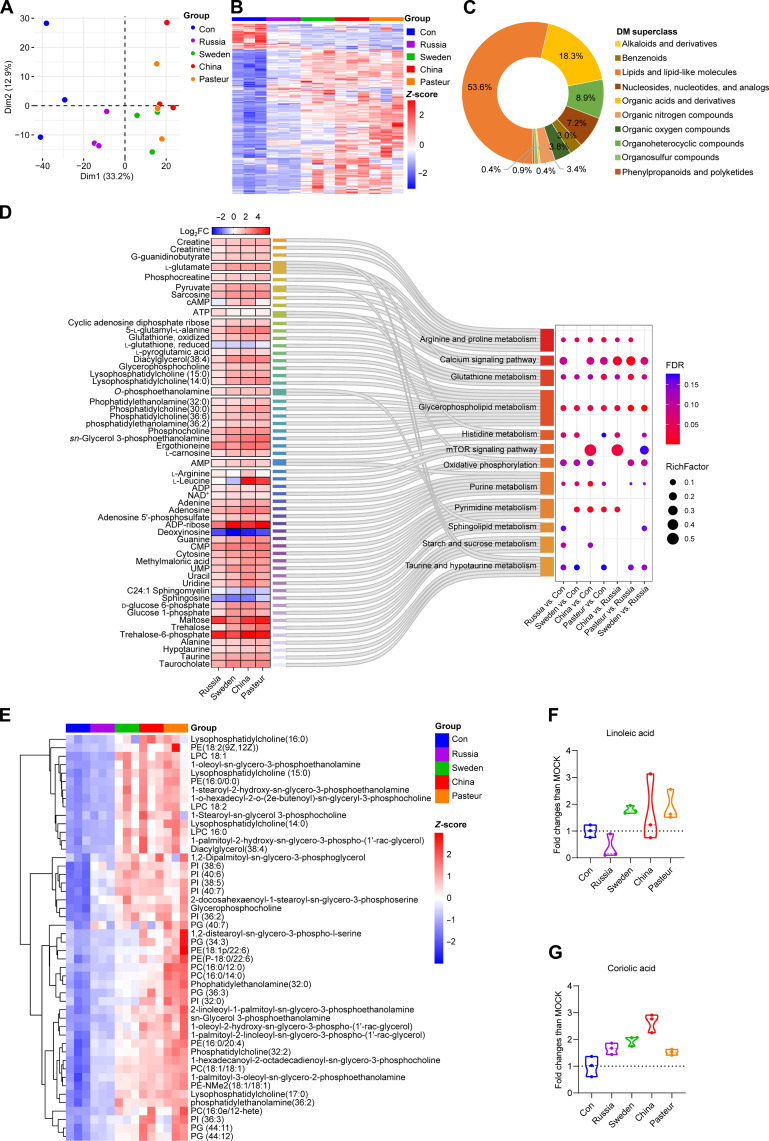
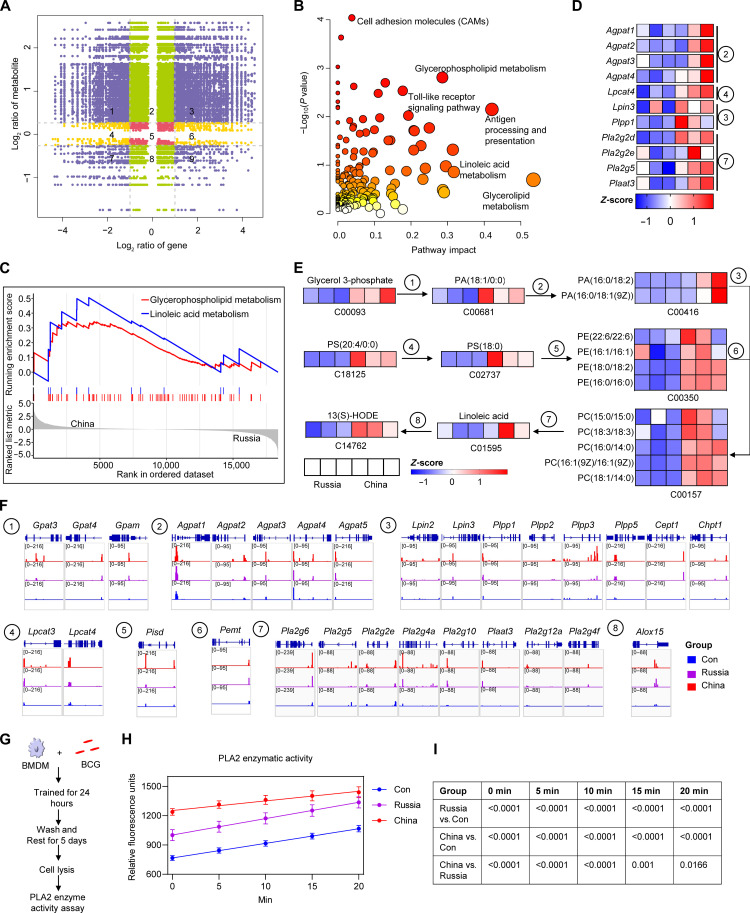
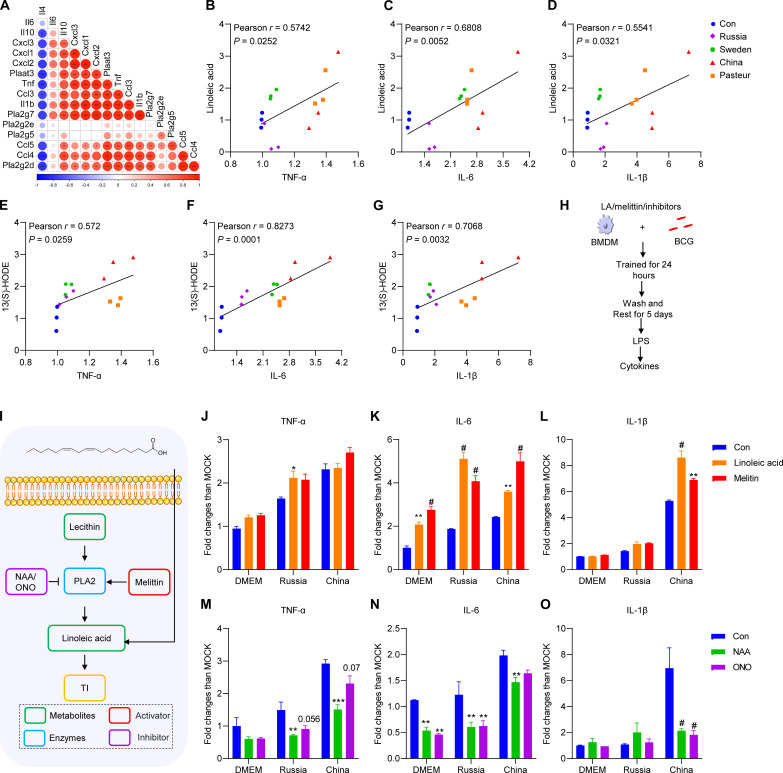
Trained immunity is one of the mechanisms by which BCG vaccination confers persistent nonspecific protection against diverse diseases. Genomic differences between the different BCG vaccine strains that are in global use could result in variable protection against tuberculosis and therapeutic effects on bladder cancer. In this study, we found that four representative BCG strains (BCG-Russia, BCG-Sweden, BCG-China, and BCG-Pasteur) covering all four genetic clusters differed in their ability to induce trained immunity and nonspecific protection. The trained immunity induced by BCG was associated with the Akt-mTOR-HIF1α axis, glycolysis, and NOD-like receptor signaling pathway. Multi-omics analysis (epigenomics, transcriptomics, and metabolomics) showed that linoleic acid metabolism was correlated with the trained immunity-inducing capacity of different BCG strains. Linoleic acid participated in the induction of trained immunity and could act as adjuvants to enhance BCG-induced trained immunity, revealing a trained immunity-inducing signaling pathway that could be used in the adjuvant development.


Figures

Fig. 1.
Fig. 1.. BCG vaccination induced HSC expansion.
(A) Schema of the in vivo trained immunity experiments for bone marrow cell (BMC) analysis. i.v., intravenous. (B) Representative fluorescence-activated cell sorting (FACS) plots of LKS+ cells in bone marrow of phosphate-buffered saline (PBS)–vaccinated (Con) or BCG-vaccinated BALB/c mice after 4 weeks. (C) Representative FACS plots of multipotent progenitor (MPP) cells, short-term HSCs (ST-HSCs), and long-term HSCs (LT-HSCs) in bone marrow of PBS-vaccinated (Con) or BCG-vaccinated BALB/c mice after 4 weeks. (D) Representative FACS plots of MPP3 and MPP4 cells in bone marrow of PBS-vaccinated (Con) or BCG-vaccinated BALB/c mice after 4 weeks. (E) The t-distributed stochastic neighbor embedding (t-SNE) analysis of LSK cells in normalized Lin cells. Files containing Lin cells were down sampled without replacement using the FlowJo DownSample plugin and concatenated to ∼170,000 events suitable for t-SNE analysis. (F) The proportion of LSK cells in Lin cells. (G) The proportion of MPP cells in LSK cells. (H) The proportion of ST-HSCs in LSK cells. (I) The proportion of LT-HSCs in LSK cells. (J) The proportion of MPP3 cells in MPP cells. (K) The proportion of MPP4 cells in MPP cells. Data represent means ± SD of three independent biological duplicates. One-way analysis of variance (ANOVA) test was used for comparisons between groups: ns, not significant; *P < 0.05; **P < 0.01; ***P < 0.001; #P < 0.0001.
Fig. 2.
Fig. 2.. Four BCG strains induced various levels of cytokines and nonspecific protection in vivo.
(A) Schema of the in vivo trained immunity experiments. (B to D) Cytokine levels in the serum of trained mice upon lipopolysaccharide (LPS) restimulation. MOCK, mean of the control group. Values are expressed as means ± SD. For (B) to (D), data are representative of three independent experiments with three biological duplicates. (E) Principal components analysis (PCA) of the global genes in BMCs. (F) gene set variation analysis (GSVA) of gene ontology biological process (GOBP) related to immune cell development and function. NK, natural killer. (G) GSVA of KEGG pathway related to immune cell metabolism and function. For (E) to (G), data represent means ± SD of three independent biological duplicates. TCA, tricarboxylic acid; MAPK, mitogen-activated protein kinase; PPAR, peroxisome proliferator–activated receptor; cAMP, cyclic adenosine 3′,5′-monophosphate; JAK-STAT, Janus kinase–signal transducer and activator of transcription. (H) Schema of S. typhimurium challenge infection. (I) Changes in the body weight of S. typhimurium–infected mice within 5 days. (J) Survival curves of infected mice, n = 9. PBS, control group. Survival curve was analyzed using log-rank (Mantel-Cox) test: ns, P > 0.05; #P < 0.0001.
Fig. 3.
Fig. 3.. Four BCG strains induced various degrees of cytokines and nonspecific protection in vitro.
(A) Schematic diagram of trained immunity in THP1–differentiated macrophages. (B to D) Cytokine profiles in control and trained THP1 macrophages upon LPS restimulation. (E) Schematic diagram of trained immunity in BMDMs. (F to H) Cytokine profiles in control and trained BMDMs upon LPS restimulation. (I) Glucose consumption of BCG-trained BMDMs upon LPS stimulation. (J) Lactate production of BCG-trained BMDMs upon LPS stimulation. (K) Schematic diagram of nonspecific protection against infection in BMDMs. (L) Total colony-forming units (CFU) of C. albicans quantified after 4 hours of infection. (M) Intracellular killing of S. typhimurium 2 hours after phagocytosis by trained BMDMs. (N) The proportion of MBT2-GFP cells cocultured with BCG-trained BMDMs. One-way ANOVA test was used to compare groups: *P < 0.05; **P < 0.01; ***P < 0.001; #P < 0.0001. Values are expressed as means ± SD. Data are representative of three independent experiments with three replicates.
Fig. 4.
Fig. 4.. Transcriptome characteristics of BMDMs after BCG training.
(A) PCA of the global gene changes. (B) Heatmap of pooled differentially expressed genes (DEGs) [adjusted P < 0.05, log2 fold change (log2FC) > 1] between BCG-trained groups and Con group. (C) Venn diagram of DEGs between Russia versus Con, Sweden versus Con, China versus Con, and Pasteur versus Con groups. (D) Top 20 GOBP pathway of 1393 shared DEGs in (C). (E) Heatmap of genes involved in phagocytosis and cell activation. (F) Heatmap of cytokines and chemokines genes. (G) Heatmap of genes involved in antigen processing and presentation. (H) Heatmap comparison of gene set enrichment analysis (GSEA) results (P < 0.05) among BCG-trained groups. NES, Normalized enrichment score; ECM, extracellular matrix; cGMP, cyclic guanosine 3′,5′-monophosphate. (I to L) Violin plots of the GSVA of factors involved in cell activation and inflammation. (M to P) Violin plots of the GSVA of pathways involved in cell metabolism. Data represent means ± SD of three independent biological duplicates.
Fig. 5.
Fig. 5.. The epigenetic landscape of BMDM cells after BCG training.
(A) Genome-wide chromatin accessibility of trained BMDMs. (B) Heatmaps of differential assay for transposase accessible chromatin (ATAC) peak (P < 0.05) densities at transcriptional start site (TSS) regions. bp, base pairs. (C) Differential ATAC peak distributions on gene loci. 3′UTR, untranslated region; 5′UTR, untranslated region; TTS, transcription termination site. (D) Venn diagram of genes with differential ATAC peaks. (E) Heatmap comparison between BCG-trained groups, KEGG enrichment results of genes with differential ATAC peaks [false discovery rate (FDR) < 0.05]. (F) ATAC signals of Il1b, Il6, and Tnf gene. (G) ATAC signals of genes involved in the HIF-1 signaling pathway. (H) ATAC signals of genes involved glycolysis. Data represent three independent biological duplicates.
Fig. 6.
Fig. 6.. Metabolic profiles of BMDMs after BCGs training.
(A) PCA plot of the qualitative metabolite changes. (B) Heatmap of pooled DMs (VIP > 1, P < 0.05) between BCG-trained groups and control group. (C) DM classification donut chart. (D) KEGG enrichment results of DMs (VIP > 1, P < 0.05). ATP, adenosine 5′-triphosphate; NAD+, nicotinamide adenine dinucleotide (oxidized form); UMP, uridine 5′-monophosphate. (E) Heatmap of differentially expressed glycerophospholipids (VIP > 1, P < 0.05, |log2FC| ≥ 1). (F) Relative abundance of linoleic acid identified by liquid chromatography–tandem mass spectrometry (LC-MS/MS). (G) Relative abundance of coriolic acid identified by LC-MS/MS. Data represent means ± SD of three independent biological duplicates.
Fig. 7.
Fig. 7.. Comparative multi-omics analysis of the high (China) and low (Russia) trained immunity groups.
(A) Nine quadrant charts of mRNA expression ratios and metabolite expression ratios between BCG-China and BCG-Russia groups. Purple dots, significant changes in both metabolite (DMs: VIP > 1, P < 0.05, |log2FC| > 0.26) and mRNA (DEGs: adjusted P value < 0.05, |log2FC| > 1); green dots, significant changes in metabolite only; yellow dots, significant changes in mRNA only. (B) Integrated analysis of metabolites and genes in part 3 of (A). (C) GSEA enrichment plot of glycerophospholipid and linoleic acid metabolic pathways of BCG-China versus BCG-Russia. (D) Heatmap of genes involved in glycerophospholipid and linoleic acid metabolism. (E) Glycerophospholipid and linoleic acid metabolic pathways with a heatmap of normalized data. Blue and red colors represent low and high concentrations, respectively, scaled by color intensity. (F) ATAC signals of genes involved in glycerophospholipid metabolism and linoleic acid metabolism. ① to ⑧: Genes involved in glycerophospholipid and linoleic acid metabolism. (G) Schematic diagram of PLA2 enzyme activity assay in BCG-trained BMDMs. (H) PLA2 enzymatic activity was shown as relative fluorescence units with time. Data represent means ± SD of five independent biological duplicates. (I) The table shows the P values (one-way ANOVA) for each time point in (H).
Fig. 8.
Fig. 8.. Linoleic acid metabolism enhanced BCG-induced trained immunity.
(A) Correlation between cytokines genes and PLA2 genes. (B) Correlation between TNF-α fold change and linoleic acid fold change. (C) Correlation between IL-6 fold change and linoleic acid fold change. (D) Correlation between IL-1β fold change and linoleic acid fold change. (E) Correlation between TNF-α fold change and 13(S)-HODE fold change. (F) Correlation between IL-6 fold change and 13(S)-HODE fold change; (G) Correlation between IL-1β fold change and 13(S)-HODE fold change. Correlations were performed using Spearman correlation analysis. (H) Schematic diagram of trained immunity supplementation with linoleic acid (LA) and melittin. (I) Schematic diagram of glycerophospholipid–linoleic acid metabolism. (J to L) Cytokines of BCG-trained BMDMs supplementation with linoleic acid (10 μM) and melittin (0.25 μg/ml) upon LPS restimulation. (M to O) Cytokines of BCG-trained BMDMs supplementation with ONO-RS-082 (ONO; 50 μM) and 1-naphthylacetic acid (NAA; 50 μM) upon LPS restimulation. Data represent means ± SD of three independent biological duplicates. Data are representative of two independent experiments. Two-way ANOVA was used to compare groups; *P < 0.05; **P < 0.01; ***P < 0.001; #P < 0.0001.

References

    1. Netea M. G., Joosten L. A. B., Latz E., Mills K. H. G., Natoli G., Stunnenberg H. G., O’Neill L. A. J., Xavier R. J., Trained immunity: A program of innate immune memory in health and disease. Science 352, aaf1098 (2016). - PMC - PubMed
    1. Fanucchi S., Domínguez-Andrés J., Joosten L. A. B., Netea M. G., Mhlanga M. M., The intersection of epigenetics and metabolism in trained immunity. Immunity 54, 32–43 (2021). - PubMed
    1. Cheng S.-C., mTOR- and HIF-1 alpha-mediated aerobic glycolysis as metabolic basis for trained immunity. Science 345, 1579 (2014). - PMC - PubMed
    1. Hu Z., Lu S. H., Lowrie D. B., Fan X. Y., Trained immunity: A Yin-Yang balance. MedComm 3, e121 (2022). - PMC - PubMed
    1. Whittaker E., Goldblatt D., McIntyre P., Levy O., Neonatal immunization: Rationale, current state, and future prospects. Front. Immunol. 9, 532 (2018). - PMC - PubMed

Publication types