. 2024 Apr 5;10(14):eadm7506.
doi: 10.1126/sciadv.adm7506. Epub 2024 Apr 5.

Cellular atlas of the human ovary using morphologically guided spatial transcriptomics and single-cell sequencing

Affiliations

Cellular atlas of the human ovary using morphologically guided spatial transcriptomics and single-cell sequencing

Andrea S K Jones et al. Sci Adv. .

Abstract

The reproductive and endocrine functions of the ovary involve spatially defined interactions among specialized cell populations. Despite the ovary's importance in fertility and endocrine health, functional attributes of ovarian cells are largely uncharacterized. Here, we profiled >18,000 genes in 257 regions from the ovaries of two premenopausal donors to examine the functional units in the ovary. We also generated single-cell RNA sequencing data for 21,198 cells from three additional donors and identified four major cell types and four immune cell subtypes. Custom selection of sampling areas revealed distinct gene activities for oocytes, theca, and granulosa cells. These data contributed panels of oocyte-, theca-, and granulosa-specific genes, thus expanding the knowledge of molecular programs driving follicle development. Serial samples around oocytes and across the cortex and medulla uncovered previously unappreciated variation of hormone and extracellular matrix remodeling activities. This combined spatial and single-cell atlas serves as a resource for future studies of rare cells and pathological states in the ovary.


Figures

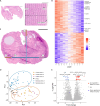
Fig. 1.
Fig. 1.. ST analysis of the human ovary.
(A) An illustrated summary of ROI types (all diagrams created with biorender.com). We used the histological image of an adjacent whole-ovary tissue section to select ROIs to represent 19 functional types of local cell communities. (B) Hematoxylin and eosin (H&E) (top) and immunofluorescent (IF) images (bottom) of fixed tissue sections from donor 1. Left, whole tissue section. Right, zoomed-in view of an antral follicle. Gray, green, and yellow colors indicate SYTO82, SMA, and CD68 staining signals, respectively. Scale bars, 2.5 mm (left) and 200 μm (right). (C) H&E and IF images of fixed tissue sections from donor 2, in the same scale and layout as in (B), except that SMA was not used, and red indicates DAZL signal. Black arrow indicates ovarian cyst; white arrows indicate DAZL expression in primordial/primary follicles. (D and E) PC plots (PC1 and PC2) of the 74 ROIs from donor 1 (D) and 165 ROIs from donor 2 (E), colored by the clusters identified. (F) Annotation of the observed clusters by their mapping to the predefined ROI types. Sample number cross-tabulation between the 19 ROI types (rows) and the 6 and 9 clusters (columns) in the two donors is shown. The major categories of ROI types and their mapped clusters are highlighted by color: orange, cortex; blue, medulla; yellow, theca; green, granulosa; purple, oocytes. **ROI segments sampled as DAZL+. *ROI segments without DAZL antibody localization.
Fig. 2.
Fig. 2.. Transcriptional signature of human oocytes.
(A) Process of antibody-guided sample collection from subareas of an ROI. In this example, after the sample in DAZL+ area (shown in orange) is collected by photo-activated cleavage, the sample in the remaining areas of the ROI (DAZL, shown in purple) is collected in a second step, yielding a pair of samples from a single ROI. Created using biorender.com. (B) Expression pattern of four previously known canonical oocyte marker genes across the nine clusters in donor 2, where the y axis is log(CPM) for all panels. (C) Expression of four of previously unreported marker genes, where the y axis is log(CPM) for all panels. (D) Expression specificity of the 76 oocyte marker genes (in rows) compared across, from left to right, 74 samples from donor 1 ordered by the 6 clusters, and 165 samples from donor 2 ordered by the 9 clusters (data S5). Genes shown in (B) and (C), along with additional genes of interest, are indicated on the heatmap. Per-gene standardization and color scale are explained in Materials and Methods.
Fig. 3.
Fig. 3.. Robust signatures of granulosa and theca cells.
(A) Focused PCA of the 5 theca-enriched ROIs and 11 granulosa-enriched ROIs from donor 1, showing their separation into two clusters. (B) Similar PC plot for 6 theca and 18 granulosa ROI samples from donor 2. (C) Expression specificity of the 94 granulosa cell maker genes (top) and the 45 theca cell marker genes (bottom), compared across the 74 and 165 samples from the two donors, ordered by clusters in the same way as in Fig. 2D (data S5). Color scale explained in Materials and Methods. (D) Four concentric ring-shaped ROIs, for cumulus granulosa regions surrounding the oocyte in an antral follicle from donor 1 (scale bar, 100 μm). Purple denotes the oocyte in an antral follicle (“Oo”), while green denotes the four concentric rings of cumulus granulosa cells. (E) Regression analysis over the ordered series of four ROIs in (D) identified 1407 DE genes (P < 0.05), shown as a heatmap of genes (in rows) across the four samples. Color scale explained in Materials and Methods.
Fig. 4.
Fig. 4.. Transcriptional heterogeneity across cortex and medulla areas.
(A) In donor 1, a series of 11 consecutive tissue layers were sampled at the surface of the cortex, each with 30-μm depth and 350-μm width (scale bar, 2.5 mm; scale bar for inset, 100 μm). H&E image is shown. (B) Linear regression analysis over the 11 ordered samples identified 313 differentially expressed genes (P < 0.05), shown as a heatmap, with notable genes indicated to the right. Color scale explained in Materials and Methods. (C) Five straight-line series of 15 to 16 consecutive samples for donor 2, three for cortex regions (three warm colors) and two traversing the medulla (two blue colors), indicated on the H&E image (scale bar, 2.5 mm). (D) PC1 to PC3 plots of the three cortex and two medulla series, each with 15 to 16 samples, plus the nine DAZL subareas near the follicles. The six series are shown in different colors. (E) Comparison between the nine DAZL near-follicle ROIs and the three surface-most cortex ROIs, one from each of the three cortex series, identified genes that are significantly (FDR < 0.05) higher (red, n = 33) and lower (blue, n = 21) in follicle-rich cortex versus cortex without follicles. The “volcano plot” of fold change (x axis) and negative logged FDR (y axis) is shown.
Fig. 5.
Fig. 5.. Cell types in the human ovary identified by scRNA-seq analysis.
(A) t-SNE projection of 6339 cells from donor 5 colored by the four major cell types identified. (B) UMAP projection of immune cells (n = 863 from three donors) colored by the four immune cell subtypes identified. (C) Known marker genes used to annotate the three major cell types and four immune cell subtypes. Color indicates expression level, while symbol size indicates detection rate. (D) Centroid data for marker genes for the three major cell types and four immune cell subtypes. Number of genes displayed: stroma, 119; pericyte, 92; endothelial, 120; mast cell, 3; macrophage, 3; T cell, 9; NK cell, 19 (data S6 and S7). Additional literature-based marker genes are indicated on the right. Color scale explained in Materials and Methods.

References

    1. K. Hummitzsch, H. F. Irving-Rodgers, J. Schwartz, R. J. Rodgers, Development of the mammalian ovary and follicles, in The Ovary (Elsevier, 2019), pp. 71–82.
    1. O’Neill K. E., Maher J. Y., Laronda M. M., Duncan F. E., LeDuc R. D., Lujan M. E., Oktay K. H., Pouch A. M., Segars J. H., Tsui E. L., Zelinski M. B., Halvorson L. M., Gomez-Lobo V., Anatomic nomenclature and 3-dimensional regional model of the human ovary: Call for a new paradigm. Am. J. Obstet. Gynecol. 228, 270–275.e4 (2023). - PMC - PubMed
    1. D. L. Russell, R. L. Robker, Ovulation: The coordination of intrafollicular networks to ensure oocyte release, in The Ovary (Elsevier, 2019), pp. 217–234.
    1. Kinnear H. M., Tomaszewski C. E., Chang F. L., Moravek M. B., Xu M., Padmanabhan V., Shikanov A., The ovarian stroma as a new frontier. Reproduction 160, R25–R39 (2020). - PMC - PubMed
    1. Jones A. S. K., Shikanov A., Follicle development as an orchestrated signaling network in a 3D organoid. J. Biol. Eng. 13, 2 (2019). - PMC - PubMed

Publication types