. 2024 Apr 5;10(14):eadl4600.
doi: 10.1126/sciadv.adl4600. Epub 2024 Apr 5.

Adaptive functions of structural variants in human brain development

Affiliations

Adaptive functions of structural variants in human brain development

Wanqiu Ding et al. Sci Adv. .

Abstract

Quantifying the structural variants (SVs) in nonhuman primates could provide a niche to clarify the genetic backgrounds underlying human-specific traits, but such resource is largely lacking. Here, we report an accurate SV map in a population of 562 rhesus macaques, verified by in-house benchmarks of eight macaque genomes with long-read sequencing and another one with genome assembly. This map indicates stronger selective constrains on inversions at regulatory regions, suggesting a strategy for prioritizing them with the most important functions. Accordingly, we identified 75 human-specific inversions and prioritized them. The top-ranked inversions have substantially shaped the human transcriptome, through their dual effects of reconfiguring the ancestral genomic architecture and introducing regional mutation hotspots at the inverted regions. As a proof of concept, we linked APCDD1, located on one of these inversions and down-regulated specifically in humans, to neuronal maturation and cognitive ability. We thus highlight inversions in shaping the human uniqueness in brain development.


Figures

Fig. 1.
Fig. 1.. Population genetic landscape of 1026 macaque genomes.
(A) Chromosome karyotype showing 40 filled gaps, as indicated by green bars in the rheMac10Plus assembly. The density of genes across the genome is shown in the heatmap. For one of the filled gaps on chromosome 19, the Bionano optical map of one macaque, the long reads of eight macaques, and the coverage of the short reads of 10 macaques (red: Chinese-origin macaques; green: Indian-origin macaques) were aligned and shown accordingly. (B) Sources (inner layer) and geographic origins (outer layer) of the 1026 macaques. (C) Schematic diagram of the workflow for variant calling with a two-round strategy (blue: first round of calling; red: second round of calling). The original set of macaques (1026 animals) and the set after quality control (572 animals) were partitioned into three clusters (red: captive Chinese-origin macaques; yellow: wild-caught Chinese-origin macaques; blue: captive Indian-origin macaques) based on their genetic profiles. The pairs of macaques with significant kinship relationships are linked by lines. (D) Three-dimensional PCA plot showing the relationships of the 572 macaques according to SNV genotypes. (E) Neighbor-joining tree showing the genetic distance of the Chinese-origin macaques. Different data sources are indicated by colored dots in the outer layer. Yellow: M. m. brevicaudatus; blue: M. m. tcheliensis; orange: M. m. littoralis; purple: M. m. lasiotis or M. m. mulatta. (F) The genome-wide distribution of nucleotide diversity of captive Indian-origin macaques (blue), captive Chinese-origin macaques (red), wild-caught Chinese-origin macaques (yellow), and humans (gray).
Fig. 2.
Fig. 2.. Construction and characterization of SV map for macaque population.
(A) The pipeline for SV map construction, including the processes of SV identification, validation, genotyping, SV hotspot definition, and allele frequency calculation. (B) The genomic region of one inversion we identified was shown as an example, with the split reads, poorly paired reads, and the long reads supporting its existence aligned and shown accordingly. (C) The distribution of the count of SVs per macaque genome for three types of SVs in macaques of different origins. The median number of SVs is shown for each group. The total number of reads of deep sequencing for each macaque is also shown. (D) Verification of the SV events with long HiFi reads of eight macaques. Boxplots showing the distribution of the theoretical number of verified SVs at the current sequencing depth of HiFi reads, obtained from 10,000 times of simulations. The detected number of verified SVs in each macaque was indicated by the red dot. (E) Validation of the genotypes of SVs in one macaque based on the long-read sequencing and genome assembly in one macaque. For each type of genotype identified with short reads (0/0, 0/1, or 1/1), the percentages of verified SVs are summarized and shown in different colors. The numbers of SVs of each type are shown, and those with verified genotypes are underlined. (F to H) PCA plots showing the relationships of the 562 macaques according to the genotypes of inversion (F), deletion (G), and duplication (H) variations. Macaques with different origins are labeled with different colors. (I) Site frequency spectra of the derived alleles for inversions and deletions in 562 macaques.
Fig. 3.
Fig. 3.. Inversions in regulatory regions are selectively constrained.
(A) Classification of inversions by different features and genomic locations, including the sizes of the inversions, their locations on the genes, and their three-dimensional genomic architecture. (B) Proportions of inversions at different genomic locations. The background distribution of inversions located in each genomic region, as estimated based on 1000 shuffled regions with matched lengths, is shown in a bar plot, with the error bars representing the standard deviations. For each bar plot, the observed value is indicated as a red dot, with the empirical P value calculated as the percentage of the 1000 replicates. *P < 0.05, ***P < 0.001, N.S., not significant. (C) Site frequency spectra of the derived allele for different classifications of inversions. For each group of inversions, the fraction of inversions with a low frequency of derived alleles (less than 5%) is shown and compared, with the odds ratios shown accordingly.
Fig. 4.
Fig. 4.. Identification and verification of species-specific inversions between humans and macaques.
(A) Circos plot showing the profile of inversions across humans and macaques (HM-INVs), with genomic features aligned according to the coordinates. From the outside to the inside: GC content (%), segmental duplication (SD) density (%), gene density, A/B compartments from fetal cortical plates (CP) and germinal zone (GZ), and the locations of HM-INVs. The average GC contents are indicated by orange lines. Tracks are plotted in 500-kb windows. (B) Overlap between HM-INVs in this study and the public list of species-specific inversions between humans and macaques as defined by in Maggiolini et al. (4) (Strand-seq). (C) Validation of species-specific inversions between humans and macaques with Strand-seq data. For candidate inversions with reads coverage ≥3 in the Strand-seq study, the average numbers of Strand-seq informative reads (Observed) were shown and compared with the background (Background, see details in Materials and Methods), for candidates identified specifically in our study (left), or by both studies (right). Inversions were arranged in descending order of their length. Local regression curves for the average numbers of the informative reads (red) and the background (blue) were shown. Wilcoxon rank-sum tests, ***P < 0.001. (D) Circos plot depicting the arrangement of one complex HM-INV chosen for FISH validation. The track A represents the genomic regions where the probes were designed, with the order of colors indicating the expected form of inversions in humans and macaques based on the definition in this study. Tracks B and C display the forms of these inversions identified by Strand-seq (one large inversion) and in this study (three complex inversions with breakpoint reuse), respectively. (E) Validation of the complex HM-INV in (D) in the macaque LLC-MK2 cell line (left) and human HeLa S3 cell line (right).
Fig. 5.
Fig. 5.. Identification of human-specific inversions.
(A) Schematic illustration (left) of four classes of lineage-specific inversions, including human-specific (Human), Hominoidea-specific (Hominoidea), Cercopithecidae-specific (Cercopithecidae), and macaque-specific (Rhesus) inversions. Heatmap (right) showing the arrangement of HM-INVs in comparison to the estimated ancestral states. HM-INVs are ordered in columns, and each row corresponds to a species based on the phylogeny. Blue: the ancestral allele; red: the derived allele; gray: ambiguous state. The hierarchical clustering of HM-INVs and the lineage specificity annotation for HM-INVs are shown at the top. The log10-transformed length for each HM-INV is shown at the bottom, among which the HM-INVs with lengths >95% quantile are indicated with red triangles. (B) The distribution of the normalized number of improperly aligned, paired-end reads, for different groups of regions. M-INVs: macaque polymorphic inversions with high frequency; HS-INVs: human-specific inversions; Negative Control1 and Negative Control2: two groups of negative controls of shuffled regions (Materials and Methods). The median read number is shown above each boxplot. (C) UpSetR plot showing the number of human-specific inversions that are grouped based on their orientation relative to the reference genome across 18 haplotype assemblies. Blue: alignments concordant with hg38; red: inverted form; gray: ambiguous alignments. Human-specific inversions fixed in the population are highlighted with asterisks. Wilcoxon rank-sum tests, ***P < 0.001. (D) Donut plot showing the classification of 101 candidate human-specific inversions based on their polymorphic states in human and macaque populations.
Fig. 6.
Fig. 6.. Characteristics of human-specific inversions.
(A) Violin plots showing the genetic divergences of fixed human-specific inversions (HSF-INVs) and their length-matched, upstream and downstream genomic regions (Upstream and Downstream regions). Wilcoxon signed rank tests were performed. Wilcoxon signed rank tests, ***P < 0.001. (B) Violin plots showing the genetic divergences of homologous macaque regions of the HSF-INVs and their upstream and downstream regions. Wilcoxon signed rank tests; N.S., not significant. (C) Violin plots showing the genetic divergences of promoter regions in fixed human-specific inversions (HSF-INVs) and promoter regions in length-matched flanking genomic regions (Flanking regions). The red dot indicates promoter of APCDD1. Wilcoxon rank-sum test, ***P < 0.001. (D) Classification of 75 fixed human-specific inversions into two groups with different degree of regulatory effects (Strong and Weak), based on their sizes and locations in the human and macaque genomes. The genetic divergence relative to the human-chimpanzee common ancestor is also shown for the 75 HSF-INVs and corresponding upstream and downstream regions. The difference in the genetic divergence between each inversion and the average of its upstream and downstream regions is also shown (Difference). (E) Violin plots showing the genetic divergence for inversions with strong (Strong) or weak (Weak) effects, and their upstream and downstream regions. One-sided, Wilcoxon rank-sum tests, *P < 0.05, N.S., not significant. (F) The log2-transformed fold changes in gene expression in the fetal brain between humans and macaques, for genes located on inversions with strong (Strong) or weak (Weak) effects, as well as for genome-wide orthologs as a background (Background). Wilcoxon rank-sum tests, *P < 0.05, N.S., not significant.
Fig. 7.
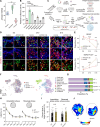
Fig. 7.. A human-specific inversion contributes to human uniqueness in brain development.
(A) Violin plots showing the expressions of APCDD1 in the brains of humans, macaques, and mice at the mid- to late-fetal stages. Wilcoxon rank-sum tests, **P < 0.01. (B) Relative luciferase activities of human APCDD1 promoter (Human), macaque APCDD1 promoter (Macaque), and human APCDD1 promoter with mutations (Mutation-1 to Mutation-5). Student’s t test, **P < 0.01, ***P < 0.001, ****P < 0.0001. (C) The design of experiments for APCDD1 functions. (D) Representative immunostaining of SOX2 (progenitors), TUJ1 (postmitotic neurons), and mCherry (virus-infected cells) in the assays of wild-type NPCs (Control) and NPCs with APCDD1 overexpression (APCDD1 OE), at different protocol days (D5, D10, and D15) after lentiviral infection. White arrowheads, SOX2/TUJ1+ cells. Scale bars, 20 μm. (E) Proportions of SOX2+ progenitors and SOX2/TUJ1+ neurons in Control and APCDD1 OE at different protocol days (D5, D10, and D15). Two-way ANOVA, **P < 0.01, ***P < 0.001. (F) UMAP plots of scRNA-seq from brains of wild-type (WT-1 and WT-2) and Apcdd1+/− mice (Apcdd1+/−-1 and Apcdd1+/−-2) at E10.5, grouped by genotypes (left) or cell types (right). (G) Proportion of each cell type in brains of WT-1, WT-2, Apcdd1+/−-1, and Apcdd1+/−-2. (H) The learning curves of the wild-type (WT, n = 23) and Apcdd1+/− (n = 15) mice in the acquisition and reversal phases. Two-way ANOVA. N.S., not significant. (I) Time spent in the target quadrant by WT and Apcdd1+/− mice in the probe trials after the acquisition and reversal phases. Two-sided Student’s t test, **P < 0.01, N.S., not significant. (J) Representative plots of escape latency for WT and Apcdd1+/− mice in the probe trials after the reversal phase of learning. Data are represented as the means ± SEMs.

Similar articles

Cited by

References

    1. Abel H. J., Larson D. E., Regier A. A., Chiang C., Das I., Kanchi K. L., Layer R. M., Neale B. M., Salerno W. J., Reeves C., Buyske S.; NHGRI Centers for Common Disease Genomics, Matise T. C., Muzny D. M., Zody M. C., Lander E. S., Dutcher S. K., Stitziel N. O., Hall I. M., Mapping and characterization of structural variation in 17,795 human genomes. Nature 583, 83–89 (2020). - PMC - PubMed
    1. Almarri M. A., Bergström A., Prado-Martinez J., Yang F., Fu B., Dunham A. S., Chen Y., Hurles M. E., Tyler-Smith C., Xue Y., Population structure, stratification, and introgression of human structural variation. Cell 182, 189–199.e15 (2020). - PMC - PubMed
    1. Collins R. L., A structural variation reference for medical and population genetics. Nature 581, 444–451 (2020). - PMC - PubMed
    1. Maggiolini F. A. M., Sanders A. D., Shew C. J., Sulovari A., Mao Y., Puig M., Catacchio C. R., Dellino M., Palmisano D., Mercuri L., Bitonto M., Porubský D., Cáceres M., Eichler E. E., Ventura M., Dennis M. Y., Korbel J. O., Antonacci F., Single-cell strand sequencing of a macaque genome reveals multiple nested inversions and breakpoint reuse during primate evolution. Genome Res. 30, 1680–1693 (2020). - PMC - PubMed
    1. Perry G. H., Yang F., Marques-Bonet T., Murphy C., Fitzgerald T., Lee A. S., Hyland C., Stone A. C., Hurles M. E., Tyler-Smith C., Eichler E. E., Carter N. P., Lee C., Redon R., Copy number variation and evolution in humans and chimpanzees. Genome Res. 18, 1698–1710 (2008). - PMC - PubMed

Publication types