. 2024 Apr 5;103(14):e37590.
doi: 10.1097/MD.0000000000037590.

ALYREF m5C RNA methylation reader predicts bladder cancer prognosis by regulating the tumor immune microenvironment

Affiliations

ALYREF m5C RNA methylation reader predicts bladder cancer prognosis by regulating the tumor immune microenvironment

Wengu Pan et al. Medicine (Baltimore). .

Abstract

Background: 5-Methylcytidine (m5C) methylation is a recently emerging epigenetic modification that is closely related to tumor proliferation, occurrence, and metastasis. This study aimed to investigate the clinicopathological characteristics and prognostic value of m5C regulators in bladder cancer (BLCA), and their correlation with the tumor immune microenvironment.

Methods: Thirteen m5C RNA methylation regulators were analyzed using RNA-sequencing and corresponding clinical information obtained from the TCGA database. The Cluster Profiler package was used to analyze the gene ontology function of potential targets and enriched the Kyoto Encyclopedia of Genes and Genomes pathway. Kaplan-Meier survival analysis was used to compare survival differences using the log-rank test and univariate Cox proportional hazards regression. The correlation between signature prognostic m5C regulators and various immune cells was analyzed. Univariate and multivariate Cox regression analyses identified independence of the ALYREF gene signature.

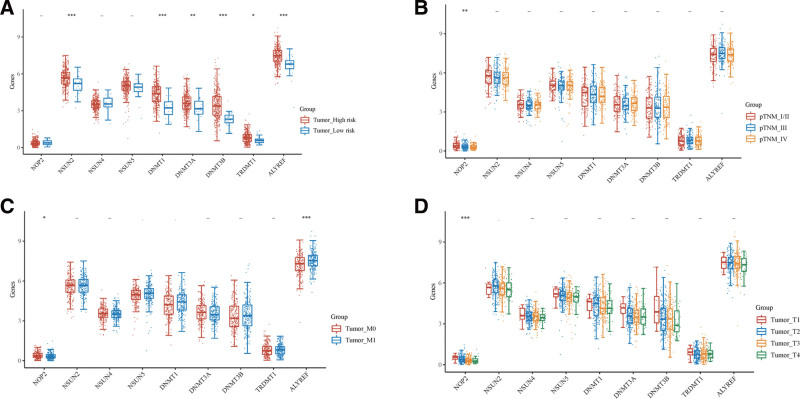
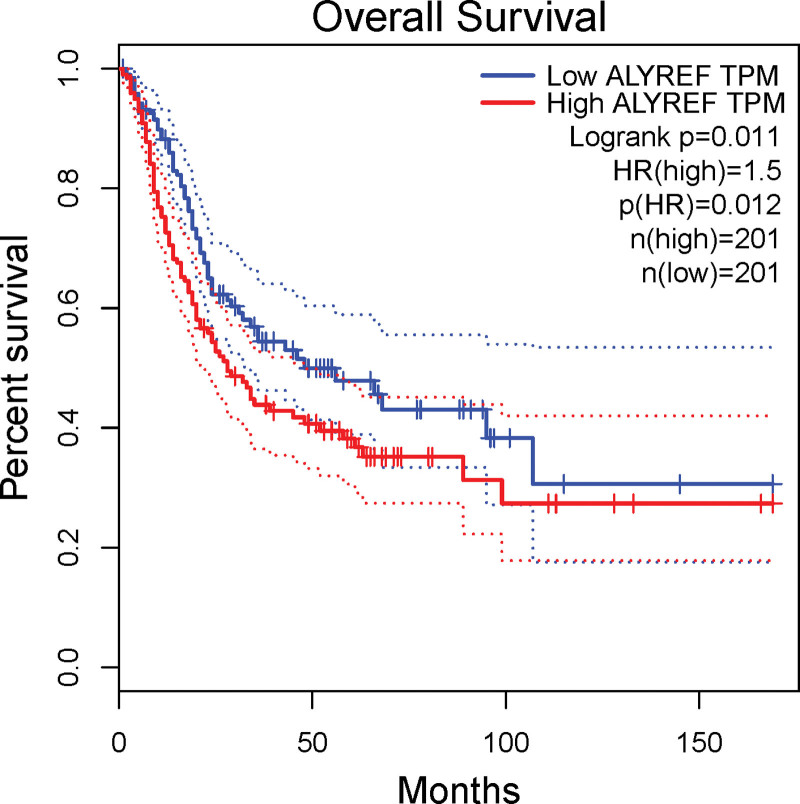
Results: Nine out of the 13 m5C RNA methylation regulators were differentially expressed in BLCA and normal samples and were co-expressed. These 9 regulators were associated with clinicopathological tumor characteristics, particularly high or low tumor risk, pT or pTNM stage, and migration. Consensus clustering analysis divides the BLCA samples into 4 clusters. Kyoto Encyclopedia of Genes and Genomes (KEGG) pathway enrichment annotation and gene ontology function analysis identified 273 upregulated and 594 downregulated genes in BLCA. Notably, only ALYREF was significantly correlated with OS (P < .05). ALYREF exhibited significant infiltration levels in macrophage cells. Therefore, we constructed a nomogram for ALYREF as an independent prognostic factor. Additionally, we observed that both the mRNA and protein levels of ALYREF were upregulated, and immunofluorescence showed that ALYREF was mainly distributed in nuclear speckles. ALYREF overexpression was significantly associated with poor OS.

Conclusion: Our findings demonstrated the potential of ALYREF to predict clinical prognostic risks in BLCA patients and regulate the tumor immune microenvironment. As such, ALYREF may serve as a novel prognostic indicator in BLCA patients.


Conflict of interest statement

The authors have no funding and conflicts of interest to disclose.

Figures

Figure 1.
Figure 1.
The expression of m5C genes and its correlations in BLCA and normal samples. In (A), the abscissa represents m5C genes, and the ordinate represents the expression distribution of gene. The statistical difference of 2 groups was compared through the Wilcox test. In (B), a heatmap shows the correlation in 9 m5C genes. The abscissa and ordinate represent genes, different colors represent different correlation coefficients (blue represents positive correlation whereas red represents negative correlation), the darker the color, the stronger the relation. *P < .05, **P < .01, ***P < .001 stand for significance levels.
Figure 2.
Figure 2.
The expression of 9 m5C genes in different clinicopathology characteristic of BLCA. The abscissa represents the genes, and the ordinate represents the expression distribution of these genes. The statistical difference of 2 groups was compared through the Wilcox test, significance difference of 3 groups was tested with Kruskal–Wallis test. Different colors represent different groups, top represents the significance P value, *P < .05, **P < .01, ***P < .001.
Figure 3.
Figure 3.
Consensus clustering cumulative distribution function (CDF) and relative change in the area under the CDF curve. The relative change in area under the CDF curves when cluster number varying from k − 1 to 6. The abscissa represents category number 4, and the ordinate represents the relative change in the area. Consistency of clustering results heatmap (k = 4), Rows and columns represent samples, and the different colors represent different types. And the expression heatmap of 9 m5C genes in different subgroups, red represents high expression, and blue represents low expression. Kaplan–Meier survival analysis of the different groups was from TCGA by log-rank test. HR (95%Cl), the median survival time (LT50) for different groups.
Figure 4.
Figure 4.
Screening differentially expressed genes between m5C subtypes and functional analysis. (A) In Volcano plot, the volcano plot was constructed using the fold change values and P-adjust. Red dots indicate upregulated genes; blue dots indicate downregulated genes; gray dots indicate not significant in (A). (B) The heatmap of the differential gene expression, different colors represent the trend of gene expression in different tissues in (B). (C) The top 50 upregulated genes and top 50 downregulated genes were showed in this figure. The enriched Kyoto Encyclopedia of Genes and Genomes (KEGG) signaling pathways were selected to demonstrate the primary biological actions of major potential mRNA. The abscissa indicates gene ratio and the enriched pathways were presented in the ordinate in (C). (D) Gene ontology analysis of potential targets of mRNAs, including the biological process, cellular component, and molecular function of potential targets in (D). Colors represent the significance of differential enrichment, the size of the circles represents the number of genes, the larger the circle, the greater the number of genes. In the enrichment result, P < .05 or FDR < 0.05 is considered to be a meaningful pathway (enrichment score with −log10 (P) of more than 1.3).
Figure 5.
Figure 5.
Kaplan–Meier survival analysis of the gene signature from TCGA database. Construct of m5C RNA methylation regulator signature and assess of its prognostic value. (A) The coefficients of ALYREF. (B) Survival analysis of the high and low-risk groups of TCGA PC cohort.
Figure 6.
Figure 6.
The correlations between gene expression and immune score. Tumor immune microenvironment (TIM) relationships were analyzed with Spearman by TIMER (A), EPIC (B), QUANTISEQ (C), and MCPCOUNTER (D). The abscissa represents the different TIM cells, and the ordinate represents the m5C genes. Different colors represent different correlation coefficients (blue represents positive correlation and red represents negative correlation), the darker the color, the stronger the relation. **for P < .01, *for P < .05.
Figure 7.
Figure 7.
The identification of prognostic factor for OS and the development of the nomogram. (A) Univariate Cox analysis. (B) Multivariate Cox analysis. (C) Nomogram for OS in BLCA patients. (D) The calibration curves for 1 y, 3 y, and 5 y. The P value, risk coefficient (HR) and confidence interval are analyzed by univariate and multivariate Cox regression. Nomogram can predict the 1 y, 3 y, and 5 y overall survival of BLCA patients. Calibration curve was for the overall survival nomogram model in the discovery group. The dashed diagonal line represents the ideal nomogram, and the blue line, red line, and orange line represent the 1 y, 3 y, and 5 y of the observed nomogram.
Figure 8.
Figure 8.
ALYREF was upregulated in BLCA. Upregulation of ALYREF mRNA in BLCA specimens. The picture shows the mRNA expression levels from the GEPIA (A, B). The immunohistochemistry (C, D) and immunofluorescence (E–G) images were from the Human Protein Atlas. The nucleus was stained blue, the microtubules were stained red, and the ALYREF proteins were stained green. *P < .05.
Figure 9.
Figure 9.
ALYREF was associated with poor clinical outcomes. ALYREF was upregulated in BLCA and associated with poor clinical outcomes. Kaplan–Meier curves for ALYREF.

Similar articles

Cited by

References

    1. Siegel RL, Miller KD, Fuchs HE, et al. . Cancer statistics, 2022. CA Cancer J Clin. 2022;72:7–33. - PubMed
    1. Rose TL, Milowsky MI. Improving systemic chemotherapy for bladder cancer. Curr Oncol Rep. 2016;18:27. - PubMed
    1. Craig AJ, von Felden J, Garcia-Lezana T, et al. . Tumour evolution in hepatocellular carcinoma. Nat Rev Gastroenterol Hepatol. 2020;17:139–52. - PubMed
    1. Qiu Z, Li H, Zhang Z, et al. . A pharmacogenomic landscape in human liver cancers. Cancer Cell. 2019;36:179–193.e11. - PMC - PubMed
    1. Ferro M, Falagario UG, Barone B, et al. . Artificial intelligence in the advanced diagnosis of bladder cancer-comprehensive literature review and future advancement. Diagnostics (Basel). 2023;13:2308. - PMC - PubMed