. 2024 Jul 11;144(2):171-186.
doi: 10.1182/blood.2023022293.

IL-18-secreting multiantigen targeting CAR T cells eliminate antigen-low myeloma in an immunocompetent mouse model

Affiliations

IL-18-secreting multiantigen targeting CAR T cells eliminate antigen-low myeloma in an immunocompetent mouse model

Brandon D Ng et al. Blood. .

Abstract

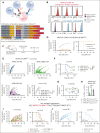
Multiple myeloma is a plasma cell malignancy that is currently incurable with conventional therapies. Following the success of CD19-targeted chimeric antigen receptor (CAR) T cells in leukemia and lymphoma, CAR T cells targeting B-cell maturation antigen (BCMA) more recently demonstrated impressive activity in relapsed and refractory myeloma patients. However, BCMA-directed therapy can fail due to weak expression of BCMA on myeloma cells, suggesting that novel approaches to better address this antigen-low disease may improve patient outcomes. We hypothesized that engineered secretion of the proinflammatory cytokine interleukin-18 (IL-18) and multiantigen targeting could improve CAR T-cell activity against BCMA-low myeloma. In a syngeneic murine model of myeloma, CAR T cells targeting the myeloma-associated antigens BCMA and B-cell activating factor receptor (BAFF-R) failed to eliminate myeloma when these antigens were weakly expressed, whereas IL-18-secreting CAR T cells targeting these antigens promoted myeloma clearance. IL-18-secreting CAR T cells developed an effector-like T-cell phenotype, promoted interferon-gamma production, reprogrammed the myeloma bone marrow microenvironment through type-I/II interferon signaling, and activated macrophages to mediate antimyeloma activity. Simultaneous targeting of weakly-expressed BCMA and BAFF-R with dual-CAR T cells enhanced T-cell:target-cell avidity, increased overall CAR signal strength, and stimulated antimyeloma activity. Dual-antigen targeting augmented CAR T-cell secretion of engineered IL-18 and facilitated elimination of larger myeloma burdens in vivo. Our results demonstrate that combination of engineered IL-18 secretion and multiantigen targeting can eliminate myeloma with weak antigen expression through distinct mechanisms.


Conflict of interest statement

Conflict-of-interest disclosure: A.P.B. has received compensation for participating in consulting activities with Bristol Myers Squibb. S.E.J. and M.R.M.v.d.B. are coinventors on patent applications related to this work. M.R.M.v.d.B. has received research support and stock options from Seres Therapeutics and stock options from Notch Therapeutics and Pluto Therapeutics; he has received royalties from Wolters Kluwer; has consulted, received honorarium from or participated in advisory boards for Seres Therapeutics, Vor Biopharma, Rheos Medicines, Frazier Healthcare Partners, Nektar Therapeutics, Notch Therapeutics, Ceramedix, Lygenesis, Pluto Therapeutics, GlaskoSmithKline, Da Volterra, Thymofox, Garuda, Novartis (spouse), Synthekine (spouse), BeiGene (spouse), Kite (spouse); has intellectual property licensing with Seres Therapeutics and Juno Therapeutics; and holds a fiduciary role on the foundation board of Deutsche Knochenmarkspenderdatei (a nonprofit organization). Memorial Sloan Kettering Cancer Center has institutional financial interests relative to Seres Therapeutics. B.B. is leader of the scientific advisory board in the Nykode Therapeutics (former Vaccibody AS) company in which he holds shares. The remaining authors declare no competing financial interests.

Figures

None
Graphical abstract
Figure 1.
Figure 1.
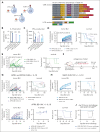
Myeloma–directed CAR T cells are impaired by low antigen expression in vivo. (A) Schematic of the APRIL-CAR targeting both BCMA/TACI and scFv–based BCMA and BAFF-R CARs targeting BCMA and BAFF-R, respectively, on a myeloma cell. All vector maps for CARs used in this figure are depicted below. (B) Endogenous expression of TACI, BCMA, and BAFF-R on MOPC315.BM (top, red). Validation of TACI KO with CRISPR-Cas9-gRNA electrporation (purple), and overexpression of a FLAG–tagged murine BCMA that was expressed with a transposase (blue). (C) Schematic of syngeneic MOPC315.BM in vivo model. Mice were lymphodepleted with 450 cGy sublethal total body irradiation (SL-TBI) on day 0 and then injected tail IV with MOPC315.BM. CAR T cells were injected 3 days later. (D) Tumor BLI and survival of mice bearing 4E5 MOPC315.BM FLAG-mBCMA (overexpressed) and treated with BCMA-28-1XX T cells. Mice were lymphodepleted with 450 cGy SL-TBI on day 0 and then injected tail IV with 4E5 MOPC315.BM FLAG-mBCMA. 2E6 CAR T cells were injected 3 days later. BCMA-CAR T cells were cultured with 1 μM dasatinib for 2 days prior to injection into mice. (E-F) Tumor BLI and survival of mice bearing MOPC315.BMWT (TACIhighBCMAlowBAFF-Rlow) and treated with APRIL-CAR T cells with varied costimulatory domains. Mice were lymphodepleted with 450 cGy SL-TBI on day 0 and then injected tail IV with 2E5 MOPC315.BMWT. 2E6 CAR T cells were injected 3 days later. BLI statistics performed with Vardi area under the curve (AUC) analysis and survival statistics with Mantel-Cox log-rank test. Data are combined from at least 4 independent experiments. (G) T-cell BLI of mice treated with CD45.1+ APRIL-CAR T cells labeled with gLuc-GFP. Mice were lymphodepleted with 450 cGy SL-TBI on day 0 and then injected tail IV with 2E5 MOPC315.BMWT. 2E6 CAR T cells were injected 3 days later. T cells were imaged weekly starting on day 6. Statistics were performed with the 1-way analysis of variance (ANOVA) test on day 27. Data are combined from at least 2 independent experiments. (H) CD45.1+ T-cell abundance measured in the peripheral blood of mice from panel G on day 29, as measured by flow cytometry. Statistics were performed with the 1-way ANOVA test. Data are representative of at least 2 independent experiments. (I-J) Tumor BLI and survival of mice bearing MOPC315.BMlow (TACIKOBCMAlowBAFF-Rlow) and treated with APRIL, BCMA, or BAFF-R-CAR T cells. Mice were lymphodepleted with 450 cGy SL-TBI on day 0 and then injected tail IV with 4E5 MOPC315.BMlow. 2E6 CAR T cells were injected 3 days later. ns, not significant; ∗P < .05; ∗∗P < .01; ∗∗∗P < .001; ∗∗∗∗P < .0001.
Figure 2.
Figure 2.
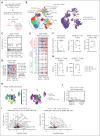
Engineered IL-18 secretion by CAR T cells improves therapeutic activity against antigen-high and antigen-low myeloma. (A) Schematic of APRIL, BCMA, or BAFF-R CAR T cells engineered to secrete IL-18. Vector maps for CAR constructs used in this figure are depicted to the right. (B) Engineered IL-18 secretion levels by APRIL-CAR T cells ± engineered IL-18 secretion. Approximately 100 000 CAR T cells were cultured for 24 hours in IL-2 and the supernatant was collected for ELISA. Concentration was determined based on standard curve measurements. Statistical analysis performed with the Student t test. (C) IFN-γ secretion by APRIL-CAR T cells ± engineered IL-18 secretion. Supernatant from setup in panel B was analyzed using an IFN-γ flow cytometric bead array kit. Statistical analysis performed with the Student t test. (D) Tumor BLI and survival of mice bearing MOPC315.BMWT and treated with CD28-costimulated, IL-18-secreting APRIL-CAR T cells. Mice were lymphodepleted with 450 cGy SL-TBI on day 0 and then injected tail IV with 2E5 MOPC315.BMWT. 2E6 CAR T cells were injected 3 days later. Data are combined from at least 2 independent experiments. (E) Tumor BLI and survival of mice bearing MOPC315.BMWT and treated with CD28-4-1BB-costimulated IL-18-secreting APRIL-CAR T cells. Mice were lymphodepleted with 450 cGy SL-TBI on day 0 and then injected tail IV with 2E5 MOPC315.BMWT. 2E6 CAR T cells were injected 3 days later. (F) Schematic of syngeneic antigen-low MOPC315.BMlow in vivo model (used in panels G-I). Mice were lymphodepleted with 450 cGy SL-TBI on day 0 and then injected tail IV with 4E5 MOPC315.BMlow. 2E6 CAR T cells were injected 3 days later. (G) Tumor BLI and survival of mice bearing MOPC315.BMlow (TACIKOBCMAlowBAFF-Rlow) and treated with IL-18-secreting APRIL or BCMA-CAR T cells. Tumor BLI was performed weekly starting on day 7. Data are combined from at least 2 independent experiments. (H) Tumor BLI and survival of mice bearing MOPC315.BMlow (TACIKOBCMAlowBAFF-Rlow) and treated with BAFF-R-28-1XX CAR T cells ± IL-18. Tumor BLI was performed weekly starting on day 7. (I) Tumor BLI, T-cell BLI, and survival of mice bearing MOPC315.BMlow (TACIKOBCMAlowBAFF-Rlow) and treated with APRIL-BB-1XX/IL-18 T cells compared with control APRIL-BB-1XX T cells without engineered IL-18 expression. T-cell BLI was performed weekly starting on day 6. Tumor BLI was performed weekly starting on day 7. Data are combined from at least 2 independent experiments. (J) Survival of APRIL-BB-1XX/IL-18 treated complete responder mice that were rechallenged with 4E5 MOPC315.BM TACIKO(BCMAlowBAFF-Rlow) 93 days after original experiment start date. Mice were not irradiated before re-challenge. Statistical analysis of all survival curves was performed with the Mantel-Cox log-rank test. ELISA, enzyme-linked immunosorbent assay. ∗P < .05; ∗∗P < .01; ∗∗∗∗P < .0001.
Figure 3.
Figure 3.
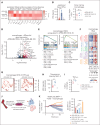
IL-18-secreting CAR T cells increase interferon signaling and drive effector-like differentiation of T cells in vivo. (A) Experimental setup describing in vivo antigen-low IL-18-CAR T-cell model and BM harvest for flow or single-cell sequencing. Mice were lymphodepleted with 450 cGy SL-TBI on day 0 and then injected tail IV with 4E5 MOPC315.BMlow. 2E6 CAR T cells were injected 3 days later. Harvest data for single-cell sequence or flow cytometry were collected on day 7 of experiment unless otherwise specified. (B) UMAP projection of 34628 CD45+ cells post-QC processing, annotated by different cell types (left) and biological group (right). (C) GSEA plot depicting enrichment of the type-I/II interferon signaling pathways in T cells from APRIL-BB-1XX/IL-18 treated mice. (D-E) Dotplot of selected CITE-seq epitope expression (D) and RNA transcript expression (E) related to antigen presentation, interferon signaling/response, T-cell activation/effector function, T-cell stemness, and cell cycle. Columns represent 3 replicate mice in each group. (F) Abundance of total T cells, CD45.2+ host T cells, and CD45.1+ donor CAR T cells, as measured by flow cytometry. Data are combined from at least 2 independent experiments. Statistics performed with the 1-way ANOVA test. (G) Expression of stemness/naïve-like markers in CD45.1+ donor CAR T cells, as measured by flow cytometry. Data are combined from at least 2 independent experiments. (H) UMAP projection of T cells and annotation of CD45.2+ host T cells and CD45.2 donor CAR T cells. Annotations were assigned using CD45.2 expression with CITE-seq. (I) Volcano plots of the Wilcoxon rank-sum scores from the differential gene expression analysis of APRIL-BB-1XX/IL-18 vs APRIL-BB-1XX CAR T-cell treatment in CD45.2+ host T cells and CD45.2 donor CAR T cells, respectively. Genes with adjusted P value = 1 were filtered out before plotting. (J) GSEA plot displaying upregulation of NF-κB signaling pathway in CD45.2 donor APRIL-BB-1XX/IL-18 T cells. UMAP: Uniform Manufold Approximation and Projection; GSEA: gene set enrichment analysis. ∗∗P < .01; ∗∗∗P < .001; ∗∗∗∗P < .0001.
Figure 4.
Figure 4.
IL-18-mediated IFN-γ secretion activates macrophages to promote elimination of antigen-low myeloma. (A) Z-score heat map of proinflammatory cytokines in the peripheral blood of CAR T-cell–treated mice on day 8 of experiment, measured with the BioLegend Legendplex mouse inflammation panel of 13 cytokines. (B) IFN-γ concentration in the peripheral blood from panel A, measured with the BioLegend Legendplex mouse inflammation kit. Statistics were performed with the 1-way ANOVA test. (C) Abundance of CD11b+ F4/80+ macrophages in the BM of CAR T-cell–treated mice. Data are combined from at least 2 independent experiments. (D) Volcano plot of selected upregulated genes in BM macrophages from APRIL-BB-1XX/IL-18 vs APRIL-BB-1XX T-cell–treated mice. Genes with P value = 1 were filtered out before plotting. (E) GSEA plots of upregulated pathways related to hallmark interferon-gamma response, antigen presentation/processing and glucose utilization in BM macrophages from APRIL-BB-1XX/IL-18 treated mice. (F) Dotplot of mRNA transcript expression of genes related to antigen presentation and interferon response (more M1-like), M2/immunosuppression, macrophage activation, and glucose utilization in BM macrophages from mice treated with APRIL-BB-1XX T cells ± IL-18. Columns represent 3 replicate mice in each group. (G-H) Expression of MHC-II in BM macrophages as measured by CITE-seq (G) and flow cytometry (H). Flow cytometry data are combined from at least 2 independent experiments. (I) Production of tumor necrosis factor α (TNF-α) in BM macrophages as measured with flow cytometry, taken from a BM aspirate on day 10 of experiment. (J) Experimental setup of macrophage culture and isolation, followed by coculture of macrophages with T cells and antigen-low MOPC315.BMlow. BM was cultured with 25 ng/mL granulocyte-macrophage colony-stimulating factor (GM-CSF) for 7 days and then macrophages were harvested. Approximately 10 000 macrophages were cultured with 10 000 MOPC315.BMlow and 100 000 CAR T cells. (K-L) Incucyte cytotoxicity assay of APRIL-CAR T cells ± IL-18 expression and MOPC315.BMlow cocultured with macrophages. AUC was generated and statistical analysis was performed with the 1-way ANOVA test. Results are depicted as comparison of each T-cell group with macrophage coculture, or macrophages alone (K) and each T-cell product ± macrophages (L). Data are representative of at least 2 independent experiments. ∗∗P < .01; ∗∗∗P < .001; ∗∗∗∗P < .0001.
Figure 4.
Figure 4.
IL-18-mediated IFN-γ secretion activates macrophages to promote elimination of antigen-low myeloma. (A) Z-score heat map of proinflammatory cytokines in the peripheral blood of CAR T-cell–treated mice on day 8 of experiment, measured with the BioLegend Legendplex mouse inflammation panel of 13 cytokines. (B) IFN-γ concentration in the peripheral blood from panel A, measured with the BioLegend Legendplex mouse inflammation kit. Statistics were performed with the 1-way ANOVA test. (C) Abundance of CD11b+ F4/80+ macrophages in the BM of CAR T-cell–treated mice. Data are combined from at least 2 independent experiments. (D) Volcano plot of selected upregulated genes in BM macrophages from APRIL-BB-1XX/IL-18 vs APRIL-BB-1XX T-cell–treated mice. Genes with P value = 1 were filtered out before plotting. (E) GSEA plots of upregulated pathways related to hallmark interferon-gamma response, antigen presentation/processing and glucose utilization in BM macrophages from APRIL-BB-1XX/IL-18 treated mice. (F) Dotplot of mRNA transcript expression of genes related to antigen presentation and interferon response (more M1-like), M2/immunosuppression, macrophage activation, and glucose utilization in BM macrophages from mice treated with APRIL-BB-1XX T cells ± IL-18. Columns represent 3 replicate mice in each group. (G-H) Expression of MHC-II in BM macrophages as measured by CITE-seq (G) and flow cytometry (H). Flow cytometry data are combined from at least 2 independent experiments. (I) Production of tumor necrosis factor α (TNF-α) in BM macrophages as measured with flow cytometry, taken from a BM aspirate on day 10 of experiment. (J) Experimental setup of macrophage culture and isolation, followed by coculture of macrophages with T cells and antigen-low MOPC315.BMlow. BM was cultured with 25 ng/mL granulocyte-macrophage colony-stimulating factor (GM-CSF) for 7 days and then macrophages were harvested. Approximately 10 000 macrophages were cultured with 10 000 MOPC315.BMlow and 100 000 CAR T cells. (K-L) Incucyte cytotoxicity assay of APRIL-CAR T cells ± IL-18 expression and MOPC315.BMlow cocultured with macrophages. AUC was generated and statistical analysis was performed with the 1-way ANOVA test. Results are depicted as comparison of each T-cell group with macrophage coculture, or macrophages alone (K) and each T-cell product ± macrophages (L). Data are representative of at least 2 independent experiments. ∗∗P < .01; ∗∗∗P < .001; ∗∗∗∗P < .0001.
Figure 5.
Figure 5.
BAFF-R/APRIL dual-CAR T cells with engineered IL-18 secretion eliminate antigen-low myeloma in a stress-dose model. (A) Schematic of BAFF-R/APRIL dual-CAR T cells and the corresponding CAR vector maps. (B) Incucyte cytotoxicity assay of BAFF-R/APRIL dual or single-CAR T cells vs 10 000 IRFP713+ MOPC315.BMlow. Near-infrared signal was measured over time with the Incucyte SX5. Statistical analysis was performed with the 1-way ANOVA test at 72-hour end point. Data are representative of at least 2 independent experiments. (C) Binding avidity force between MOPC315.BMlow and BAFF-R/APRIL dual or single-CAR T cells. Myeloma cells were seeded on poly-L-lysine coated plates before adding EGFP+ T cells. Lumicks C-trap optical tweezers were used to locate EGFP+ T cells, bring them in contact with myeloma cells, and then separate them, allowing separating force to be recorded. Statistical analysis was performed with the 1-way ANOVA test. Data are combined from at least 2 independent experiments. (D) Confocal microscopy of coexpressed BAFF-R-EGFP and APRIL-tagRFP CARs present at the synapse interface between CAR T cells and MOPC315.BMlow (TACIKOBCMAlowBAFF-Rlow). CAR T cells were cocultured with MOPC315.BMlow for 2 hours and then fixed and processed for imaging. Z-stack images were acquired with Leica Stellaris 8 at 63× magnification and room temperature (25°C), in the following channels: green, red, and DAPI. Data were analyzed on the Imaris software (Oxford Instruments) and 2D images containing a clear representation of the T-cell:MOPC315.BMlow synaptic interface were exported. (E) NFAT signaling of BAFF-R/APRIL dual or single-CAR T cells when exposed MOPC315.BMWT or MOPC315.BMlow myeloma cells. A total of 20 000 CAR T cells containing an NFAT-EGFP response element were cocultured with 60 000 myeloma cells for 24 hours. NFAT-GFP signaling was measured with flow cytometry. Data are representative of at least 2 independent experiments. (F) NF-κB signaling of BAFF-R/APRIL dual or single-CAR T cells. 10 000 CAR T cells containing an NF-κB-EGFP response element were cocultured with 30 000 MOPC315.BMlow cells. NF-κB-EGFP signal was measured over time with the Incucyte SX5. Statistical analysis was performed with the 1-way ANOVA test at 120 hours. Data are representative of at least 2 independent experiments. (G) Antigen-low myeloma standard dosing schematic, tumor BLI and survival of mice bearing MOPC315.BMlow (TACIKOBCMAlowBAFF-Rlow) and treated with BAFF-R/APRIL dual or single APRIL or BAFF-R-CAR T cells. Mice were lymphodepleted with 450 cGy SL-TBI on day 0 and then injected tail IV with 4E5 MOPC315.BMlow. 2E6 CAR T cells were injected 3 days later. Statistical analysis of survival was performed with the Mantle-Cox log-rank test. Data are combined from at least 2 independent experiments. (H) Schematic of IL-18-secreting BAFF-R/APRIL dual-CAR T cells and the corresponding vector maps. (I) Model setup of stress-dose model of MOPC315.BMlow (TACIKOBCMAlowBAFF-Rlow) with a 5× increase in tumor dose and 20× decrease in T-cell dose. Mice were lymphodepleted with 450 cGy SL-TBI on day 0 and then injected tail IV with 2E6 MOPC315.BMlow. 1E5 CAR T cells were injected 3 days later. (J) Tumor BLI and survival of mice bearing 2E6 MOPC315.BMlow (TACIKOBCMAlowBAFF-Rlow) and treated with a low dose of 1E5 IL-18-secreting BAFF-R/APRIL dual-CAR T cells, BAFF-R/APRIL dual-CAR T cells alone, BAFF-R/IL-18 CAR T cells, or APRIL/IL-18 CAR T cells. Statistical analysis of survival was performed with the Mantel-Cox log-rank test. Data are combined from at least 3 independent experiments. (K) ELISA of IL-18 production from BAFF-R-28-1XX/APRIL-BB-1XX/IL-18 compared with BAFF-R-28-1XX/IL-18 and APRIL-BB-1XX/IL-18 CAR T cells when cocultured with MOPC315.BMlow. Statistical analysis was performed with the 1-way ANOVA test. DAPI, 4′,6-diamidino-2-phenylindole; ELISA, enzyme-linked immunosorbent assay. ∗P < .05; ∗∗P < .01; ∗∗∗P < .001; ∗∗∗∗P < .0001.

References

    1. Morgan GJ, Walker BA, Davies FE. The genetic architecture of multiple myeloma. Nat Rev Cancer. 2012;12(5):335–348. - PubMed
    1. Cancer Stat Facts: Myeloma. National Cancer Institute. https://seer.cancer.gov/statfacts/html/mulmy.html
    1. Moreau P, Attal M, Facon T. Frontline therapy of multiple myeloma. Blood. 2015;125(20):3076–3084. - PubMed
    1. Mikkilineni L, Kochenderfer JN. CAR T cell therapies for patients with multiple myeloma. Nat Rev Clin Oncol. 2021;18(2):71–84. - PubMed
    1. Van De Donk NWCJ, Richardson PG, Malavasi F. CD38 antibodies in multiple myeloma: back to the future. Blood. 2018;131(1):13–29. - PubMed

Publication types