. 2024 Apr 4;31(4):499-518.e6.
doi: 10.1016/j.stem.2024.03.002.

A simultaneous knockout knockin genome editing strategy in HSPCs potently inhibits CCR5- and CXCR4-tropic HIV-1 infection

Affiliations

A simultaneous knockout knockin genome editing strategy in HSPCs potently inhibits CCR5- and CXCR4-tropic HIV-1 infection

Amanda M Dudek et al. Cell Stem Cell. .

Abstract

Allogeneic hematopoietic stem and progenitor cell transplant (HSCT) of CCR5 null (CCR5Δ32) cells can be curative for HIV-1-infected patients. However, because allogeneic HSCT poses significant risk, CCR5Δ32 matched bone marrow donors are rare, and CCR5Δ32 transplant does not confer resistance to the CXCR4-tropic virus, it is not a viable option for most patients. We describe a targeted Cas9/AAV6-based genome editing strategy for autologous HSCT resulting in both CCR5- and CXCR4-tropic HIV-1 resistance. Edited human hematopoietic stem and progenitor cells (HSPCs) maintain multi-lineage repopulation capacity in vivo, and edited primary human T cells potently inhibit infection by both CCR5-tropic and CXCR4-tropic HIV-1. Modification rates facilitated complete loss of CCR5-tropic replication and up to a 2,000-fold decrease in CXCR4-tropic replication without CXCR4 locus disruption. This multi-factor editing strategy in HSPCs could provide a broad approach for autologous HSCT as a functional cure for both CCR5-tropic and CXCR4-tropic HIV-1 infections.

Keywords: CCR5 knockout; CRISPR-Cas9; HIV; HIV restriction; autologous HSCT; cell therapy; functional cure; gene editing; hematopoietic stem cell transplant; homology-directed repair.


Conflict of interest statement

Declaration of interests This work was supported by the Laurie Kraus Lacob Faculty Scholar Fund in Pediatric Translational Medicine and the Sutardja Chuk Professorship in Definitive and Curative Medicine. M.H.P. has equity in CRISPR Tx, Graphite Bio, Allogene Tx, and Kamau Tx and serves on the SAB for Allogene Tx and on the Board of Directors for Graphite Bio and Kamau Tx. M.H.P. is a Board Observer at Arbor Tx. The authors can confirm that all relevant data are included in the article and/or its supplemental information files or are available upon request.

Figures
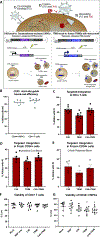
Figure 1:
Figure 1:. Editing strategy and expected expression pattern for multi-factor genome HSPC therapy.
A) Diagram of the knock-in strategies and construct designs employed for HIV-1 inhibition (top). Mechanism of multi-factor resistance through the editing strategy at the CCR5 locus for simultaneous knock-out and targeted integration of C46 and TRIM constructs. Expected expression pattern in hematopoietic lineage cells (bottom). B) Knock-out INDEL frequency with the CCR5 start-site guide in human CD34+ cells (n = 8 independent donors) and human CD4+ T cells (n = 8 independent donors). C) Allelic integration frequency of C46 and TRIM expression cassettes in CD4+ T cells (n = 8 independent donors) targeted with AAV6 vectors as indicated. D) Allelic integration frequency of C46 and TRIM expression cassettes in freshly isolated UCB CD34+ cells (n = 5 independent donors) targeted with AAV6 vectors as indicated. E) Allelic integration frequency of C46 and TRIM expression cassettes in cryopreserved mobilized PB CD34+ cells (n = 4 independent donors) targeted with AAV6 vectors as indicated. All bars represent mean with standard error of the mean (SEM). Trypan blue viability staining of individual donors two days post-editing of F) T cells (n = 8 independent donors) or G) HSPCs (n = 9 independent donors) (bars represent geometric mean and 95% confidence interval (CI)). Unpaired T test (ns = P > 0.05, * = 0.05 > P > 0.01). All replicates are biological replicates from independent donor samples.
Figure 2:
Figure 2:. Multi-factor gene edited peripheral blood HSPCs facilitate multi-lineage hematopoietic reconstitution in vivo.
A) Schematic of engraftment experiment overview and timeline for analysis of progenitor cell differentiation potential in vitro by CFU assay and edited HSPC reconstitution efficiency, hematopoietic lineage distribution analysis, and survival of knock-out and knock-in cells in vivo. B) Targeting efficiency in single or double targeted peripheral blood HSPCs on the day of engraftment. The donor used here was also presented in figure 1E. C) Relative distribution of hematopoietic progenitor subtypes produced from unedited or edited cells used for engraftment as measured by colony formation unit assay (n = 4 wells per condition, bars represent mean and SD). D) Percent human engraftment of unedited and edited cells at engraftment endpoint in bone marrow (circles) and spleen (squares) (bars represent mean and SD). E) Bone marrow and F) spleen hematopoietic lineage analysis of human engrafted cells to quantify Lymphoid (CD3+ or CD19+, black bar), Myeloid (CD33+, grey bar), or Other (CD3-, CD19-, CD33-, white bar) (bars represent mean and SEM). G) Percentage of B (CD19+) or T (CD3+) cells within human CD45+ human HLA-ABC+ subset (bars represent mean and SEM). H) Percentage of human alleles in bone marrow and spleen containing knock-out at engraftment endpoint, as measured by ICE analysis and I) percentage of human alleles in bone marrow and spleen containing knock-in at engraftment endpoint, as measured by ddPCR for detection of targeted integration of bGH sequence at the CCR5 locus (bars represent mean and SD). J) Percentage of human alleles containing either C46 or TRIM after transplantation of C46+TRIM edited cells at engraftment endpoint in either bone marrow or spleen (n = 4 mice, bars represent mean and SD).
Figure 3:
Figure 3:. HSPCs with high efficiency knock-in of C46 and TRIM maintain engraftment potential and progenitor cell viability.
A) Genotype of control (no drug) or AZD7648-treated edited HSPCs on the day of transplantation into NBSGW mice. B) Total human engraftment in bone marrow of Mock-treated cells (black, n = 4 independent donors) or cells targeted with both C46 and TRIM constructs in the presence of AZD7648 (red, n = 8 independent donors), 13 weeks post-transplant (bars represent geometric mean and 95% CI, Mann-Whitney test, ** = 0.01 > P > 0.001). C) Engraftment endpoint hematopoietic lineage distribution analysis of relative B cell (CD19+), myeloid (CD33+), and T cell (CD3+) percentages within the human graft (bars represent geometric mean and 95% CI, Mann-Whitney test, ns = P > 0.05, ** = 0.01 > P > 0.001) and D) percentage of human alleles in the bone marrow containing knock-in at the engraftment endpoint (bars represent geometric mean and 95% CI). E) Representative gating showing percentage of GFP positive control HSPCs edited with CCR5-targeting UBC-GFP and F) gating strategy for analysis of apoptotic cells using Annexin-V and propidium iodide. G) Percentage of CCR5 alleles containing knock-in of either the control UBC-GFP construct or double-targeted with C46+TRIM (n = 3 independent donors, bars represent median, unpaired T test, ns = P = 0.6787). H) Percentage of live, early or late apoptotic, and dead umbilical cord blood HSPCs two days after targeting with UBC-GFP or C46+TRIM (n = 3 independent donors, bars represent median, unpaired T test, ns = P > 0.05. I) Number of CFU-GM, BFU-E, and CFU-GEMM colonies derived from progenitor cells plated two days post targeting with UBC-GFP or C46+TRIM constructs (average of two wells per donor per condition, n = 3 independent donors, bars represent median, unpaired T test). J) Analysis of mono- and bi-allelic integrations in three individual donors from single-cell colonies of double targeted cells plated in panel I, and K) construct specific mono- or bi-allelic integration from total single cell colonies derived from all three donors as an average allelic KI distribution in progenitor cells from each subset post-editing.
Figure 4:
Figure 4:. HIV-optimized culture induces a Th1-like phenotype in unedited and edited CD4+ T cells.
A) Comparison of basal CCR5 and CXCR4 expression on primary CD4+ T cells at the time of isolation compared to standard (day 6) or HIV-optimized (day 14) culture in cells from the same donor (n = 1). B) Schematic of major differences in T cell culture strategy for standard versus HIV-optimized culture, and C) representative cell surface staining demonstrating HIV-1 co-receptor upregulation during HIV-optimized culture and loss of surface CCR5 staining after CCR5 RNP treatment. D) Knock-out or E) knock-in efficiency comparison obtained from the two culture methods (n = 3 independent donors). F) Gating strategy and quantification of CD4+ T cell phenotype in unedited versus edited cells at day 14 in culture. G) Production of TNFα and IFNγ after T cell stimulation with PMA and ionomycin within in the CD3+, CD4+ population. H) Percentage of CD3+ CD4+ cells single or double positive for TNFα and IFNγ production and I) geometric mean fluorescence intensity of TNFα and IFNγ with and without stimulation after editing. Bars for all experiments except panel A are mean and SEM of three independent T cell donors.
Figure 5:
Figure 5:. Control and multi-factor gene edited primary human T cells show similar T cell subset distribution and responsiveness to stimulation.
A) Representative gating strategy of T cell phenotype analysis and quantification for B) memory or naïve T cells, C) activation state, D) IL7 receptor expression, and E) regulatory T cell subsets from CD4+ T cells at thaw prior to activation for editing (n = 3 independent donors). Differentiation endpoint phenotype analysis of donors characterized in panels B-E, percentage of F) memory, G) naïve, H) activated, I) IL7-receptor expressing, and J) regulatory T cell subsets after mock editing or double knock-in (n = 3 independent donors). K) Representative gating strategy for T helper cell subset cytokine analysis for characterization of hallmark L) Th1 (IFNg), M) Th2 (IL4), N) Th17 (IL17), and O) Tfh (IL21) expression with and without stimulation. Differentiation endpoint cytokine response analysis of P) Th1 (IFNg), Q) Th2 (IL4), R) Th17 (IL17), and S) Tfh (IL21) expression with and without stimulation in mock edited or double knock-in CD4+ T cells on day 14 (n = 3 independent donors). All bars represent geometric mean and 95% CI.
Figure 6:
Figure 6:. Multi-factor editing inhibits CCR5- and CXCR4-tropic replication in all primary human T cell donors.
A) Schematic of T cell editing and expansion for in depth infection characterization. B) HIV-1 co-receptor expression on the day of infection in unedited and edited cells (n = 5 independent donors, bars represent mean and SEM). C) Percentage of wild type (black), knock-out (grey), and knock-in (color) alleles demonstrating genotype distribution in each individual T cell donor on the day of infection challenge for cells edited with C46, D) TRIM, or E) C46+TRIM. H) Percentage of human alleles containing either C46 or TRIM in C46+TRIM edited cells at time of infection. G) Infection time course for replication of CCR5-tropic virus BaL in unedited (mock, black), knock-out (grey), and knock-in (color) in each individual T cell donor as measured by supernatant p24 ELISA (bars represent mean and SD of technical triplicate infections in each donor). Lines not visible behind overlapping grey lines represent samples below the limit of detection of 12.5 pg/mL. E) Infection time course for replication of CXCR4-tropic virus NL4–3 in unedited (mock, black), knock-out (grey), and knock-in (color) in each individual T cell donor as measured by supernatant p24 ELISA (bars represent mean and SD of technical triplicate infections in each donor). The knock-in frequency for donors shown in C, D, and E are also shown in figure 1C. Unpaired two-tailed T test with Welch’s correction after log transformation (ns = P > 0.05, * = 0.05 > P > 0.01, ** = 0.01 > P > 0.001, *** = 0.001 > P > 0.0001, **** = P < 0.0001)
Figure 7:
Figure 7:. Multi-factor primary human T cells have potent inhibition of intracellular HIV-1 DNA establishment and cell-free p24 production.
A) Aggregate fold inhibition in each of Donors A (circle), C (square), D (triangle), G (diamond), and H (hexagon) of B) CCR5-tropic or C) CXCR4-tropic HIV-1 in each editing condition, represented as fold change of the mean relative to mock condition. Fold change was calculated from the mean of triplicate infections at infection endpoint for supernatant p24, and the limit of detection of 12.5 pg/mL was used for fold change calculation of all samples below the limit of detection. Endpoint intracellular D) CCR5-tropic or E) CXCR4-tropic HIV-1 DNA copies (mean value from technical triplicate infection samples) as measured by ddPCR quantification of HIV-1 POL relative to CCRL2 control gene (dotted line = background signal observed from infection negative control cells). Targeted integration prevalence at infection endpoint of F) C46, G) TRIM, or H) C46+TRIM in uninfected (Neg Ctrl), CCR5-tropic, or CXCR4-tropic virus infected cells. All white and grey bars for panels B-H represent geometric mean and 95% confidence interval from 5 independent T cell donors, corresponding to replication curve endpoint gDNA and supernatant p24 concentration shown in figure 5. Mann-Whitney test (ns = P > 0.05, * = 0.05 > P > 0.01, ** = P < 0.01) I) Summary diagram of infection results observed from editing method in primary CD4+ T cell donors. CCR5 knock-out is sufficient for inhibition of CCR5-tropic BaL, while it does not inhibit CXCR4-tropic NL4–3. TRIM knock-in facilitates variable levels of inhibition against NL4–3 depending on the T cell donor, and C46 knock-in regulated by the endogenous CCR5 promoter shows strong inhibition of CXCR4 replication in all T cell donors.

References

    1. Kemnic TR, and Gulick PG (2022). HIV Antiretroviral Therapy. In StatPearls, (StatPearls Publishing; Copyright © 2022, StatPearls Publishing LLC.). - PubMed
    1. Marsh K, Eaton JW, Mahy M, Sabin K, Autenrieth CS, Wanyeki I, Daher J, and Ghys PD (2019). Global, regional and country-level 90–90-90 estimates for 2018: assessing progress towards the 2020 target. Aids 33 Suppl 3, S213–s226. 10.1097/qad.0000000000002355. - DOI - PMC - PubMed
    1. UNAIDS epidemiological estimates. (2021).
    1. Hütter G, Nowak D, Mossner M, Ganepola S, Müssig A, Allers K, Schneider T, Hofmann J, Kücherer C, Blau O, et al. (2009). Long-term control of HIV by CCR5 Delta32/Delta32 stem-cell transplantation. N Engl J Med 360, 692–698. 10.1056/NEJMoa0802905. - DOI - PubMed
    1. Brown TR (2015). I am the Berlin patient: a personal reflection. AIDS Res Hum Retroviruses 31, 2–3. 10.1089/aid.2014.0224. - DOI - PMC - PubMed

LinkOut - more resources