. 2024 May 13;42(5):904-914.e9.
doi: 10.1016/j.ccell.2024.03.008. Epub 2024 Apr 4.

Mutant IDH inhibitors induce lineage differentiation in IDH-mutant oligodendroglioma

Affiliations

Mutant IDH inhibitors induce lineage differentiation in IDH-mutant oligodendroglioma

Avishay Spitzer et al. Cancer Cell. .

Abstract

A subset of patients with IDH-mutant glioma respond to inhibitors of mutant IDH (IDHi), yet the molecular underpinnings of such responses are not understood. Here, we profiled by single-cell or single-nucleus RNA-sequencing three IDH-mutant oligodendrogliomas from patients who derived clinical benefit from IDHi. Importantly, the tissues were sampled on-drug, four weeks from treatment initiation. We further integrate our findings with analysis of single-cell and bulk transcriptomes from independent cohorts and experimental models. We find that IDHi treatment induces a robust differentiation toward the astrocytic lineage, accompanied by a depletion of stem-like cells and a reduction of cell proliferation. Furthermore, mutations in NOTCH1 are associated with decreased astrocytic differentiation and may limit the response to IDHi. Our study highlights the differentiating potential of IDHi on the cellular hierarchies that drive oligodendrogliomas and suggests a genetic modifier that may improve patient stratification.

Keywords: IDH1; differentiation therapy; glioma; ivosidenib; oligodendroglioma; single cell RNA-seq; vorasidenib.


Conflict of interest statement

Declaration of interests M.L.S. is equity holders, scientific co-founder and advisory board member of Immunitas Therapeutics. I.T. is advisory board member of Immunitas Therapeutics. D.P.C. has consulted for Lilly, Incephalo, Boston Pharmaceuticals, Servier, Boston Scientific and Pyramid Biosciences (equity interest), and has received honoraria and travel reimbursement from Merck for invited lectures. J.J.M. received consulting fees from Servier. The authors declare that such activities have no relationship to the present study. M.T. reports consulting or advisory role for Servier, Novocure, Resilience, Agios Pharmaceutical, Integragen, and Taiho Oncology, honoraria for Ono, and research funding from Sanofi. P.Y.W. reports research support from Astra Zeneca, Black Diamond, Bristol Meyers Squibb, Chimerix, Eli Lily, Erasca, Global Coalition For Adaptive Research, Kazia, MediciNova, Merck, Novartis, Quadriga, Servier, VBI Vaccines and consulting or advisory role for Anheart, Astra Zeneca, Black Diamond, Celularity, Chimerix, Day One Bio, Genenta, Glaxo Smith Kline, Kintara, Merck, Mundipharma, Novartis, Novocure, Prelude Therapeutics, Sagimet, Sapience, Servier, Symbio, Tango, Telix, VBI Vaccines. K.L.L is equity holder, consultant, and co-founder of Travera, is a consultant for BMS, Blaze Biosciences and Integragen, and has grant research funding through DFCI from BMS and Lilly. L.N.G.C. has received research support from Merck & Co, and consulting fees from BMJ Best Practice and Oakstone Publishing.

Figures

Figure 1.
Figure 1.. Study workflow, clinical timeline and dataset overview
(A) Scheme describing the study workflow. (B) Top panel shows an overview of the clinical history of MGH170 and MGH229 after initiation of IDHi treatment as well as representative brain MRIs of the two patients treated with IDHi. Bottom panel shows the clinical history of BWH445 before and after initiation of IDHi therapy as well as representative brain MRIs of this patient. (C) t-distributed stochastic neighbor embedding (t-SNE) plots of the unmatched samples showing 5,487 single cell expression profiles and of the matched on- and pre-treatment samples showing 8,219 single nucleus expression profiles. See also Figure S1 and Tables S1 and S2.
Figure 2.
Figure 2.. Gene-set enrichment analysis
(A) Comparison of IDHi-treated and untreated (unmatched) samples using GSEA. Each dot represents a gene-set that passed the statistical significance threshold (adjusted p-value<0.05, permutation test), dot size represents the extent of significance and color indicates whether the gene-set belongs to a glioma hierarchy/neural development gene-set. X-axis shows the GSEA Normalized Enrichment Score (NES), Y-axis shows the fraction of genes in each gene-set with an absolute log2-ratio>1 (e.g. genes at the extreme ends of the ranked list used for GSEA computation with more than a twofold change). (B) Enrichment of the ranked list used for GSEA (unmatched samples). Dots represent the percentage of genes, in a sliding window of 30 genes (by log2-ratio values), that overlap each of the three expression programs and the cell cycle. Trend line was computed using LOESS regression. (C) Comparison of matched on- and pre-treatment samples using GSEA (same as panel A). Y-axis shows the fraction of genes in each gene-set with an absolute log2-ratio>log2(1.5). (D) Common genes of the most highly DEGs (computed separately for the unmatched and matched cohorts). Columns represent samples, rows represent DEGs, which are annotated by the associated expression programs. The expression values of the unmatched samples are shown relative to the average bulk expression profile of the untreated samples and those of the matched on-treatment sample are shown relative to the expression profile of its pretreatment counterpart. See also Figure S2 and Table S3.
Figure 3.
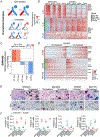
Figure 3.. IDHi treatment is associated with AC differentiation.
(A) Scheme depicting a model of cellular hierarchy in which colors represents the relative frequency of each cellular state in each tumor sample of the unmatched cohort. (B) Relative expression of genes associated with the AC-like, OC-like and NPC-like programs across the unmatched samples. Cells are ordered by AC-like score minus OC-like score; genes are ordered by expression log2-ratio. For visualization, each tumor was randomly down-sampled to 130 cells. (C) Comparison of the fraction of cells assigned to each state between the on- and pre-treatment matched samples. Bar values represent the statistical significance of each pairwise comparison, defined as -log10 of a p-value calculated by hypergeometric test and corrected for multiple testing using the Benjamini-Hochberg method; bar direction (up or down) is defined by an increase or decrease, respectively, of the relevant state fraction in the on-treatment sample. Bar colors represent the relative change in state fractions. (D) Same as panel B for the matched pair (no down-sampling in this case). (E) In situ RNA hybridization of tumors BWH445 (pre-treatment and on-treatment), MGH229 (pre-treatment and on-treatment), MGH94 (untreated) and MGH170 (on-treatment) for AC-like (GFAP, ALDOC), Stem-like (SOX4), and proliferation (Ki67) markers. (F) The fraction of cells staining positive for GFAP, ALDOC, SOX4 and Ki67 based on RNA in situ hybridization of tumors BWH445, MGH229, MGH94 and MGH170. Each dot corresponds to one field of view. Horizontal line represents the mean, error bar ±1SD. See also Figures S1-S4, Table S1.
Figure 4.
Figure 4.. Validation and putative predictors of AC-like differentiation
(A) Distribution of AC-like and cell cycle scores across 21 IDHi-treated oligodendroglioma bulk RNA-seq profiles from a perioperative phase 1 trial (NCT03343197). Samples are grouped by preoperative treatment condition. Scores are shown relative to the mean score of the two preoperatively untreated samples. P-values were computed for each treatment group separately using a one-sided t-test with the alternative hypothesis that the mean is greater or lesser than zero for the AC-like and cell cycle scores, respectively. Throughout this figure the box plots reflect the following summary statistics: (1) The line splitting the box represents the median value. (2) The lower and upper edges correspond to the first and third quartiles (the 25th and 75th percentiles). (3) The upper whisker extends from the edge to the largest value no further than 1.5 * IQR from the edge. (4) The lower whisker extends from the edge to the smallest value at most 1.5 * IQR of the edge. (5) Data beyond the end of the whiskers are plotted individually as outlying points. (B) Association between AC-like and cell cycle scores across n=23 (n=21 treated) bulk RNA-seq oligodendroglioma samples. Trend line was computed using linear regression. (C) Comparison of IDHi-treated and untreated Notch1-WT mouse Idh1LSL-R132H;Trp53flox/flox;Olig2Cre glioma cells using GSEA, similar to the analysis shown in Fig. 3A. (D) Comparison of the proportion of cells assigned to each state in the IDHi-treated and untreated Notch1-WT mouse Idh1LSL-R132H;Trp53flox/flox;Olig2Cre glioma cells. Odds ratio, confidence interval and p-value were derived from Fisher’s test. OR > 1 reflects increased proportions of the particular cell state in the IDHi-treated relative to the untreated cells. Significance levels: * p < 0.05, ** p < 0.01, *** p < 0.001. (E) Global methylation in IDHi-treated vs. untreated mouse Idh1LSL-R132H;Trp53flox/flox;Olig2Cre glioma cells. Each dot represents a cell. P-value was computed using a one-sided Kolmogorov-Smirnov test. (F) Shown are 905 gene-sets that have an overlap greater than 0 with both 100 most demethylated and 100 most upregulated genes (i.e. observed overlap). The expected overlap is the overlap between each gene-set and the genes that passed QC in methylation and expression data independently. Red dots represent gene-sets that are significantly enriched (with a p-value<0.05, one-sided Fisher’s test) in both methylation and expression data. Trend line was computed using linear regression. (G) Analysis of the association between recurrent mutations (in at least five tumors) and AC-like differentiation scores, for oligodendroglioma tumors of grade 2 (left) and of grade 3 (right) reveals a significant association (FDR-adjusted p-value=0.02, Wilcoxon rank sum test) between mutations in NOTCH1 and low degree of AC-like differentiation in grade 2 lesions (11/72 samples) but not in grade 3 lesions (16/62 samples). Each panel shows the difference in average AC-like differentiation score between tumors with and those without a specific mutation (X-axis), and the significance of that score (Y-axis, defined by −log10 of the p-value calculated by t-test and corrected for multiple testing by the Benjamini-Hochberg method). Horizontal line shows a significance threshold (FDR=0.05), highlighting NOTCH1 in grade 2 oligodendroglioma as the only significant association; Vertical line represents the mean AC-like differentiation score. (H) Density of AC-like differentiation scores among grade 2 oligodendrogliomas with wild-type (green) or mutant (orange) NOTCH1. (I-J) Similar analysis to that shown in panels C-D for the Notch1-KO mouse Idh1LSL-R132H;Trp53flox/flox;Olig2Cre glioma cells. See also Figure S5 and Tables S4, S5.

References

    1. Parsons DW, Jones S, Zhang X, Lin JCH, Leary RJ, Angenendt P, Mankoo P, Carter H, Siu IM, Gallia GL, et al. (2008). An integrated genomic analysis of human glioblastoma multiforme. Science (80-. ). 321, 1807–1812. 10.1126/science.1164382. - DOI - PMC - PubMed
    1. Yan H, Parsons DW, Jin G, McLendon R, Rasheed BA, Yuan W, Kos I, Batinic-Haberle I, Jones S, Riggins GJ, et al. (2009). IDH1 and IDH2 Mutations in Gliomas. N. Engl. J. Med 360, 765–773. 10.1056/NEJMoa0808710. - DOI - PMC - PubMed
    1. Borger DR, Tanabe KK, Fan KC, Lopez HU, Fantin VR, Straley KS, Schenkein DP, Hezel AF, Ancukiewicz M, Liebman HM, et al. (2012). Frequent Mutation of Isocitrate Dehydrogenase (IDH)1 and IDH2 in Cholangiocarcinoma Identified Through Broad-Based Tumor Genotyping. Oncologist 17, 72–79. 10.1634/theoncologist.2011-0386. - DOI - PMC - PubMed
    1. Mardis ER, Ding L, Dooling DJ, Larson DE, McLellan MD, Chen K, Koboldt DC, Fulton RS, Delehaunty KD, McGrath SD, et al. (2009). Recurring Mutations Found by Sequencing an Acute Myeloid Leukemia Genome. N. Engl. J. Med 361, 1058–1066. 10.1056/NEJMoa0903840. - DOI - PMC - PubMed
    1. Ward PS, Patel J, Wise DR, Abdel-Wahab O, Bennett BD, Coller HA, Cross JR, Fantin VR, Hedvat CV, Perl AE, et al. (2010). The Common Feature of Leukemia-Associated IDH1 and IDH2 Mutations Is a Neomorphic Enzyme Activity Converting α-Ketoglutarate to 2-Hydroxyglutarate. Cancer Cell 17, 225–234. 10.1016/j.ccr.2010.01.020. - DOI - PMC - PubMed

MeSH terms