. 2024 Apr 16;5(4):101483.
doi: 10.1016/j.xcrm.2024.101483. Epub 2024 Apr 4.

Receptor transfer between immune cells by autoantibody-enhanced, CD32-driven trogocytosis is hijacked by HIV-1 to infect resting CD4 T cells

Affiliations

Receptor transfer between immune cells by autoantibody-enhanced, CD32-driven trogocytosis is hijacked by HIV-1 to infect resting CD4 T cells

Manuel Albanese et al. Cell Rep Med. .

Abstract

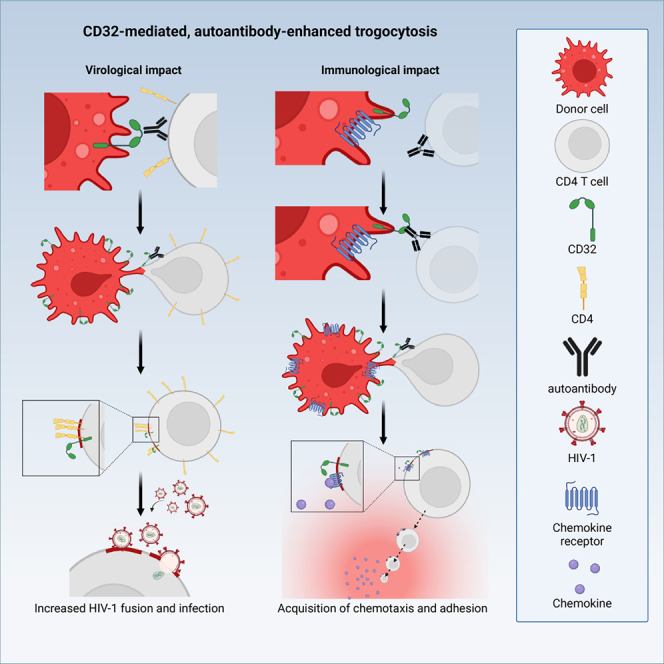
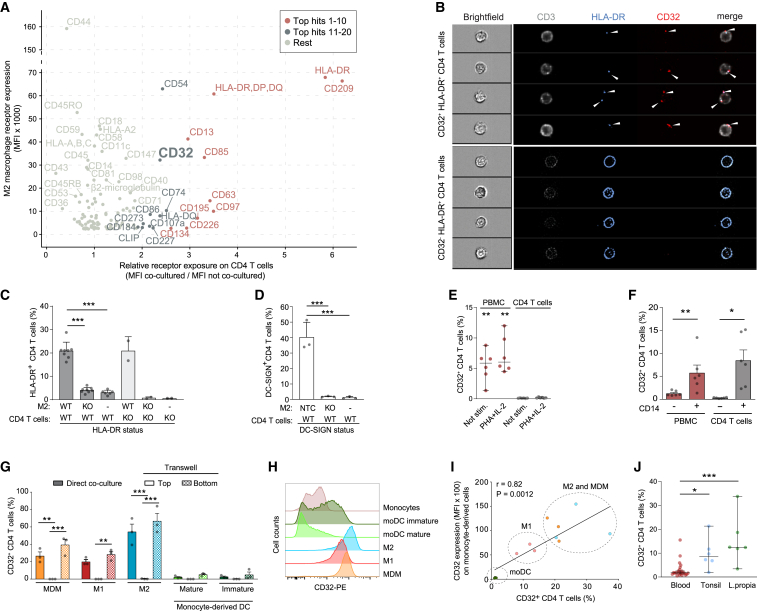
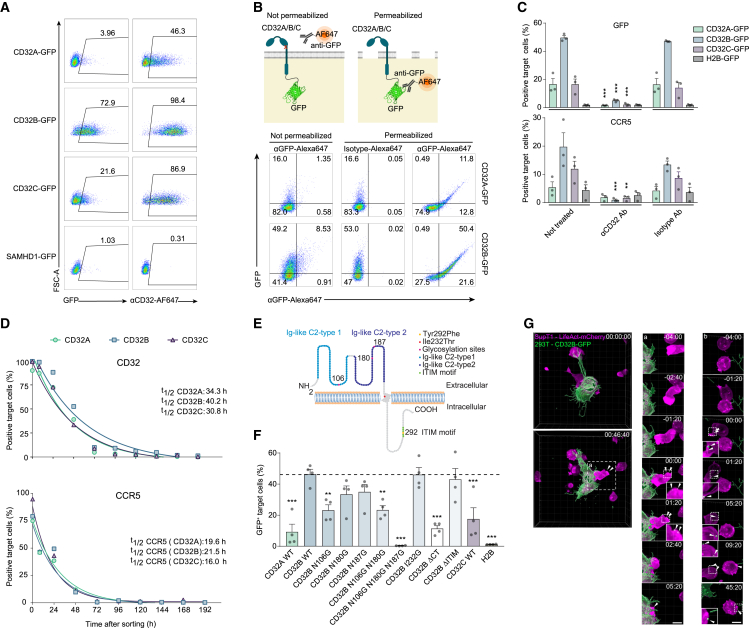
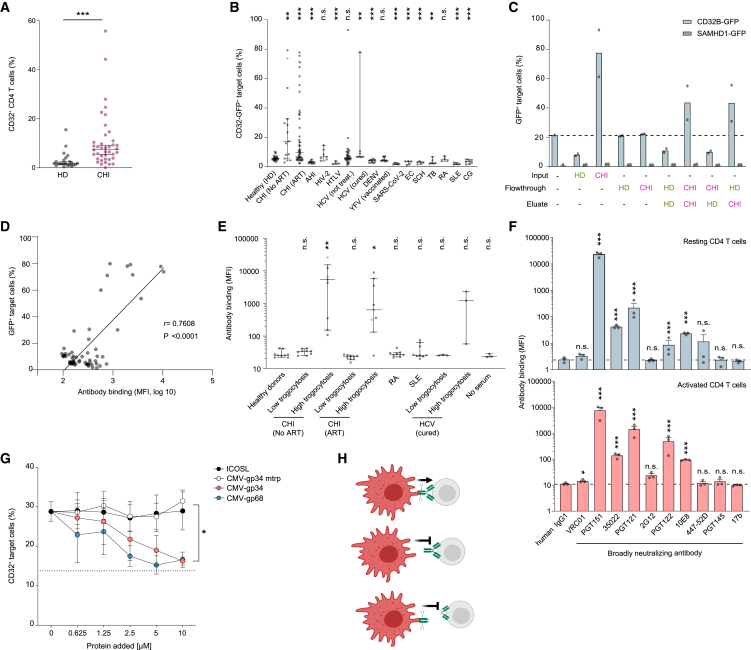
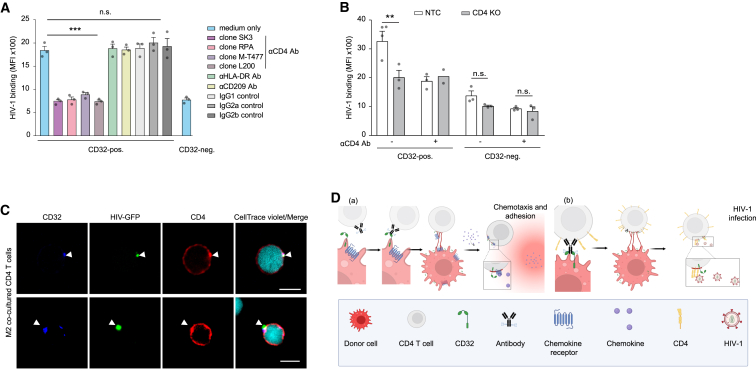
Immune cell phenotyping frequently detects lineage-unrelated receptors. Here, we report that surface receptors can be transferred from primary macrophages to CD4 T cells and identify the Fcγ receptor CD32 as driver and cargo of this trogocytotic transfer. Filamentous CD32+ nanoprotrusions deposit distinct plasma membrane patches onto target T cells. Transferred receptors confer cell migration and adhesion properties, and macrophage-derived membrane patches render resting CD4 T cells susceptible to infection by serving as hotspots for HIV-1 binding. Antibodies that recognize T cell epitopes enhance CD32-mediated trogocytosis. Such autoreactive anti-HIV-1 envelope antibodies can be found in the blood of HIV-1 patients and, consistently, the percentage of CD32+ CD4 T cells is increased in their blood. This CD32-mediated, antigen-independent cell communication mode transiently expands the receptor repertoire and functionality of immune cells. HIV-1 hijacks this mechanism by triggering the generation of trogocytosis-promoting autoantibodies to gain access to immune cells critical to its persistence.

Keywords: CD32; CRISPR-Cas9; HIV reservoir; autoantibodies; immune cell communication; trogocytosis.


Conflict of interest statement

Declaration of interests The authors declare no competing interests.

Figures

None
Graphical abstract
Figure 1
Figure 1
CD32 and other receptors are transferred from macrophages to co-cultured CD4 T cells (A) Screening for surface receptors transferred from autologous M2 macrophages (M2) to CD4 T cells following co-culture for 2 days. Receptors most highly transferred were categorized into “top hits 1–10” and “top hits 11–20,” respectively. x axis, mean of the mean fluorescence intensity (MFI) ratio from a pool of three donors; y axis, MFI of receptor expression on M2 from a pool of three donors. (B) Peripheral blood CD4 T cells were stained for CD3, HLA-DR, and CD32 and analyzed by AMNIS Imagestream. Shown are bright-field and fluorescent images of cells gated for CD32 positivity. Upper panel, CD32+ HLA-DR+ CD4 T cells; lower panel, CD32 HLA-DR+ CD4 T cells (see Figure S1D for gating strategy). (C) HLA-DR expression on autologous wild-type (WT) or HLA-DR KO CD4 T cells (KO) and M2 after 2 days of co-culture (mean ± SEM; n = 2–8). Asterisks indicate statistical significance by one-way ANOVA. p values were corrected for multiple comparison (Tukey). (D) DC-SIGN expression on WT CD4 T cells after 2 days co-culture with M2, either non-targeting control (NTC) or DC-SIGN KO (KO) (mean ± SEM; n = 3). Isolated CD4 T cells served as control (-). Asterisks indicate statistical significance by one-way ANOVA. p values were corrected for multiple comparison (Tukey). (E) CD32 expression on PBMCs and CD4 T cells after 3 days of culture in presence of absence of PHA/IL-2 (median with 95% CI; n = 6). Asterisks indicate statistical significance by one-way ANOVA relative to unstimulated (Not stim.) CD4 T cells. p values were corrected for multiple comparison (Tukey). (F) CD32 expression on CD4 T cells, PBMCs depleted of CD14+ cells, PBMCs or co-cultures of autologous CD4 T cell/CD14+ cells (mean ± SEM; n = 6). Asterisks indicate statistical significance by one-way ANOVA. p values were corrected for multiple comparison (Tukey). (G) CD14+ monocytes were differentiated into the indicated myeloid lineages (see Figure S3B) and co-cultured with autologous CD4 T cells for 2 days with or without (Transwell) direct cell-cell contact. Bottom: CD4 T cells migrated to the Transwell bottom and thus had direct contact with differentiated myeloid cells. Mean ± SEM of CD32+ T CD4 cells are shown (n = 3). Asterisks indicate statistical significance by two-way ANOVA test. p values were corrected for multiple comparison (Tukey). (H) CD32 expression on CD14+ monocytes and cells derived by lineage-specific differentiation after 1 week of cultivation. One representative donor is shown (n = 3). (I) Pearson correlation plot for CD32 surface expression on monocyte-derived cells (MFI) and autologous CD4 T cells (percentage of CD32+ cells) after 2 days of co-culture. (J) CD32 expression on CD4 T cells residing in peripheral blood (n = 23), tonsil (n = 6), or lamina propria of jejunum or ileum (n = 6) was assessed by flow cytometry. Median with 95% CI are shown. Asterisks indicate statistical significance by one-way ANOVA. p values were corrected for multiple comparison (Dunnett). ∗p ≤ 0.05, ∗∗p ≤ 0.01, ∗∗∗p ≤ 0.001.
Figure 2
Figure 2
Characterization of CD32-driven trogocytosis (A) 293T cells transiently expressing C-terminal GFP fusion proteins of FcγRs CD32A, CD32B, or CD32C or, as a control, the nucleocytoplasmic dNTPase SAMHD1 served as donors in co-cultures with CellTrace dye-stained SupT1 T target cells. All culture media contained IgG-depleted FCS. Shown are representative flow cytometry dot plots and the percentages of CD32+ and GFP+ target T cells. One experiment out of two is shown. (B) Schematic of topology determination of transferred CD32-GFP (top). Bottom: SupT1 T cells were co-cultured as described in (A) and stained with either an anti-GFP mAb or an isotype control antibody, both conjugated to Alexa 647, with or without prior cell permeabilization. One representative experiment is shown (n = 3). The illustration was created with BioRender.com. (C) 293T cells were co-transfected with plasmids encoding C-terminal GFP fusion proteins of CD32A, CD32B, or CD32C or, as a control, histone H2B-GFP, together with a plasmid encoding CCR5. After 2 days, cells were either left untreated or pre-treated with an anti-CD32 Ab or an isotype control Ab prior to co-cultivation with SupT1 T cells. One day later, the expression of GFP and CCR5 on the target T cells was determined by flow cytometry. Mean ± SEM are shown (n = 3). Asterisks indicate statistical significance by two-way ANOVA. p values were corrected for multiple comparison (Tukey). (D) Half-life of CD32 and CCR5 surface expression on SupT1 target cells following co-culture as in (A). Following 1 day of co-culture, SupT1 T cells positive for CD32-GFP were sorted by flow cytometry and kept in culture for an additional 9 days. The expression of CD32 (top) or CCR5 (bottom) on sorted cells was determined for up to 192 h of cultivation. One representative experiment is shown (n = 2). (E) Schematic of CD32B with important amino acids and motifs indicated. (F) Transfer of the indicated CD32B mutants, CD32A WT, CD32C WT, or H2B (GFP fusion proteins), assessed as in (A) (mean ± SEM; n = 4). Asterisks indicate statistical significance by one-way ANOVA. p values were corrected for multiple comparison (Dunnett). (G) Visualization of the material transfer from CD32B-GFP expressing 293T cells to LifeAct-mCherry-expressing SupT1 using live-cell imaging. 293T cells transiently expressing CD32B-GFP (green) were co-cultured with LifeAct-mCherry-expressing SupT1 cells (magenta), cultivated in IgG-depleted FCS and boosted with PGT151 antibody, and imaged using spinning disc microscopy for 4 h. The left panel shows the beginning of co-culture. (a) Labels the area with the first transfer event (middle panel). (b) Labels the area of the second transfer event (right panel). Dashed white box marks the area that is zoomed and depicted with individual time points before and after the transfer event (shown below). The time stamp (upper right corner, relative to the time frame which shows the transfer event (time 00:00) in zoom-ins). Scale bar, 10 μm. ∗p ≤ 0.05; ∗∗p ≤ 0.01; ∗∗∗p ≤ 0.001.
Figure 3
Figure 3
CD32-driven trogocytosis is boosted by T cell-autoreactive antibodies associated with chronic HIV-1 infection (A) CD32 expression on CD4 T cells from peripheral blood of healthy donors (HD) (n = 23) and chronic HIV-1 infected patients (CHI) (n = 39). Median with 95% CI are shown. Asterisks indicate statistical significance by Mann-Whitney test. (B) 293T cells transiently co-expressing CD32B-GFP and CCR5 were pre-treated with the indicated patient sera before 1 day of co-culture with SupT1 T cells. Shown are the percentage of CD32B-GFP+ and CCR5+ target cells (median with 95% CI, each dot represents a different patient; see also Figure S7C). CHI, chronic HIV-1 infection; ART, anti-retroviral therapy; AHI, acute HIV-1 infection. Fiebig stages II-III of acute HIV-1 infection; HIV-2, HIV type 2; HTLV-1, human T cell lymphotropic virus type 1; HCV, hepatitis C virus; DENV, dengue virus; YFV, yellow fever virus-vaccinated; SARS-CoV-2, severe acute respiratory syndrome coronavirus type 2; EC, Echinococcus multilocularis; SCH, Schistosoma spp.; TB, Mycobacterium tuberculosis; RA, rheumatoid arthritis; SLE, systemic lupus erythematosus; CG, cryoglobulinemia. Asterisks indicate statistical significance by Mann-Whitney test. (C) Percentage of GFP+ target cells after 1 day of co-culture with 293T cells as in (B). IgG was depleted from the sera of two healthy donor (HD) and two HIV-1 patient (CHI) samples from (B, pink and red) and input (original sera), flowthrough and eluate of the IgG depletion were used for pre-treatment of cells prior to co-culture. Mean of two donors from each category is shown. (D) Correlation of antibody binding to SupT1 T cells and CD32B-GFP trogocytosis as in (B), with sera from HIV-1 patients. P, Pearson correlation coefficient. (E) Binding of sera with high or low trogocytotic activity (pink and red dots in B) to primary CD4 T cells as detected with fluorochrome-coupled anti-human IgG Ab (median with 95% CI, CD4 T cells; n = 3). Kruskal-Wallis test with Dunn’s multiple-testing correction. (F) A panel of bNAbs was analyzed for binding to uninfected resting CD4 T cells (top) or activated CD4 T cells (bottom). Mean ± SEM; n = 3. Asterisks indicate statistical significance by one-way ANOVA (top) or three-way ANOVA (bottom). p values were corrected for multiple comparison (Dunnett). (G) Purified, CMV-encoded, soluble Fc-binding proteins gp34 and gp68, or control proteins gp34 non-binding mutant (mtrp; W65F) and soluble ICOSL (inducible T cell co-stimulator ligand) were added to 293T donor cells as in (A), in the presence of PGT151 Ab, and subsequently co-cultured with SupT1 T cells. CD32 transfer was evaluated as in (B). Asterisks indicate statistical significance by two-way ANOVA. p values were corrected for multiple comparison (Tukey). ∗p ≤ 0.05, ∗∗p ≤ 0.01, ∗∗∗p ≤ 0.001; n.s., not significant. (H) Schematic of the determinants of antibodies for trogocytosis enhancement.
Figure 4
Figure 4
Trogocytosed receptors are functional and CD32+ membrane patches on resting CD4 T cells preferentially bind virions and enhance HIV-1 fusion (A) SDF-1α (CXCL12)/CXCR4 migration assay. CXCR4 KO CD4 T cells were co-cultured with HeLa cells transiently co-expressing CD32B-GFP or H2B-GFP (control) together with CXCR4. Prior to co-culture, HeLa donor cells were pre-treated with or without anti-CD32 mAbs. One day after co-culture, CD4 T cells were placed into the top chamber of a Transwell and SDF-1α was added to the bottom chamber. Migrating cells collected were counted by flow cytometry. CXCR4 WT and KO CD4 T cells without co-culture were used as positive and negative control (mean ± SEM; n = 3). Asterisks indicate statistical significance by one-way ANOVA. p values were corrected for multiple comparison (Tukey). (B) RANTES (CCL-5)/CCR5 migration assay. HeLa cells transiently co-expressing CD32B-GFP and CCR5 were co-cultured with CD4 T cells and the latter analyzed for migration toward CCL-5 (assay setup as in A) (mean ± SEM; n = 3). Asterisks indicate statistical significance by one-way ANOVA. p values were corrected for multiple comparison (Dunnett). (C) CD11b binding assay. Following co-culture of M2 with autologous CD4 T cells for 48 h, T cells were sorted and cultured in plates coated with or without the ICAM-1 ligand. Attached cells were quantified by luminometry (mean cell binding ± SEM normalized to wells with input cells without washing; n = 3). Asterisks indicate statistical significance by two-way ANOVA. p values were corrected for multiple comparison (Tukey). (D) HIV-1 binding, fusion, or infection of (CellTrace+) CD4 T cells following co-culture with autologous M2. The illustration was created with BioRender.com. (E) HIV-1 binding assay. M2-co-cultured CD4 T cells were sorted and challenged with HIV-1 Vpr-GFP particles. Shown is GFP and CD32 positivity of target CD4 T cells (mean ± SEM; n = 4). Asterisks indicate statistical significance by two-way ANOVA (see Figures S14A–S14C for confocal microscopy images). p values were corrected for multiple comparison (Tukey). (F) CD4 T cells were co-cultured with biotin-xx-conjugated cholera toxin subunit-B (CT-B)-labeled M2, sorted, challenged with HIV-1 Vpr-GFP (see also Figures S14D–S14F), and stained for CD32 and fluorochrome-conjugated streptavidin. Shown are representative confocal microscope micrographs. White arrow heads: co-localization of CD32, HIV-1 Vpr-GFP, and CT-B. Scale bars, 5 μm. (G) HIV-1 fusion assay. CD4 T cells were co-cultured with autologous M2, isolated and used in an HIV-1 fusion assay using two multiplicities of infection (MOIs). Shown is the percentage of cells that allowed virion fusion (mean ± SEM; n = 5). Asterisks indicate significance by two-tailed paired t test. ∗p ≤ 0.05, ∗∗p ≤ 0.01, ∗∗∗p ≤ 0.001; n.s., not significant. (H) HIV-1 infection assay. CD4 T cells were co-cultured with autologous M2, isolated, and infected with HIV-1 at different MOIs. Shown is the percentage of infected cells (mean ± SEM; n = 7–11). Asterisks indicate significance by two-tailed paired t test. (I) M2 were pre-treated with alemtuzumab or an isotype control antibody and then co-cultured with autologous CD4 T cells. Sorted CD4 T cells were incubated with X4 HIV-1 (left panel) or R5 HIV-1 (right panel), carrying Vpr-BlaM, and virion fusion was quantified. Pearson correlations between CD32 positivity and HIV-1 fusion are shown. ∗p ≤ 0.05, ∗∗p ≤ 0.01, ∗∗∗p ≤ 0.001; n.s., not significant.
Figure 5
Figure 5
Transferred membrane patches on resting CD4 T cells preferentially enhance HIV-1 fusion and infection by endogenously expressed CD4 recruitment (A) HIV-1 binding to CD4 T cells following co-culture with M2 and addition of anti-CD4 antibodies, isotype control antibodies, or antibodies against efficiently transferred receptors (mean ± SEM; n = 3). Asterisks indicate statistical significance by two-way ANOVA. p values were corrected for multiple comparison (Šídák). (B) HIV-1 binding to CD4 KO or NTC CD4 T cells after co-culture with autologous M2 (mean ± SEM; n = 3). Asterisks indicate statistical significance by two-way ANOVA. p values were corrected for multiple comparison (Šídák). (C) Confocal microscope images of CD32 and CD4 localization on CD4 T cells that were challenged with HIV-1 Vpr-GFP following co-culture with unlabeled M2. White arrow heads indicate the co-localization of CD32, HIV-1 Vpr-GFP, and clustered CD4 (see also Figure S16C). Scale bar, 5 μm. ∗p ≤ 0.05, ∗∗p ≤ 0.01, ∗∗∗p ≤ 0.001; n.s., not significant. (D) Schematic model of trogocytotic transfer of CD32+ membrane patches from macrophages to CD4 T cells resulting (a) in the transfer of functional chemokine receptors to CD4 T cells with macrophage-like chemotactic properties and adhesion behavior and/or (b) the recruitment of the endogenous CD4 receptor to these specialized membrane sites providing functional platforms for enhanced binding and infection of HIV-1.

References

    1. Zola H., Swart B., Banham A., Barry S., Beare A., Bensussan A., Boumsell L., D Buckley C., Bühring H.J., Clark G., et al. CD molecules 2006--human cell differentiation molecules. J. Immunol. Methods. 2007;319:1–5. doi: 10.1016/j.jim.2006.11.001. - DOI - PubMed
    1. Tatari-Calderone Z., Semnani R.T., Nutman T.B., Schlom J., Sabzevari H. Acquisition of CD80 by human T cells at early stages of activation: functional involvement of CD80 acquisition in T cell to T cell interaction. J. Immunol. 2002;169:6162–6169. doi: 10.4049/jimmunol.169.11.6162. - DOI - PubMed
    1. Game D.S., Rogers N.J., Lechler R.I. Acquisition of HLA-DR and costimulatory molecules by T cells from allogeneic antigen presenting cells. Am. J. Transplant. 2005;5:1614–1625. doi: 10.1111/j.1600-6143.2005.00916.x. - DOI - PubMed
    1. Baba E., Takahashi Y., Lichtenfeld J., Tanaka R., Yoshida A., Sugamura K., Yamamoto N., Tanaka Y. Functional CD4 T cells after intercellular molecular transfer of 0X40 ligand. J. Immunol. 2001;167:875–883. doi: 10.4049/jimmunol.167.2.875. - DOI - PubMed
    1. Evans H.M., Schultz D.F., Boiman A.J., McKell M.C., Qualls J.E., Deepe G.S., Jr. Restraint of Fumarate Accrual by HIF-1α Preserves miR-27a-Mediated Limitation of Interleukin 10 during Infection of Macrophages by Histoplasma capsulatum. mBio. 2021;12 doi: 10.1128/mBio.02710-21. - DOI - PMC - PubMed