Entropy Tug-of-War Determines Solvent Effects in the Liquid-Liquid Phase Separation of a Globular Protein
- PMID: 38580324
- PMCID: PMC11033941
- DOI: 10.1021/acs.jpclett.3c03421
Entropy Tug-of-War Determines Solvent Effects in the Liquid-Liquid Phase Separation of a Globular Protein
Abstract
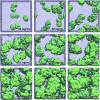
Liquid-liquid phase separation (LLPS) plays a key role in the compartmentalization of cells via the formation of biomolecular condensates. Here, we combined atomistic molecular dynamics (MD) simulations and terahertz (THz) spectroscopy to determine the solvent entropy contribution to the formation of condensates of the human eye lens protein γD-Crystallin. The MD simulations reveal an entropy tug-of-war between water molecules that are released from the protein droplets and those that are retained within the condensates, two categories of water molecules that were also assigned spectroscopically. A recently developed THz-calorimetry method enables quantitative comparison of the experimental and computational entropy changes of the released water molecules. The strong correlation mutually validates the two approaches and opens the way to a detailed atomic-level understanding of the different driving forces underlying the LLPS.
Conflict of interest statement
The authors declare no competing financial interest.
Figures


Similar articles
-
Real-time measure of solvation free energy changes upon liquid-liquid phase separation of α-elastin.Biophys J. 2024 Jun 4;123(11):1367-1375. doi: 10.1016/j.bpj.2023.07.023. Epub 2023 Jul 28. Biophys J. 2024. PMID: 37515326 Free PMC article.
-
A Combined Approach to Extract Rotational Dynamics of Globular Proteins Undergoing Liquid-Liquid Phase Separation.J Phys Chem B. 2025 Jan 30;129(4):1185-1196. doi: 10.1021/acs.jpcb.4c06259. Epub 2025 Jan 16. J Phys Chem B. 2025. PMID: 39815790
-
Thermodynamic forces from protein and water govern condensate formation of an intrinsically disordered protein domain.Nat Commun. 2023 Sep 21;14(1):5892. doi: 10.1038/s41467-023-41586-y. Nat Commun. 2023. PMID: 37735186 Free PMC article.
-
Liquid-liquid phase separation (LLPS) in DNA and chromatin systems from the perspective of colloid physical chemistry.Adv Colloid Interface Sci. 2024 Apr;326:103133. doi: 10.1016/j.cis.2024.103133. Epub 2024 Mar 14. Adv Colloid Interface Sci. 2024. PMID: 38547652 Review.
-
Temperature, Hydrostatic Pressure, and Osmolyte Effects on Liquid-Liquid Phase Separation in Protein Condensates: Physical Chemistry and Biological Implications.Chemistry. 2019 Oct 11;25(57):13049-13069. doi: 10.1002/chem.201902210. Epub 2019 Aug 22. Chemistry. 2019. PMID: 31237369 Review.
Cited by
-
Unraveling the hydration dynamics of ACC1-13K24 with ATP: From liquid to droplet to amyloid fibril.Biophys J. 2024 Nov 19;123(22):3863-3870. doi: 10.1016/j.bpj.2024.09.011. Epub 2024 Sep 11. Biophys J. 2024. PMID: 39262114 Free PMC article.
-
Thioflavin T─a Reporter of Microviscosity in Protein Aggregation Process: The Study Case of α-Synuclein.J Phys Chem Lett. 2024 Jun 27;15(25):6685-6690. doi: 10.1021/acs.jpclett.4c00699. Epub 2024 Jun 20. J Phys Chem Lett. 2024. PMID: 38899873 Free PMC article.
-
Heterogeneous Slowdown of Dynamics in the Condensate of an Intrinsically Disordered Protein.J Phys Chem Lett. 2024 Nov 14;15(45):11244-11251. doi: 10.1021/acs.jpclett.4c02142. Epub 2024 Nov 1. J Phys Chem Lett. 2024. PMID: 39486437 Free PMC article.
-
Backbone-mediated weakening of pairwise interactions enables percolation in peptide-based mimics of protein condensates.Commun Chem. 2025 Apr 6;8(1):106. doi: 10.1038/s42004-025-01502-5. Commun Chem. 2025. PMID: 40188296 Free PMC article.
-
Protein Crowding Effects on Hydration Water Dynamics.J Phys Chem Lett. 2025 Mar 6;16(9):2340-2347. doi: 10.1021/acs.jpclett.4c03391. Epub 2025 Feb 24. J Phys Chem Lett. 2025. PMID: 39993918 Free PMC article.
References
MeSH terms
Substances
LinkOut - more resources
Full Text Sources

