Clinical Trial
. 2024 Aug 8;73(9):1454-1463.
doi: 10.1136/gutjnl-2023-331696.

Fluorescently labelled vedolizumab to visualise drug distribution and mucosal target cells in inflammatory bowel disease

Affiliations
Clinical Trial

Fluorescently labelled vedolizumab to visualise drug distribution and mucosal target cells in inflammatory bowel disease

Ruben Y Gabriëls et al. Gut. .

Abstract

Objective: Improving patient selection and development of biological therapies such as vedolizumab in IBD requires a thorough understanding of the mechanism of action and target binding, thereby providing individualised treatment strategies. We aimed to visualise the macroscopic and microscopic distribution of intravenous injected fluorescently labelled vedolizumab, vedo-800CW, and identify its target cells using fluorescence molecular imaging (FMI).

Design: Forty three FMI procedures were performed, which consisted of macroscopic in vivo assessment during endoscopy, followed by macroscopic and microscopic ex vivo imaging. In phase A, patients received an intravenous dose of 4.5 mg, 15 mg vedo-800CW or no tracer prior to endoscopy. In phase B, patients received 15 mg vedo-800CW preceded by an unlabelled (sub)therapeutic dose of vedolizumab.

Results: FMI quantification showed a dose-dependent increase in vedo-800CW fluorescence intensity in inflamed tissues, with 15 mg (153.7 au (132.3-163.7)) as the most suitable tracer dose compared with 4.5 mg (55.3 au (33.6-78.2)) (p=0.0002). Moreover, the fluorescence signal decreased by 61% when vedo-800CW was administered after a therapeutic dose of unlabelled vedolizumab, suggesting target saturation in the inflamed tissue. Fluorescence microscopy and immunostaining showed that vedolizumab penetrated the inflamed mucosa and was associated with several immune cell types, most prominently with plasma cells.

Conclusion: These results indicate the potential of FMI to determine the local distribution of drugs in the inflamed target tissue and identify drug target cells, providing new insights into targeted agents for their use in IBD.

Trial registration number: NCT04112212.

Keywords: ANTIBODY TARGETED THERAPY; FLUORESCENCE ENDOSCOPY; IBD; PHARMACOKINETICS.


Conflict of interest statement

Competing interests: GD received research grants from Royal DSM, Takeda and Janssen Pharmaceuticals and speaker fees from AbbVie, Pfizer, Takeda and Janssen Pharmaceuticals. EAMF is supported by a ZonMW Clinical Fellowship grant (project number 90719075) and has received an unrestricted research grant from Takeda. MD and SJ are employees and shareholders of Regeneron Pharmaceuticals.

Figures

Figure 1
Figure 1
Overview of the procedures included in this study. (1) The fluorescent tracer vedo-800CW was produced in accordance with Good Manufacturing Practice (GMP). (2) Vedo-800CW with or without unlabelled vedolizumab (where applicable) was administered intravenously 2–4 days prior to endoscopy. (3) A tandem in vivo procedure including high-definition white light endoscopy (HD-WLE) and fluorescence molecular endoscopy was performed in order to image the drug’s distribution. (4) Fluorescence intensity was quantified ex vivo on formalin-fixed paraffin-embedded (FFPE) blocks in all biopsies. (5) Finally, 4 μm tissue sections were used to assess histopathological inflammation status based on H&E staining, to visualise the microscopic drug distribution and to identify immune target cell types.
Figure 2
Figure 2
Schematic diagram depicting the various patient cohorts included in phase A and phase B of the study. In total, 43 fluorescence molecular imaging (FMI) procedures were performed. In phase A, three doses of vedo-800CW (0, 4.5 and 15 mg) were administered to vedolizumab-naïve patients (n=5 patients each). The 15 mg cohort was then increased to 15 patients. In phase B, both a subtherapeutic dose (75 mg) and a therapeutic dose (300 or 600 mg) of unlabelled vedolizumab were administered, followed by a 15 mg dose of vedo-800CW. Note that six patients participated in both phase A and phase B; thus, a total of 37 patients were included in this trial.
Figure 3
Figure 3
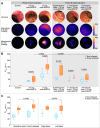
In vivo visualisation and ex vivo quantification. (A) Representative high-definition white light endoscopy (HD-WLE) images (top row) of active inflamed tissue, with corresponding in vivo (middle row) and ex vivo (bottom row) fluorescence images in the indicated cohorts. All fluorescence images were scaled per modality in relation to one another to allow interimage comparisons. (B) Box plot summarising mean fluorescence intensity (FImean) calculated from fluorescence scans of all biopsies in all cohorts, with p values indicated (Mann-Whitney U test). (C) Box plot summarising the results obtained from the 15 mg cohort in phase A, stratified by disease subtype and disease location, with p values indicated (Mann-Whitney U test).
Figure 4
Figure 4
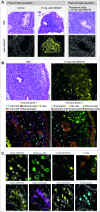
Microscopic distribution of vedo-800CW and target cell identification. (A) Representative fluorescence microscopy images of biopsy sections obtained from patients with active inflammation in the 0 mg cohort (left), the 15 mg cohort (middle) and the therapy+15 mg cohort (right); the nuclei were counterstained with DAPI shown in grey. Shown above each vedo-800CW fluorescence image is the corresponding H&E-stained section. Note the considerably stronger fluorescence signal in the patient in the 15 mg group compared with the other two patients. (B) Representative images showing an active inflamed H&E section (left) with the adjacent correlation between the distribution of vedolizumab (measured as vedo-800CW fluorescence; right) in tissue sections. The same sections immunostained for two distinct immune panels are shown below. Note that the section stained for immune panel II (right) shows an abundance of plasma cells (green) in an area also containing a high number of vedo-800CW-positive cells (yellow), while the section stained for immune panel I (left) shows colocalisation between vedo-800CW fluorescence and macrophages (purple). In contrast, there is little correlation between vedolizumab localisation and CD3+ or CD8+ T cells (stained green in the red and blue). (C) Representative high-magnification images showing the spatial correlation between either surface or intracellular vedo-800CW fluorescence (left images in each pair) and specific immune cell types (right images). NK, natural killer.

References

    1. Cohen NA, Rubin DT. New targets in inflammatory bowel disease therapy: 2021. Curr Opin Gastroenterol 2021;37:357–63. 10.1097/MOG.0000000000000740 - DOI - PMC - PubMed
    1. Macaluso FS, Ventimiglia M, Orlando A. Effectiveness and safety of Vedolizumab in inflammatory bowel disease: a comprehensive meta-analysis of observational studies. J Crohns Colitis 2023;17:1217–27. 10.1093/ecco-jcc/jjad043 - DOI - PubMed
    1. Meserve J, Dulai P. n.d. Predicting response to Vedolizumab in inflammatory bowel disease. Front Med 7. 10.3389/fmed.2020.00076 - DOI - PMC - PubMed
    1. Gabriëls RY, Bourgonje AR, von Martels JZH, et al. Mucosal eosinophil abundance in non-inflamed colonic tissue is associated with response to Vedolizumab induction therapy in inflammatory bowel disease. J Clin Med 2022;11:4141. 10.3390/jcm11144141 - DOI - PMC - PubMed
    1. Battat R, Dulai PS, Vande Casteele N, et al. Biomarkers are associated with clinical and endoscopic outcomes with Vedolizumab treatment in ulcerative colitis. Inflamm Bowel Dis 2019;25:410–20. 10.1093/ibd/izy307 - DOI - PMC - PubMed

Publication types

MeSH terms

Associated data

LinkOut - more resources